
Research article · 2024 · Full text
International Journal of Advanced Biochemistry ResearchIdentification of simple sequence repeats (SSRS) for TLCV resistacne in tomato (Solanum lycopersicum L.)
Volume 8(1S) · Pages 173–184 · DOI: 10.33545/26174693.2024.v8.i1sc.302 ↗
Research areasPlant Virus Research StudiesInsect-Plant Interactions and ControlPlant pathogens and resistance mechanisms
Abstract
Author-writtenTLCV (Tomato leaf curl virus) is most destructive disease in tomato causes severe losses of up to 100%. It is transmitted by sole vector whitefly (Bemisia tabaci). Breeding of disease resistance is only truthful approach to combat the disease consists marker assisted selection (MAS). Therefore, the present investigation was carried out using of 110 F2 mapping population individuals of cross ATL-97-26×GP-11. SSRs marker analysis was carried out to identify with a set of 374 SSRs were used for marker analysis. Parental polymorphic markers were utilized in genotyping of 110 F2 mapping population individuals. Morphological and biochemically important traits like plant height, number of branches per plants, number of fruits per plant, disease incidence score, phenol content, moisture, total soluble Solids, terrible acidity, total soluble sugar, total flavonoids, lycopene and ascorbic acid content in 110 individuals of F2:3 mapping population derived from cross of ATL-97-26×GP-11. The phenol content showed significant negatively correlation with disease incidence. Single marker analysis (SMA) found 9 marker trait association with above threshold level 3. The higher number of marker trait associations was found for phenol content and disease incidence. The phenol content and other morpho-biochemical traits are in current study can be exploited for develop hybrid of elite parental line/cultivars of tomato through marker assisted breeding programme. The SSRs markers i.e., TES0312, SSR112 and SSR331 identified from this study could be useful for TLCV resistance breeding in tomato.
Summary
Source-checkedPlain-language reading of the full paper, prepared with AI and checked against the text. Each point links to the authors' own words.
Why it matters
- Tomato leaf curl virus (TLCV) is a highly destructive disease that can cause total crop losses of up to 100%. View evidence ↗
- Marker-assisted selection (MAS) for disease resistance is considered the most effective approach to combat TLCV. View evidence ↗
The question
- The study aimed to identify simple sequence repeat (SSR) markers linked to TLCV resistance using a mapping population of 110 F2 individuals from a cross between ATL-97-26 and GP-11. View evidence ↗
What they did
- The research used parental lines ATL-97-26 and GP-11 to develop an F2 population of 110 individuals in 2020. View evidence ↗
- A total of 374 SSR markers were screened for parental polymorphism, and the resulting polymorphic markers were used to genotype the F2 population via capillary electrophoresis. View evidence ↗
- Biochemical parameters measured included total phenol, moisture content, total soluble solids, total soluble sugars, total flavonoids, lycopene, and ascorbic acid. View evidence ↗
What they found
- Phenol content showed a significant negative correlation with disease incidence (r = -0.780), suggesting that higher phenol levels are associated with lower disease incidence. View evidence ↗
- The positive additive effect for phenol content indicates that this trait is primarily governed by the resistant female parent, ATL-97-26. View evidence ↗
What it means
- The authors conclude that the identified SSR markers TES0312, SSR112, and SSR331 are useful tools for breeding TLCV resistance in tomato. View evidence ↗
- The authors state that the identified markers need to be validated in other genetic backgrounds of tomato. View evidence ↗
Visual summary
3 visualsIllustrations explain the paper; charts are replotted from the paper's own table values.
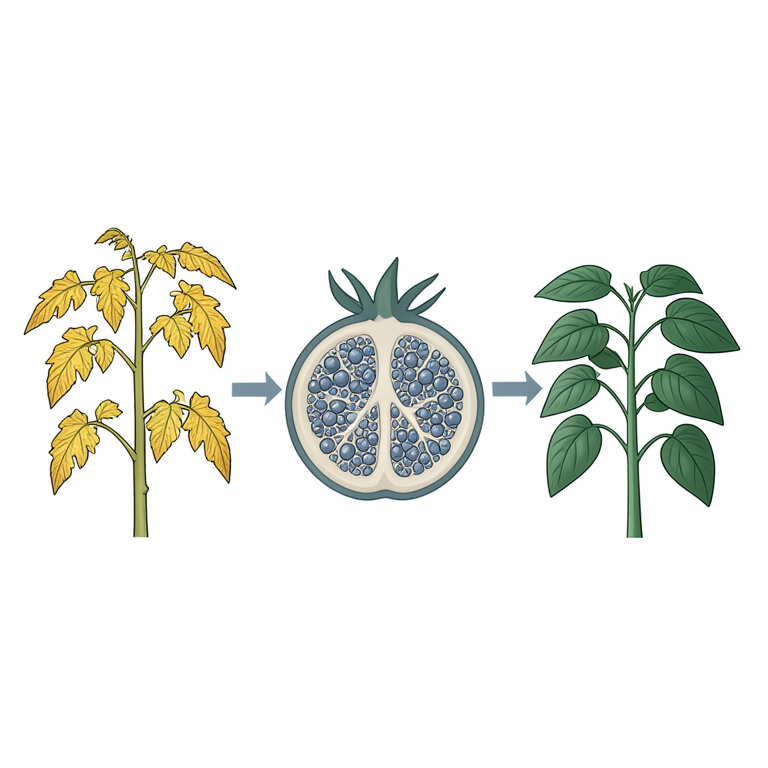
Marker-Trait Association Flow
AI-generated conceptual illustration (tomato plants (Solanum lycopersicum L.)). It explains the idea and does not show study data.
View source evidence ↗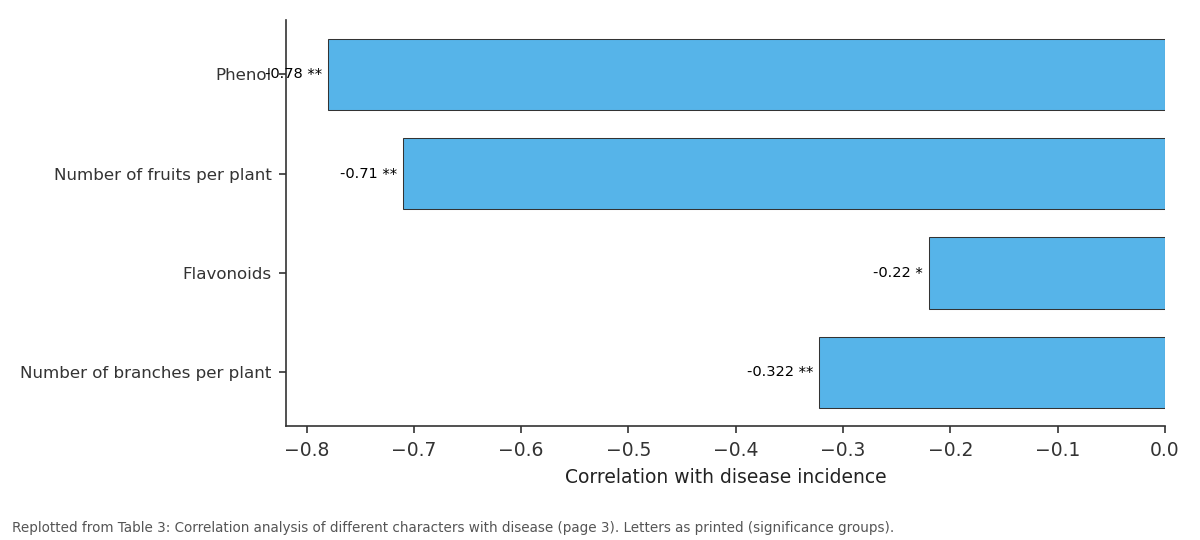
Disease incidence (n=110): Phenol vs Number of fruits per... vs Flavonoids vs Number of branches per...
Replotted from Table 3 (page 3) of the original paper. Every bar is the paper's own table value.
View source evidence ↗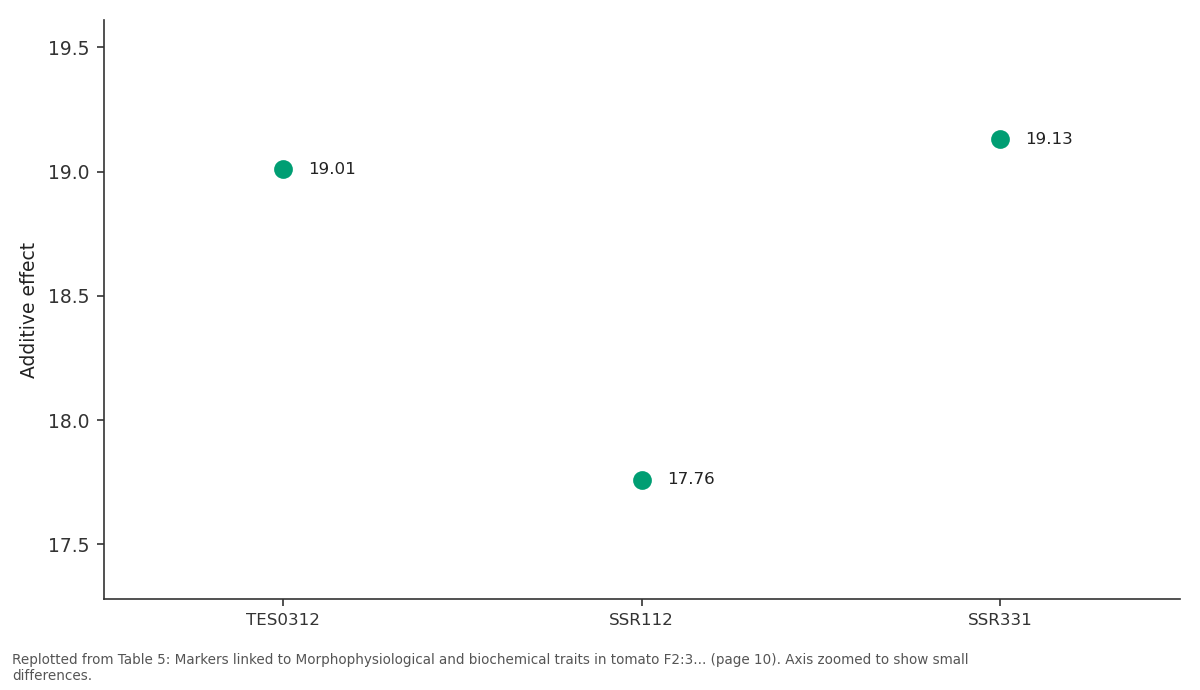
Add.: TES0312 vs SSR112 vs SSR331
Replotted from Table 5 (page 10) of the original paper. Every bar is the paper's own table value.
View source evidence ↗Figures & tables
From the original paper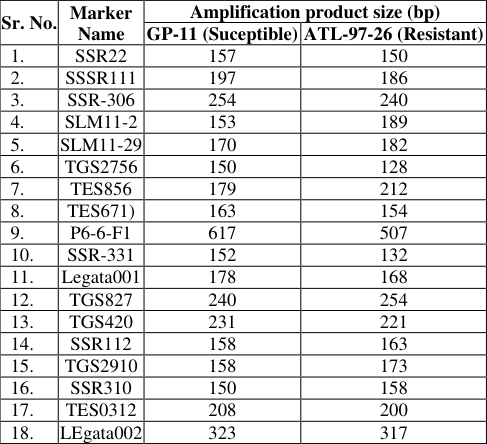 Table 1
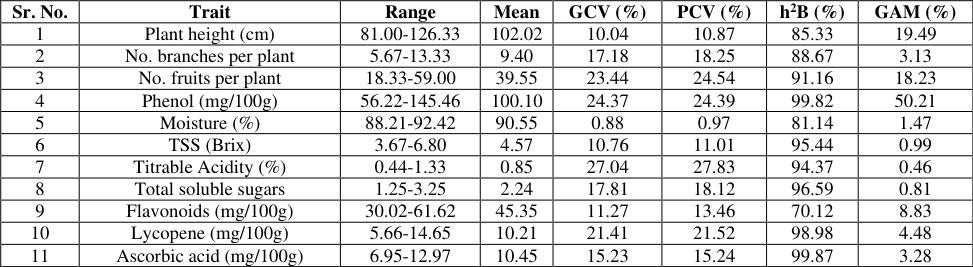 Table 2
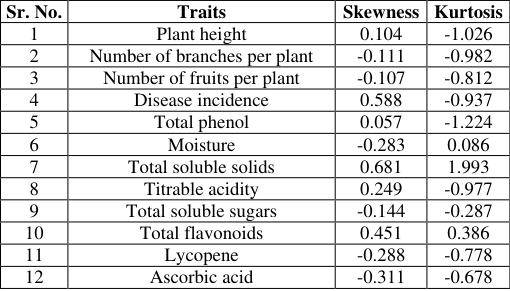 Table 4
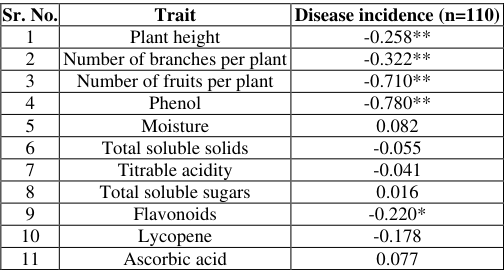 Table 3
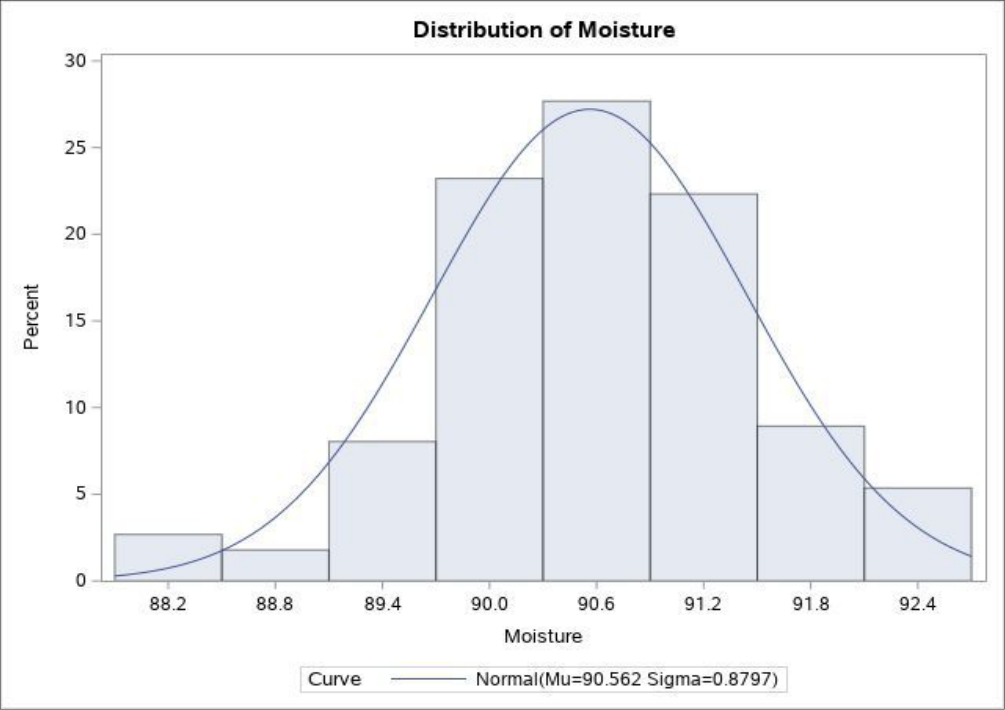 Figure 1
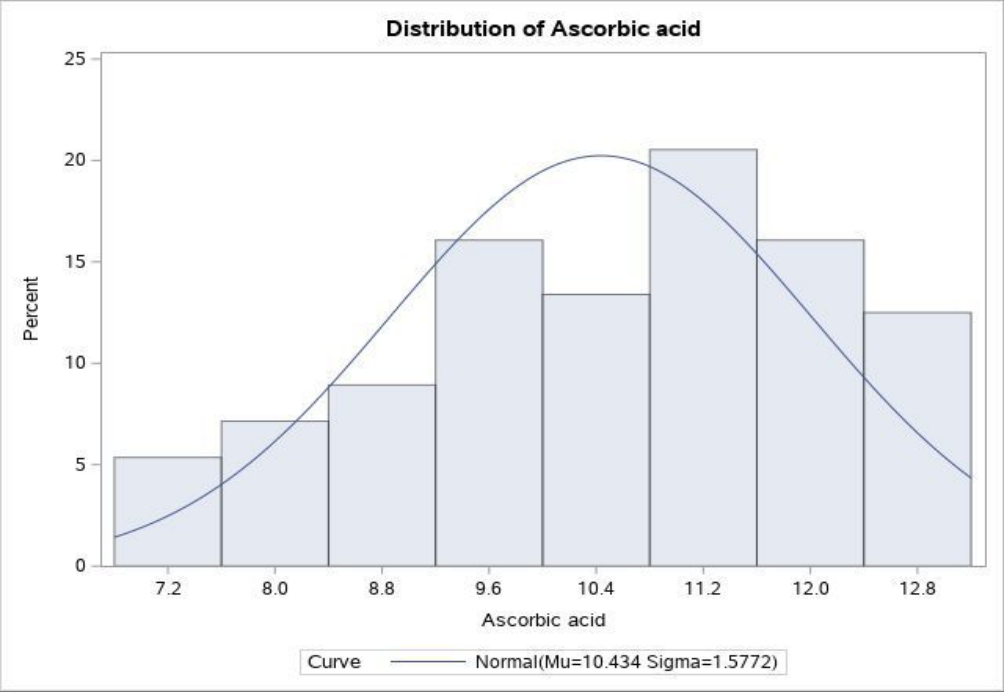 Figure 1
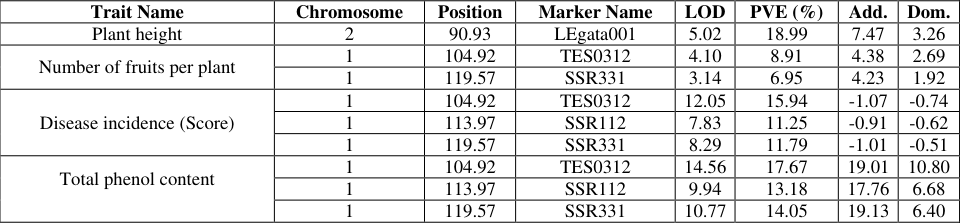 Table 5
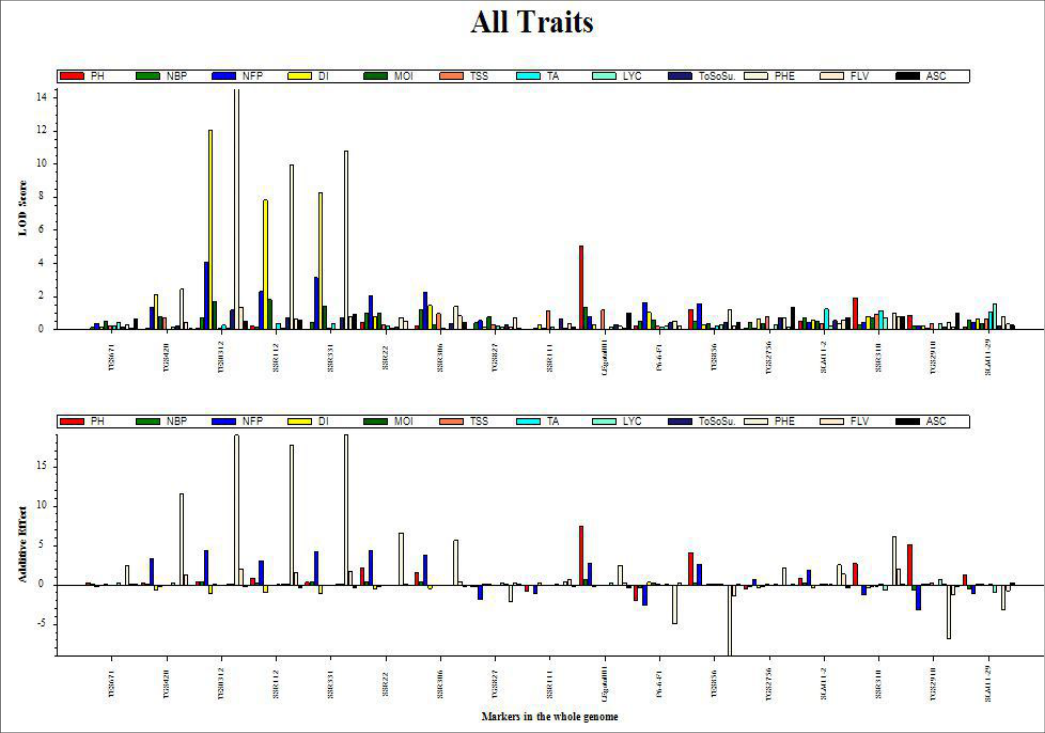 Figure 2
Introduction
Tomato (Solanum lycopersicum L., 2n=2x=24) is one of the most important vegetable plants in the world belong to nightshade family Solanaceae. It originated in western South America. According to data of FAOSTAT-2021, India held the position of the second-largest global tomato producer, trailing only behind China. The country cultivated tomatoes across 840.3 thousand hectares, contributing a substantial 21.181 million tonnes to the overall global production [12] . The major Tomato producing States in the India are Madhya Pradesh, Andhra Pradesh, Karnataka, Gujarat, Odisha, West Bengal, Maharashtra, Chhattisgarh, Bihar, Telangana, Uttar Pradesh, Haryana and Tamil Nadu, they account for 91% of the total production of the country (NHB, 2021) [26] . Low productivity in India is due to occurrence of both biotic and abiotic stresses. Tomato yellow leaf curl virus (TLCV) is a very damaging virus disease of tomato crops in tropical and warm temperate regions of the world, causing losses of up to 100%. It belongs to family Geminiviridae (Gronenborn, 2007) [14] . Symptoms of TYLCV disease on tomato are characterized by curling of leaves upward and inward, in a cup-shaped manner, curling of lamina between veins, swelling of veins on leaf surfaces, reduction in leaf size with shortened internodes and proliferated lateral branches, plant stunting with distorted growing tips and chlorotic leaflets, flower drop and formation of small sized fruit (Banerjee and Kalloo, 1987, Singh et al., 2015) [3,33] . Breeding for resistance to TLCV appears to be a promising and ecological approach to control the disease, which is started in the late 1970s. It has consisted of introgression resistant traits present in wild tomato species into cultivated varieties (Picó et al. 1999) [29] .
Molecular markers are specific fragments of DNA that can be identified within the whole genome. Molecular markers that are tightly linked may be referred to as 'gene tag' and these markers do not affect the phenotype of the gene of interest (Collard et al., 2005) [7] . Simple sequence repeats (SSRs) are regarded as a robust system for marker-assisted breeding due to their co-dominance nature, abundance, reproducibility and variability (Kumar et al., 2018) [20] . Comprehensive knowledge of complex plant traits including growth, development, tolerance, resistance, physiology, biochemical attributes, ecology, yield guides researcher, breeders towards the selection of productive plant that are suitable for their environment (Costa et al., 2019) [8] .
Materials and Methods
The ATL-97-26 and GP-11 was used as parental lines derived from main vegetable research station (MVRS), Anand Agricultural University, Anand, Gujarat to develop 110 individuals of F 2 population in year 2020. DNA was extracted newly expanded fresh leaves using Cetyl trimethyl ammonium bromide (CTAB) protocol with some modifications (Doyle and Doyle, 1990) [10] . A set of total 374 SSRs marker was used for identification of parent polymorphism, identified polymorphic SSRs markers was further used for genotyping of F 2 population through QIAxcel Screen Gel software of QIAgen capillary electrophoresis. The subsequent segregating mapping population of 110 individuals of F 2:3 was grown on field during November-2021. The observations on morphological characters were taken from five plants each of ATL-97-26, ATL-97-26 and F1, whereas 110 F 2:3 plants were observed individually for plant height (PH), number of branches per plants (NBP), number of fruits per plant (NFP), disease incidence score (DI) was recorded using standard procedures (Singh et al., 2015) [33] . The biochemical parameters like Total phenol were estimated by the method as described by Bray and Thorpe (1954) [5] , moisture content was estimated as per procedure developed by A.O.A.C. (2000) [1] , Total soluble solids were estimated by the method described by Harrill (1998) [15] using hand refractometer, total soluble sugars were determined using the phenolsulphuric acid method as described by Dubois et al. (1956) [11] , Total Flavonoids were estimated by the method described by Suman et al., 2014 [35] , Lycopene was determined using the method as described by Raganna, (1977) [31] , Ascorbic acid were estimated by the method described by Malik and Singh (1980) [22] . Correlation of disease incidence with others traits was performed by using of SAS system. Frequency distribution of the segregating generation was tested for normality by the Kolmogorov-Simirnov Z-statics, Cramer-Von Mises and Anderson-Darlington test using SAS software system (SAS Institute, North Carolina State University). Single Marker Analysis was performed with the help of software QTL IciMapping V4.2. The LOD score was set at 3.0 (Meng et al., 2015) [24] .
Results and Discussion
Results and Discussion
Genotyping using of SSRs in F2 mapping population
A set of 374 primers were employed for screening parental DNA samples i.e., ATL-97-26 and GP-11. Out of 374 primers, 318 primers got amplified whereas no amplification was seen for 56 primers. From the 318 amplified primers, 18 primers showed parent polymorphism. Polymorphism was decided on the basis of presence or absence of bands as well as difference in position of the bands (Table 1). Only the primers showing clear and distinct bands were considered to be polymorphic. Amplified primers were used for genotyping of F 2 mapping population. [6,18] . According to Deshmukh et al. (1986) [9] , phenotypic and genotypic coefficient of variation valued greater than 20% are regarded as high, values between 10 to 20% to be medium, whereas values less than 10% are considered to be low Heritability values were categorized as low (< 30%), moderate (30-60%) and high (> 60%). The genetic advance (GA %) on 5% selection intensity was estimated and classified as low (< 10%), moderate (10-20%) and high (> 20%) following the method given by Johnson et al. (1955) [18] . All the traits under studied showed high heritability. While wide variations are observed among the characters, the high GCV and PCV were observed for traits like number of fruits per plant, phenol content, titrable acidity and lycopene content. The moderate level of GCV and PCV were observed for plant height, number of branches per plant, total soluble solids, total soluble sugars and flavonoid content. While, moisture content was showed low GCV and PCV content (Table 2). These results indicated that wide range of variation along with heritability helps the selection of superior and desired lines for further improvement in tomato. Furthermore, the presence of narrow gap between GCV and PCV for all the characters suggested these traits studied has low environmental influence (Pujar, 2013) [30] . Similar findings for high heratability and wide variability for agronomical and Morphophysiological and biochemical traits present in tomato mentioned by previous studies. viz., Nandapuri et al. (1976) [25] , Mala and Vadivel (1999) [21] , Veershetty (2004) [37] , Haydar et al. (2007) [16] , Samadia et al. (2006) [32] Al-Aysh, et al. (2012) [2] , Islam et al. (2012) [17] , Gaikwad, (2012) [13] and Pujar, (2013) [30] .
| Sr. No. | Trait | Range | Mean | GCV (%) | PCV (%) | h2B (%) | GAM (%) |
|---|---|---|---|---|---|---|---|
| 1 | Plant height (cm) | 81.00-126.33 | 102.02 | 10.04 | 10.87 | 85.33 | 19.49 |
| 2 | No. branches per plant | 5.67-13.33 | 9.40 | 17.18 | 18.25 | 88.67 | 3.13 |
| 3 | No. fruits per plant | 18.33-59.00 | 39.55 | 23.44 | 24.54 | 91.16 | 18.23 |
| 4 | Phenol (mg/100g) | 56.22-145.46 | 100.10 | 24.37 | 24.39 | 99.82 | 50.21 |
| 5 | Moisture (%) | 88.21-92.42 | 90.55 | 0.88 | 0.97 | 81.14 | 1.47 |
| 6 | TSS (Brix) | 3.67-6.80 | 4.57 | 10.76 | 11.01 | 95.44 | 0.99 |
| 7 | Titrable Acidity (%) | 0.44-1.33 | 0.85 | 27.04 | 27.83 | 94.37 | 0.46 |
| 8 | Total soluble sugars | 1.25-3.25 | 2.24 | 17.81 | 18.12 | 96.59 | 0.81 |
| 9 | Flavonoids (mg/100g) | 30.02-61.62 | 45.35 | 11.27 | 13.46 | 70.12 | 8.83 |
| 10 | Lycopene (mg/100g) | 5.66-14.65 | 10.21 | 21.41 | 21.52 | 98.98 | 4.48 |
| 11 | Ascorbic acid (mg/100g) | 6.95-12.97 | 10.45 | 15.23 | 15.24 | 99.87 | 3.28 |
Table text extracted from the original PDF; superscript letters are shown inline. The original table image is below.
View original table image
| Sr. No. | Marker Name | Amplification product size (bp) | — |
|---|---|---|---|
| GP-11 (Suceptible) | ATL-97-26 (Resistant) | ||
| 1. | SSR22 | 157 | 150 |
| 2. | SSSR111 | 197 | 186 |
| 3. | SSR-306 | 254 | 240 |
| 4. | SLM11-2 | 153 | 189 |
| 5. | SLM11-29 | 170 | 182 |
| 6. | TGS2756 | 150 | 128 |
| 7. | TES856 | 179 | 212 |
| 8. | TES671) | 163 | 154 |
| 9. | P6-6-F1 | 617 | 507 |
| 10. | SSR-331 | 152 | 132 |
| 11. | Legata001 | 178 | 168 |
| 12. | TGS827 | 240 | 254 |
| 13. | TGS420 | 231 | 221 |
| 14. | SSR112 | 158 | 163 |
| 15. | TGS2910 | 158 | 173 |
| 16. | SSR310 | 150 | 158 |
| 17. | TES0312 | 208 | 200 |
| 18. | LEgata002 | 323 | 317 |
Table text extracted from the original PDF; superscript letters are shown inline. The original table image is below.
View original table image
Correlation Study of disease scoring with other Morphophysiological and biochemical traits
The knowledge of the associations between disease occurrence with morphological and biochemical traits will enable the researcher or breeders to decide suitable selection/breeding program criteria for genetic improvement in tomato against TLCV disease. The Correlation coefficients of different morphological and biochemical traits studied is mentioned in Table 3. The results revealed that characters like plant height, number of branches per plant, number of fruits per plant, phenol and total flavonoids shows significant negative correlation with disease scoring (-0.258, -0.322, -0.710, -0.780 and -0.220, respectively). The presence of phenolic compounds in plants and their synthesis in response to infection is associated with resistance and reported in many studies related to plant pathogen interaction. Thangam, (2004) [36] reported that the total phenol and ortho di hydroxy phenol in the leaves exhibited a significant negative association with disease incidence in all the environments studied signifying their role in disease resistance. Total phenol content in the leaves consistent factor of resistance against tomato leaf curl virus, suggest its negative correlation with TLCV incidence, While, total protein, reducing sugar and total sugar had a positive impact on whitefly flare-up on tomato (Mandali and Vijayalakshmi, 2020 and Pal et al., 2021) [23,27] .
| Sr. No. | Trait | Disease incidence (n=110) |
|---|---|---|
| 1 | Plant height | -0.258** |
| 2 | Number of branches per plant | -0.322** |
| 3 | Number of fruits per plant | -0.710** |
| 4 | Phenol | -0.780** |
| 5 | Moisture | 0.082 |
| 6 | Total soluble solids | -0.055 |
| 7 | Titrable acidity | -0.041 |
| 8 | Total soluble sugars | 0.016 |
| 9 | Flavonoids | -0.220* |
| 10 | Lycopene | -0.178 |
| 11 | Ascorbic acid | 0.077 |
Table text extracted from the original PDF; superscript letters are shown inline. The original table image is below.
View original table image
Test of Normality
Quantitative characters show discrete variation in the population. In order to know the frequency distribution of a segregating generation and their genetic interactions for a particular trait, skewness and kurtosis were estimated. Frequency distribution curve for Morphophysiological and biochemical traits F 2:3 Mapping population is presented in Figure 1 (a & [34] .
Leptokurtic distribution is shown by traits which are under control of few segregating genes and a platykurtic distribution is shown by traits that are in control of many genes and complementary gene action. A standard normal distribution has kurtosis of 3 and is referred as mesokurtic.
An increased kurtosis (> 3) can be visualized as a thin "Bell" with a high peak whereas a decreased kurtosis corresponds to a broadening of the peak and "Thickening" of the tails. Kurtosis > 3 is recognized as leptokurtic and < 3 as platykurtic. Kurtosis obtained by substitution of excess kurtosis by value of 3, zero indicates a perfect tailedness and positive values a leptokurtic distribution (Kallner, 2017) [19] . [18] . They have described positive skewness and platykurtic nature for phenol content while, plant height was negative skewed and platykurtic in nature.
Single Marker Analysis (SMA)
Single Marker Analysis was mainly performed for each marker locus without considering information from other loci. It also gives information on whether there is significant difference between the genotype classes and the marker locus. The single marker namely LEgata001 found significantly linked to plant height with phenotypic variation of 18.99%. Marker LEgata001 were significantly linked to number of branches per plant with phenotypic variation of 5.55%. Two markers i.e., TES0312 and SSR331 were significantly linked with number of fruits per plant with phenotypic variation of 8.91 and 6.95%, respectively. Three markers TES0312, SSR112 and SSR331were significantly linked with disease incidence score by phenotypic variation of 15.94, 11.25 and 11.79%, respectively with negative additive effects suggest the occurrence of TLCV disease is governed by the male parent GP-11, similar above three markers also significantly linked with phenol content with phenotypic variation of 17.67, 13.18 and 14.05%, respectively. The additive effect for phenol content is found positive indicates phenol content is mostly governed by the female parent ATL-97-26 which is resistant against the TLCV (Table. There are no any significant marker trait associations are found for the remaining traits i.e., total soluble solids, titrable acidity, total soluble sugars and lycopene might be due to lack of variability in these traits. Co-localizations of marker for phenol content and disease incidence with opposite additive effects explain negative correlation between the two traits. EST derived SSR112 was mapped on ninth linkage group of tomato at 80.0 cM position according to Tomato EXPEN 2000 genome (www.solgenomics.net). It is derived from gene, betafructosidase of tomato. Benhamou et al. (1991) [4] reported defensive role of beta fructosidase in tomato cell walls of tomato roots after infection of fungal wilt pathogen.
Conclusion
Tomato leaf curl virus (TLCV) is a very harmful viral disease of tomato crops in tropical and warm temperate countries of the world. Identification of DNA markers tightly linked to genes/quantitative trait loci (QTL) controlling TLCV resistance would assist enhanced pace and efficiency of breeding tomato for TLCV resistance.
Future Scope
The SSR markers viz., TES0312, SSR112 and SSR331 needs to be validated in other genetic backgrounds of Tomato. These markers will be useful for indirect selection of resistant tomato lines/genotypes in early segregating generations and marker assisted backcross breeding for TLCV resistance.
Acknowledgement
AcknowledgementI extend my sincere thanks to Dr. Y. M. Shukla (major advisor) and to my advisory committee members for giving me proper guidance throughout the course of study. I also sincerely thank The Government of Gujarat for supporting the research financially by awarding me SHODH (ScHeme of Developing High quality research) Fellowship.
Figures and tables from the paper
| Sr. No. | Traits | Skewness | Kurtosis |
|---|---|---|---|
| 1 | Plant height | 0.104 | -1.026 |
| 2 | Number of branches per plant | -0.111 | -0.982 |
| 3 | Number of fruits per plant | -0.107 | -0.812 |
| 4 | Disease incidence | 0.588 | -0.937 |
| 5 | Total phenol | 0.057 | -1.224 |
| 6 | Moisture | -0.283 | 0.086 |
| 7 | Total soluble solids | 0.681 | 1.993 |
| 8 | Titrable acidity | 0.249 | -0.977 |
| 9 | Total soluble sugars | -0.144 | -0.287 |
| 10 | Total flavonoids | 0.451 | 0.386 |
| 11 | Lycopene | -0.288 | -0.778 |
| 12 | Ascorbic acid | -0.311 | -0.678 |
Table text extracted from the original PDF; superscript letters are shown inline. The original table image is below.
View original table image
| Trait Name | Chromosome | Position | Marker Name | LOD | PVE (%) | Add. | Dom. |
|---|---|---|---|---|---|---|---|
| Plant height | 2 | 90.93 | LEgata001 | 5.02 | 18.99 | 7.47 | 3.26 |
| Number of fruits per plant | 1 | 104.92 | TES0312 | 4.10 | 8.91 | 4.38 | 2.69 |
| 1 | 119.57 | SSR331 | 3.14 | 6.95 | 4.23 | 1.92 | |
| Disease incidence (Score) | 1 | 104.92 | TES0312 | 12.05 | 15.94 | -1.07 | -0.74 |
| 1 | 113.97 | SSR112 | 7.83 | 11.25 | -0.91 | -0.62 | |
| 1 | 119.57 | SSR331 | 8.29 | 11.79 | -1.01 | -0.51 | |
| Total phenol content | 1 | 104.92 | TES0312 | 14.56 | 17.67 | 19.01 | 10.80 |
| 1 | 113.97 | SSR112 | 9.94 | 13.18 | 17.76 | 6.68 | |
| 1 | 119.57 | SSR331 | 10.77 | 14.05 | 19.13 | 6.40 |
Table text extracted from the original PDF; superscript letters are shown inline. The original table image is below.
View original table image
References
27 in the original paper- Al-Aysh F, Al-Serhan M, Al-Shareef A, Al-Nasser M, Kutma H. Study of genetic parameters and character interrelationship of yield and some yield components in tomato (Solanum lycopersicum L.). Int J Genet. 2012;2(2):29-33.
- Banerjee MK, Kalloo G. Inheritance of tomato (Lycopersicon Hirsutum F) leaf curls virus resistance. Glabratum. Euphytica. 1987;36:581-584.
- Benhamou N, Grenier J, Chrispeels MJ. Accumulation of β-fructosidase in the cell walls of tomato roots following infection by a fungal wilt pathogen. Plant Physiol. 1991;97(2):739-750.
- Bray HG, Thorpe WV. Methods Biochem Anal. 1954;1:27-52.
- Burton GW, Devane DE. Estimating heritability in tall fescue (Festuca arundinacea) from replicated clonal material. Agron J. 1953;45(10):478-481.
- Collard BCY, Jahufer MZZ, Brouwer JB, Pang ECK. An introduction to markers, quantitative trait loci (QTL) mapping and marker-assisted selection for crop improvement: The basic concepts. Euphytica. 2005;142:169-196.
- Costa C, Schurr U, Loreto F, Menesatti P, Carpentier S. Plant phenotyping research trends, a science mapping approach. Front Plant Sci. 2019;9:1933.
- Deshmukh SN, Basu MS, Reddy PS. Genetic variability, character association and path coefficients of quantitative traits in Virginia bunch varieties of groundnut. Indian J Agric Sci. 1986;56:515-518.
- Doyle JJ, Doyle JL. Isolation of plant DNA from fresh tissue. Focus. 1990;12:13-15.
- Dubois M, Gilles KA, Hamilton JK, Rebers PT, Smith F. Colorimetric method for determination of sugars and related substances. Anal Chem. 1956;28(3):350-356.
- FAOSTAT. Food Agriculture and Organization; c2021. [cited 2021 Jan 8]. Available from: https://www.fao.org/3/cb4477en/cb4477en.pdf
- Haydar A, Mandal MA, Ahmed MB, Hannan MM, Karim R, Razvy MA, et al. Studies on Genetic Variability and Interrelationship among the different traits in tomato (Lycopersicon esculentum Mill.). Middle-East J Scientometr Res. 2007;2(3-4):139-142.
- Islam MS, Mohanta HC, Ismail MR, Rafiq MY, Malek MA. Genetic variability and trait relationship in cherry tomato (Solanum lycopersicum L.) Var. Cerasiforme (Dunnal) A. Gray). Bangladesh J Botany. 2012;41(2):163-167.
- Johnson HW, Robinson HF, Comstock RE. Estimates of genetic and environmental variability in soybeans. Agron J. 1955;47(7):314-318.
- Kumar S, Hash CT, Nepolean T, Mahendrakar MD, Satyavathi CT, Singh G, et al. Mapping grain iron and zinc content quantitative trait loci in an iniadi-derived immortal population of pearl millet. Genes. 2018;9(5):248.
- Mala M, Vadivel E. Mean performance of tomato genotypes for leaf curl incidence. South Indian Horticulture. 1999;47(1-6):31-37.
- Mandali R, Vijayalakshmi K. Screening of tomato genotypes against tomato leaf curl virus and their morphological and biochemical categorization. J Entomol Zool Stud. 2020;8(5):866-871.
- Meng L, Li H, Zhang L, Wang J. QTL IciMapping: integrated software for genetic linkage map construction and quantitative trait locus mapping in biparental populations. Crop J. 2015;3(3):269-283.
- Nandapuri KS, Kanwar JS, Roshanlal B. Correlation, path analysis and regression studies in tomato. Vegetable Sci. 1976;3:37-40.
- NHB. National Horticulture Board, Ministry of Agriculture and Farmers Welfare, The Government of India; c2021. [cited 2021 Jan 8]. Available from: https://www.nhb.gov.in/pdf/Final202122.pdf
- Pal S, Karmakar P, Chattopadhyay A, Ghosh SK. Evaluation of tomato genotypes for resistance to whitefly (Bemisia tabaci Gennadius) and tomato leaf curl virus in eastern India. J Asia-Pacific Entomol. 2021;24(2):68-76.
- Patel R, Rukhsar, Parihar A, Patel D, Parmar DJ. Genetic analysis and trait association in F2 interspecific population in tomato (Solanum lycopersicum L.) using third-and fourth-degree statistics. Int J Curr Microbiol Appl Sci. 2018;7(12):2319-7706.
- Pico B, Ferriol M, Diez MJ, Nuez F. Developing tomato breeding lines resistant to tomato yellow leaf curl virus. Plant Breeding. 1999;118:537-542.
- Samadia DK, Aswani RC, Dhandar G. Genetic analysis for yield components in tomato land races. Haryana J Hort Sci. 2006;35(1-2):116-119.
- Singh RK, Rai N, Singh M, Singh SN, Srivastava K. Selection of tomato genotypes resistant to tomato leaf curl virus disease using biochemical and physiological markers. J Agric Sci. 2015;153(4):646-655.
- Snape JW, Riggs TS. Genetical consequences of single seed descent in the breeding of self-pollinated crops. Heredity. 1975;35:211-219.
- Suman C, Shabana K, Bharathi A, Hemant L, Min H, Yang MA, et al. Assessment of total phenolic and flavonoid content, antioxidant properties and yield of aeroponically and conventionally grown leafy vegetables and fruit crops. Evid Based Complement Alternat Med. 2014;8(3):812-821.