
Research article · 2024 · Full text
International Journal of Advanced Biochemistry ResearchAnalyzing cooperative societies vs. commission agents: A comparative study on marketing efficiency in Navsari district, Gujarat
Volume 8(1) · Pages 185–185 · DOI: 10.33545/26174693.2024.v8.i1sd.304 ↗
Research areasCooperative Studies and Economics
Abstract
Author-writtenThis study aim to analyze the role of Gadat Vibhag Vividh Karyakari Sahkari Khedut Mandali Ltd. co-operative societies and their services with respect to supply of agricultural inputs, finance, marketing of produce etc. by the mango, sapota and banana growers of Navsari district of Gujarat state. The aim of the study was to comparison of different horticultural produce marketing cost, margins and price spread in the operational area Gadat Vibhag Vividh Karyakari Sahkari Khedut Mandali Ltd. With their members and non-members. This study provides more insight on the impact and performance of the small scale cooperative. The present study was on “Performance and Profitability of Gadat Vibhag Vividh Karyakari Sahkari Khedut Mandali Ltd., Gadat of Navsari District, Gujarat”. The selected cooperative society is one of the oldest cooperative society existed since 1944.The selected cooperative society was operating in 9 villages and study covered all 9 villages, from each village 10 registered members and 10 non-members of the society were selected randomly. The primary data were collected from respondents pertains to the year 2019-2020. The market related data was collected from concerned markets as well as retailers and wholesalers. Secondary data were collected from the previous records of the society and its audit reports. In order to fulfill the stipulated objectives of the study, the major analytical tools employed were tabular analysis, marketing cost, marketing margins and price spread. The study investigated the marketing channels for bananas in the study area, identifying two predominant routes: Channel-I involving Co-operative Societies and Channel-II involving Commission agents cum Wholesalers. The analysis delved into the marketing costs incurred by different intermediaries in each channel, revealing distinct patterns. In Channel-I, the total marketing cost was ₹ 71.75 per quintal, with producers incurring 26.09%, co-operatives 33%, and retailers shouldering the majority at 40.97%. In Channel-II, the overall cost was higher at ₹ 294.54 per quintal, attributed to elevated spoilage charges and transportation costs. The study compared the marketing costs and revealed higher expenses in Channel-II. The subsequent examination of price spread unveiled that Channel-II experienced a higher spread of ₹ 579.48 per quintal compared to Channel-I's ₹ 481.20. Despite Channel-II's wider price spread, Channel-I was deemed more efficient due to its lower spread. This finding aligns with previous research, emphasizing the efficacy of co-operative channels in minimizing price spreads. The study underscores the importance of optimizing marketing channels for the benefit of both producers and consumers.
Summary
Source-checkedPlain-language reading of the full paper, prepared with AI and checked against the text. Each point links to the authors' own words.
Why it matters
- Agriculture is a cornerstone of the Indian economy, contributing approximately 14% of the GDP and employing about 42% of the population. View evidence ↗
- Agricultural cooperatives are promoted in India to encourage large-scale production and improve community equity and cooperation. View evidence ↗
- South Gujarat possesses agro-climatic conditions highly suitable for various fruit crops, including mango, sapota, banana, ber, and citrus. View evidence ↗
The question
- The study aimed to compare marketing costs, margins, and price spreads for horticultural produce between members and non-members of the Gadat Vibhag Vividh Karyakari Sahkari Khedut Mandali Ltd. cooperative. View evidence ↗
What they did
- The research sampled 10 registered members and 10 non-members randomly from each of the 9 villages where the cooperative society operates. View evidence ↗
- Primary data was collected from respondents for the 2019-2020 period, supplemented by market data from retailers and wholesalers, and secondary data from society records and audit reports. View evidence ↗
- The study utilized tabular analysis, marketing cost calculations, marketing margins, and price spread as its primary analytical tools. View evidence ↗
- Two banana marketing channels were identified: Channel-I (via Cooperative Societies) and Channel-II (via Commission agents cum Wholesalers). View evidence ↗
What they found
- The price spread was higher in Channel-II (₹ 579.48 per quintal) compared to Channel-I (₹ 481.20 per quintal). View evidence ↗
- Channel-I was determined to be more efficient than Channel-II because it maintained a lower price spread. View evidence ↗
- Producers using Channel-II received a lower net price of ₹ 833.33 per quintal, representing only 58.98% of the consumer's price (₹ 1412.81). View evidence ↗
What it means
- The authors conclude that optimizing marketing channels is essential to maximize benefits for both the producers and the consumers. View evidence ↗
Visual summary
2 visualsIllustrations explain the paper; charts are replotted from the paper's own table values.
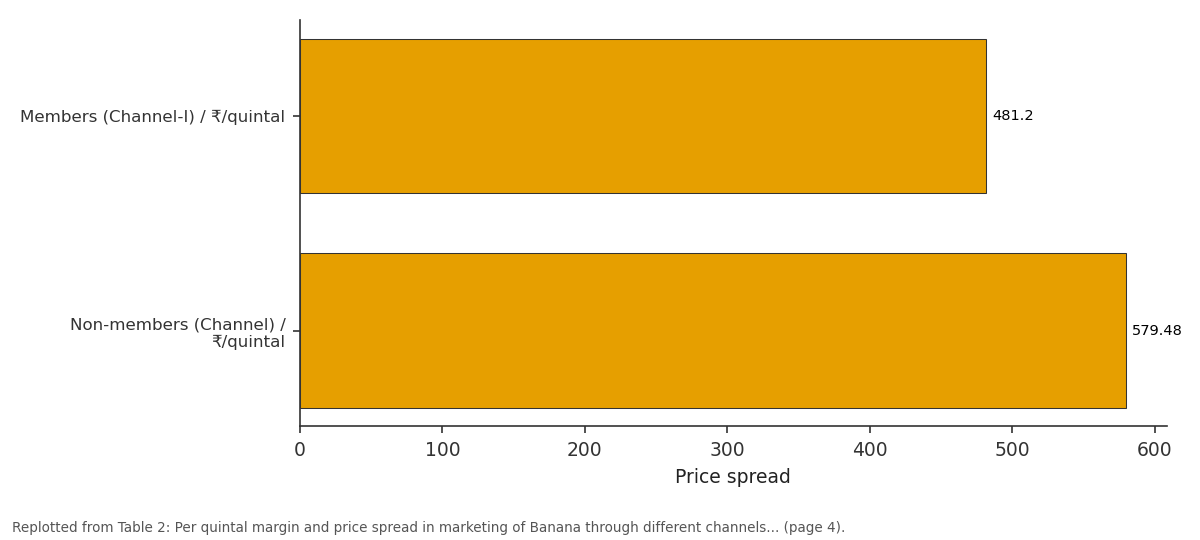
Price spread: Members (Channel-I) /... vs Non-members (Channel) /...
Replotted from Table 2 (page 4) of the original paper. Every bar is the paper's own table value.
View source evidence ↗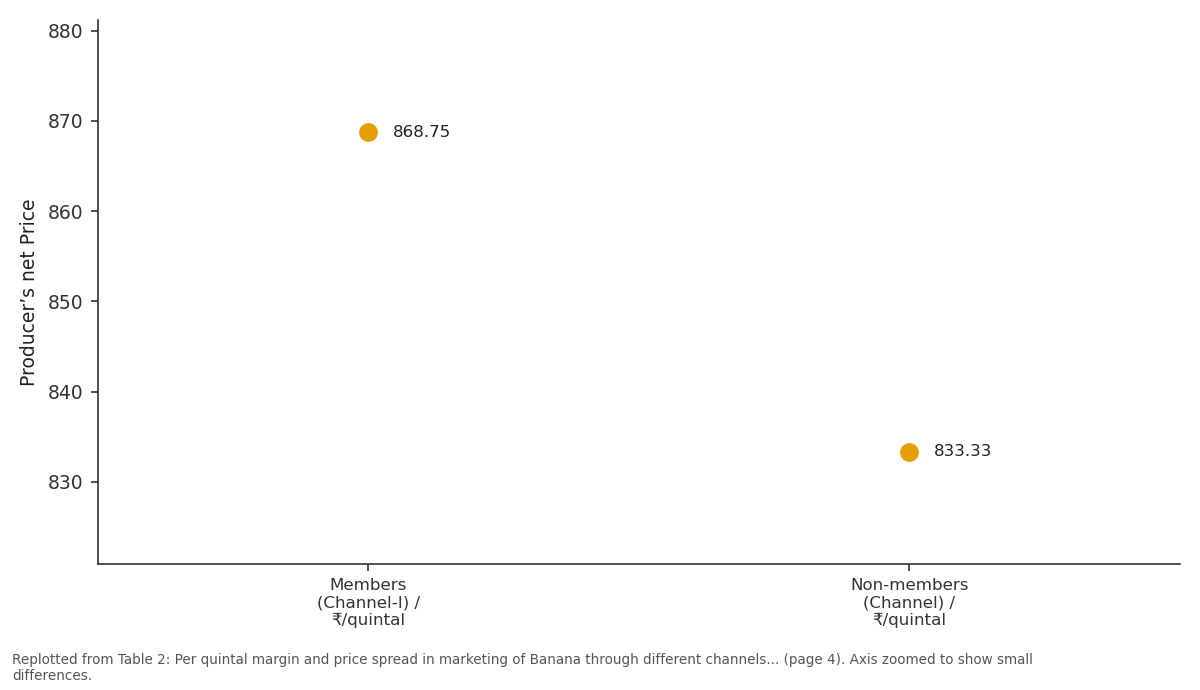
Producer’s net Price: Members (Channel-I) /... vs Non-members (Channel) /...
Replotted from Table 2 (page 4) of the original paper. Every bar is the paper's own table value.
View source evidence ↗Figures & tables
From the original paper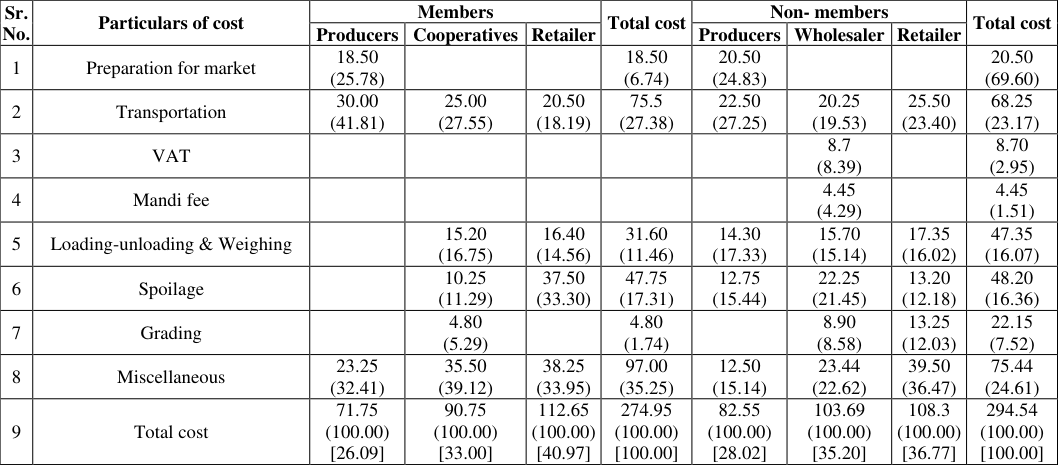 Table 1
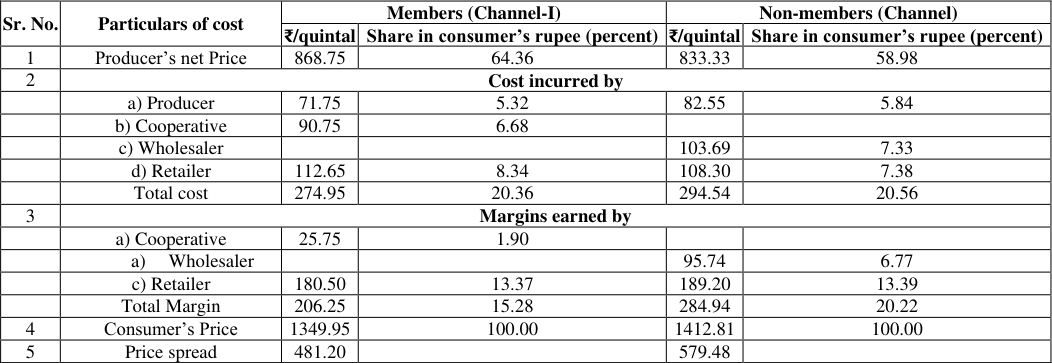 Table 2
Introduction
India is an agricultural country and laid the foundation of world's biggest co-operatives moment in the world. Co-operative is a way of life and it has an important means for weaker section of the society. Agriculture plays an important role in Indian economy. Agriculture and allied sector contribute about 14 percent of Indian GDP at current prices. It is worth to mention that the agriculture sector provides jobs to around 42 percent population of India. It is also noted that the GDP from Agriculture in India decreased to 4933.25 INR Billion in the second quarter of 2022 from 5688.80 INR Billion in the first quarter of 2022. (Source: Ministry of Statistics and Programme Implementation (MOSPI). Agricultural cooperatives have been promoted in India's economic development programme as a means of encouraging large scale production while enhancing community co-operation and equity.
The government of India, immediately after independence realizing the important role co-operatives can play in development of national economy, recognized co-operatives as third economic sector. They were charged with the responsibility for taking care the needs and aspirations of rural India with special emphasis on uplifting small and marginal farmers as well as weaker section of the society. Government of India is stressing upon and working tirelessly towards the vision of culture of agriculture with an aim to doubling farmers' income by 2022. Co-operatives have played an important role in achieving this aim as "Cooperatives have the potential to revitalize agriculture and make it sustainable."
This co-operative sector expanding all over in Gujarat with 81,468 working co-operative society out of them 30 from sugar sector, 4780 from irrigation sector, 907 from farming sector, 15,877 from milk sector and 9999 from primary agricultural co-operative sector. Out of all this co-operative societies, total 10,538 co-operative societies are present only in south Gujarat. Out of them 1125 primary agriculture credit society, 3077 milk co-operatives, 1080 irrigation cooperatives, 499 marketing co-operatives, 54 processing and 21 sugar co-operatives. While in Navsari there are about 779 co-operative societies.
In some areas and in some sectors, the co-operative societies are serving the masses and playing a vital role in the development of small and marginal farmers and their income while in some areas their performances are not up to the mark. There are networks of co-operatives exist at local, regional, state and national levels, which have an expansion in the field mostly related to dairy (AMUL, Mother dairy), fertilizers (KRIBHCO, IFFCO), sugar co-operatives and agriculture co-operatives. A large number of studies had been attempt but most of them focus on large scale cooperatives. In this context, South Gujarat region is especially recognized for successful sugar and agriculture co-operatives. Apparently, this study provides more insight on the impact and performance of the small scale cooperative. To attempt this study we selected "Gadat Vibhag Vividh Karyakari Sahakari Khedut Mandali Ltd., Gadat of Navsari district, Gujarat". This society was established in 1944 by the Freedom Fighters of the surrounding area. Its main office is at Gadat. This society has above 3000 registered members with the trademark of GKM. In November, 2019 this co-operative society successfully completes 75 years and celebrated "Amrutmahotsava". This society is ISO 9001-2015 certified and marketed their product as brand name "GKM" in big cities like Ahemdabad and Surat for mango, Delhi, UP, Himachal for sapota. Main activities include collection of Mango, Chiku, Banana, Elephant yam and Paddy on pooling basis and giving reasonable price to its members. It has seven branches in overall operational villages. This society has morden technology for fast processing as well as value addition like grading machine, cold storage, ripening chamber and hot water treatment plant etc. The average collection of mango is around 1224.38 MT and that of chiku is 4435.72 MT in year 2018-2019 (Anonymous, 2019). Agricultural marketing concerned with two aspects that is the marketing of farm produces and marketing of farm inputs that are consumed by the farms to produce agricultural produces. India is the second largest producer of fruits in the world. India's horticulture sector is growing and playing a vital role in the continent's agricultural economy.
The suitable agro-climatic condition has enormous potential for wide variety of fruits crops grown in south Gujarat. The major fruit crops grown in Gujarat are Mango, sapota, ber, banana and citrus etc. This fruit crops has highest area and productivity in South Gujarat. In south Gujarat banana has covered 544 ha area and 5574 MT production and 10.24 MT/ha productivity.
Materials and Methods
This study is based on Navsari district of south Gujarat region. For this study purpose we selected one of the oldest cooperative society in study area. The selected co-operative society is one of the oldest co-operative society existed since 1944. The selected co-operative society was operating in 9 villages. The study covered all 9 villages, from each village 10 registered members. The primary data were collected from respondents pertains to the year 2019-2020. The market related data was collected from concerned markets as well as retailers and wholesalers. Secondary data were collected from the previous records of the society and its audit reports. In order to fulfill the stipulated objectives of the study, the major analytical tools employed were tabular analysis, Marketing cost, margins and price spread.
Where, X ̅ = Arithmetic mean, Xi = Value of the i th individual measurement, n = Number of the x i value in the sample.
Marketing cost
The marketing cost incurred by farmers will be computed by using following formula:
Where, MC i = Average marketing cost of crop (₹/qtl) CG i = Average cost of grading of i th crop (₹/qtl) CP i = Average cost of packing of i th crop (₹/qtl) CT i = Average cost of transporting of i th crop (₹/qtl) CC i = Average amount of commission paid for i th crop (₹/qtl) CM i = Average miscellaneous cost of i th crop (₹/qtl)
Market margin
Market margin
Results and Discussion
The selected co-operative society functioning different activities in its operational area. Out of all them, it ensured marketing of the member's crops like mango, sapota, banana, elephant foot yam, rice by pooling method. So, here we could calculate the impact of the cooperative society by comparing the different channels adopted by the members and non-members in the society's operational area. In this section of result and discussion we work out the marketing channels, marketing cost margins and price spread of mango, sapota and banana respectively.
Marketing channels for Banana in study area
The marketing channels found in the study area for members and non-members are as followes. I. Producer -Co-operative Societies -Wholesaler -Retailer -Consumer II. Producer -Commission agent cum wholesaler -Retailer -Consumer
Marketing cost incurred by different intermediaries
The marketing cost incurred by producers, cooperatives, wholesalers and retailers for banana is presented in Table 1. The data encircled in the table revealed that the total cost in marketing of banana in channel-I was found to ₹ 71.75 per quintal (26.09%) were incurred by the producer, followed by the retailers ₹ 112.65 per quintal (40.97%), cooperatives ₹ 90.75 per quintal (33%). It clearly showed that the retailers incurred the major share of total marketing cost in channel-I. The component-wise breakup of marketing costs indicated that the cost on transportation, spoilage, loadingunloading and weighing charges were the major items as these together accounted for more than 56 percent of the total marketing cost. In channel-II, the total cost incurred by the producer was ₹ 82.55 per quintal (28.02%) on different items of marketing cost. The cost of harvesting and transportation were the major cost items in marketing cost of banana. The total cost incurred by the wholesaler was ₹ 103.69 per quintal (35.20%). Among different cost items, transportation and spoilage charge were the major cost items. The total marketing cost incurred by the retailer was to ₹ 108.30 per quintal (36.77%). The marketing cost incurred by the retailer was higher and it was due to high transportation and miscellaneous charges. A comparison of marketing cost of banana in different marketing channels revealed that marketing costs were found the highest in channel-II (294.54 ₹/ quintal) followed by channel-I. The reasons for this were the higher spoilage charges and transportation costs. The results obtained are in conformity with the results of Dakshinamoorthy et al. (2007) [2] studied on marketing losses and their impact on marketing margins.
Price spread in marketing of banana
Price spread indicates the difference between price paid by the ultimate consumers and the price received by the growers for an equivalent quantity of produce in the retail market. The price spread includes cost of performing various marketing functions and margins of different agencies associated in the marketing process of the commodity. The extent of price spread helps the policy makers in devising suitable policies for increasing marketing efficiency by either reducing the marketing costs or eliminating unwanted middlemen from the marketing chain or by both. The marketing cost, margins and price spread in marketing of banana through major channels are presented in Table 2 based on the data collected from the growers and market functionaries. From the Table 2, it could be seen that the producers got a net price of ₹ 868.95 per quintal (64.36%) of the price paid (₹ 1349.70 /quintal) by the consumers in sale of banana through channel-I. The total marketing cost incurred by middlemen, including the producer, was ₹ 274.95 per quintal (20.36%) of consumer's rupee. The intermediaries earned a total margin of ₹ 206.25 quintal (15.28%) of the price paid by the consumers in sale of banana. The agencywise breakup of the gross margin revealed that the cooperatives and retailers got 1.90 percent and 13.37 percent of the consumer's price respectively. The price spread was ₹ 481.20 per quintal. In channel-II, banana growers got a net price of ₹ 833.33 per quintal (58.98%) of the price paid (₹ 1412.81 /quintal) by the consumers. The total marketing cost incurred by middlemen, including the producer was ₹ 290.54 per quintal (20.56%) of consumer's rupee. The intermediaries earned a total margin of ₹ 285.68 quintal (20.22%) of the price paid by the consumers in sale of banana. Among various middlemen, in channel-II the retailer margin was higher by 13.39 percent than the wholesaler's margin. The price spread was ₹ 579.48 quintal.
| Sr. No. | Particulars of cost | Members (Channel-I) | — | Non-members (Channel) | — |
|---|---|---|---|---|---|
| ₹/quintal | Share in consumer’s rupee (percent) | ₹/quintal | Share in consumer’s rupee (percent) | ||
| 1 | Producer’s net Price | 868.75 | 64.36 | 833.33 | 58.98 |
| 2 | Cost incurred by | ||||
| a) Producer | 71.75 | 5.32 | 82.55 | 5.84 | |
| b) Cooperative | 90.75 | 6.68 | |||
| c) Wholesaler | 103.69 | 7.33 | |||
| d) Retailer | 112.65 | 8.34 | 108.30 | 7.38 | |
| Total cost | 274.95 | 20.36 | 294.54 | 20.56 | |
| 3 | Margins earned by | ||||
| a) Cooperative | 25.75 | 1.90 | |||
| a) Wholesaler | 95.74 | 6.77 | |||
| c) Retailer | 180.50 | 13.37 | 189.20 | 13.39 | |
| Total Margin | 206.25 | 15.28 | 284.94 | 20.22 | |
| 4 | Consumer’s Price | 1349.95 | 100.00 | 1412.81 | 100.00 |
| 5 | Price spread | 481.20 | 579.48 |
Table text extracted from the original PDF; superscript letters are shown inline. The original table image is below.
View original table image
The price spread was found the highest in channel-II ₹ 579.48 quintal followed by channel-I (₹ 481.20 /quintal). Thus, channel-I was found more efficient as compare to other channel. On this account, the marketing of banana through co-operative channel was more efficient since the price-spread was lower. Results obtained are in accordance with the results obtained by Dakshinamoorthy et al. (2007) [3] .
Conclusion
The study investigated the marketing channels for bananas in the study area, identifying two predominant routes: Channel-I involving Co-operative Societies and Channel-II involving Commission agents cum Wholesalers. The analysis delved into the marketing costs incurred by different intermediaries in each channel, revealing distinct patterns. In Channel-I, the total marketing cost was ₹ 71.75 per quintal, with producers incurring 26.09%, co-operatives 33%, and retailers shouldering the majority at 40.97%. In Channel-II, the overall cost was higher at ₹ 294.54 per quintal, attributed to elevated spoilage charges and transportation costs. The study compared the marketing costs and revealed higher expenses in Channel-II. The subsequent examination of price spread unveiled that Channel-II experienced a higher spread of ₹ 579.48 per quintal compared to Channel-I's ₹ 481.20. Despite Channel-II's wider price spread, Channel-I was deemed more efficient due to its lower spread. This finding aligns with previous research, emphasizing the efficacy of co-operative channels in minimizing price spreads. The study underscores the importance of optimizing marketing channels for the benefit of both producers and consumers.
References
4 in the original paper- Dakshinamoorthy V, Mysore S. Marketing Losses and Their Impact on Marketing Margins: A Case Study of Banana in Karnataka. Agriculture Economic Research Review. 2007;20(1):47-60.
- Dakshinamoorthy V, Sreenivasa Murthy D, Gajanana TM, Sudha M. Marketing Losses and Their Impact on Marketing Margins: A Case Study of Banana in Karnataka. Agriculture Economic Research Review. 2007;1(1):47-60.
- Kumaresh K, Sekar C. Price spread, marketing efficiency and constraints in supply chain of mango in Krishnagiri district of Tamil Nadu. Agriculture Update. 2013;8(3):446-451.
- Naveen B, Jayaram MS, Swamy PSD, Ramesh GB, Raghavendra DV. Marketing channels and price spread of banana in Chikkaballapur district of Karnataka. International Research Journal of Agricultural Economics and Statistics. 2015;6(1):18-22.