
Research article · 2024 · Full text
International Journal of Agriculture Extension and Social DevelopmentCauses of migration pattern among different gradients of Tiruchirapalli District
Volume 7(1) · Pages 201–203 · DOI: 10.33545/26180723.2024.v7.i1c.210 ↗
Research areasMigration and Labor DynamicsUrban and Rural Development Challenges
Abstract
Author-writtenMigration is the process in which, a member of household moves for work or employment and retains contact with the household at origin. To understand the causes of migration and effectively manage it, the effects of the push and pull elements must be investigated. With this background, the study has been carried out to determine the factors of migration in the different gradients of the study area. A multistage stratified random sampling technique was adopted in this study. The factor analysis has been used in the study andthe results revealed that the KMO and Bartlett’s test was significant (0.611) and the analysis extracted seven factors. The push factors were more responsible for the migration than the pull factors. Among the various push and pull factors, lower wages at origin and large family size were the highly influential factors for the migration.
Summary
Source-checkedPlain-language reading of the full paper, prepared with AI and checked against the text. Each point links to the authors' own words.
Why it matters
- Migration involves the movement of people between geographical locations on either a temporary or permanent basis. View evidence ↗
- Migration is motivated by 'push factors' that encourage people to leave their origin and 'pull factors' that draw them to new locations. View evidence ↗
- Studying the impact of push and pull factors is necessary to understand the reasons for migration and to manage it effectively. View evidence ↗
The question
- The study aimed to determine the factors influencing migration across different gradients of the study area. View evidence ↗
What they did
- The researchers used a multistage stratified random sampling technique to select participants. View evidence ↗
- The study area, Tiruchirapalli district, was divided into three gradients: Rural, Peri-urban, and Urban. View evidence ↗
- The total sample included 42 migrants from Rural, 55 from Peri-urban, and 63 from Urban gradients. View evidence ↗
- The primary data collected from the respondents pertained to the 2020-2021 period. View evidence ↗
- Factor analysis was employed as the primary tool to identify the causes of migration. View evidence ↗
What they found
- The KMO measure of 0.611 and a significant Bartlett's test (0.000) confirmed that factor analysis was an appropriate technique for the data. View evidence ↗
- The analysis identified seven distinct factors that collectively explained 55.17% of the total variance in migration causes. View evidence ↗
- Economic push factors were the primary driver, accounting for 5.40% of the total variance. View evidence ↗
- Lower wages at the place of origin were identified as one of the most influential factors for migration, with a factor loading of 0.843. View evidence ↗
- Large family size was also a highly influential factor, showing a factor loading of 0.803. View evidence ↗
- The study found that push factors played a more significant role in driving migration than pull factors. View evidence ↗
What it means
- The authors recommend regularly increasing agricultural wage rates to reduce the gap between rural and urban wages and thereby mitigate migration. View evidence ↗
Visual summary
3 visualsIllustrations explain the paper; charts are replotted from the paper's own table values.

Push vs Pull Dynamics
AI-generated conceptual illustration (Rural village and urban city in Tamil Nadu, India). It explains the idea and does not show study data.
View source evidence ↗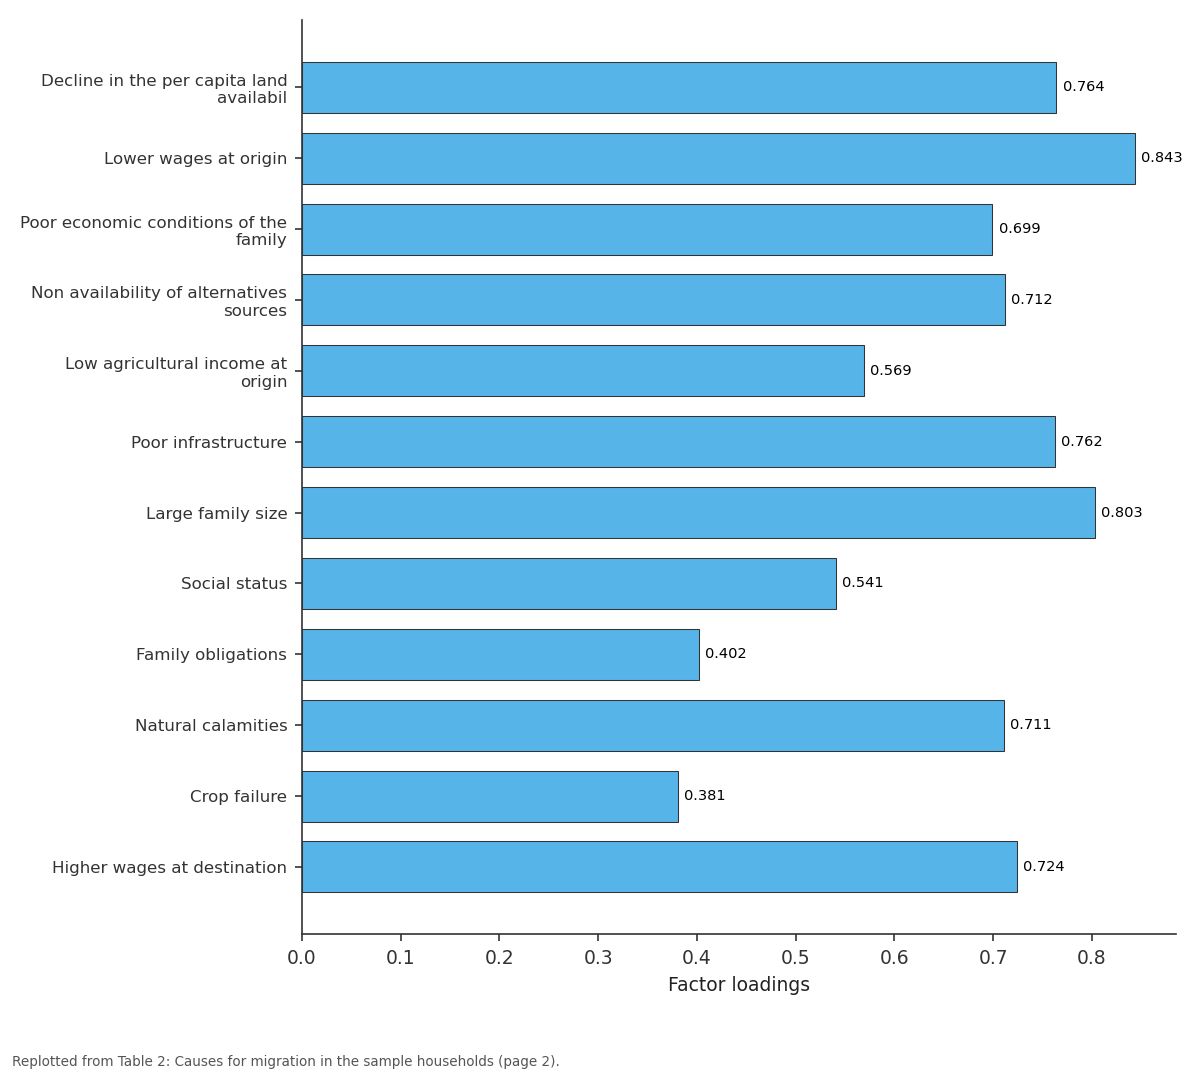
Factor loadings: Decline in the per... vs Lower wages at origin vs Poor economic... vs Non availability of... vs Low agricultural income...
Replotted from Table 2 (page 2) of the original paper. Every bar is the paper's own table value.
View source evidence ↗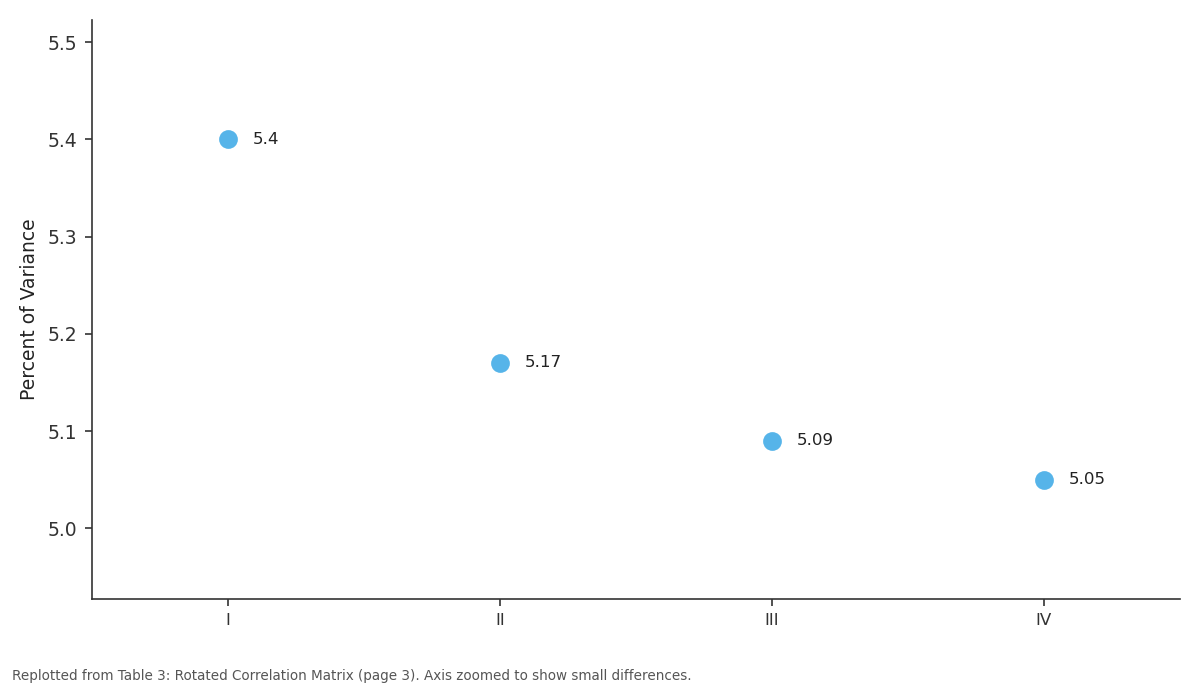
Percent of Variance: I vs II vs III vs IV
Replotted from Table 3 (page 3) of the original paper. Every bar is the paper's own table value.
View source evidence ↗Figures & tables
From the original paper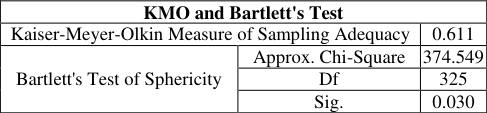 Table 1
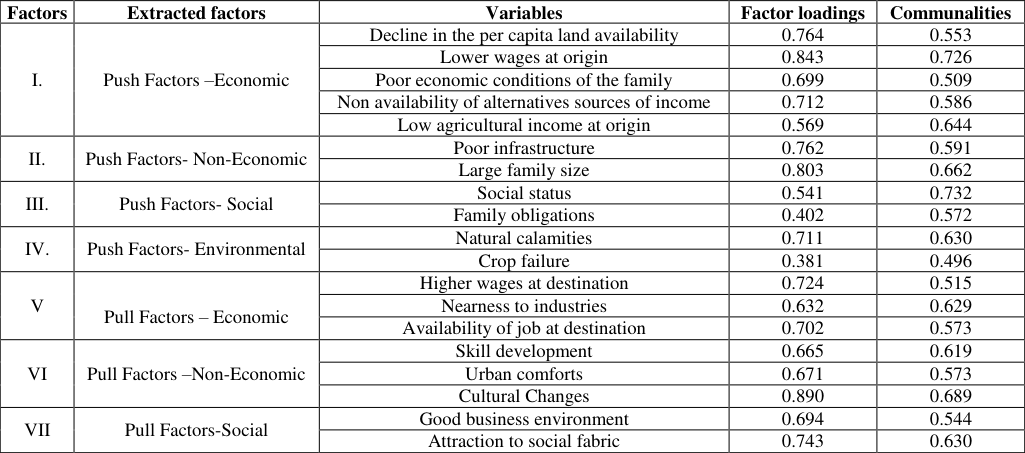 Table 2
 Table 3
Introduction
Migration is defined as a movement of people from one geographical location to another, either on a temporary or permanent basis (Ekong 2003) [3] . According to Census of India (2011) [2] , Migration classifiedas a person a migrant if either (a) 'his/her place of birth was different from the place of enumeration' or (b) 'his/her place of last continuous residence was different from the place of enumeration'. In this study, migration has been defined as the process, in which, a member of household moves for work or employment and retains contact with the household at origin. The 'Push Factors' and 'Pull Factors' were the basic economic factors which motivate migration. Migration to new places is drawn by pull forces, whilst push factors encourage people to leave their places of origin and settle elsewhere. Significant changes have occurred in the land use, agriculture, and employment patterns of rural areas due to large-scale migrations from rural to urban areas. Furthermore, in situations when "push" and "pull" forces are present at the same time, wage discrimination and differences in socioeconomic circumstances also spur migration. The impact of the push and pull factors have to be studied to understand the reasons of migration and to manage the migration properly. With this background, this study has been carried out to empirically determine the causes and key correlates of migration in the different gradients of the study area.
Design of the Study 2.1 Methodology:
A multistage stratified random sampling technique was adopted in this study. The nine taluks of Tiruchirapalli district have been classified as three gradients namely, Rural, Peri-urban and Urban, based on the proportion of urban population in the respective taluks (Census 2011) [2] and also by referring geographical map of Tiruchirapalli district. One taluk has been randomly selected from each of the gradients, six villages have been randomly selected from each of the selected gradients and migrant respondents have been randomly selected from each of these villages. The sample migrant population in the different gradients consisted of 42 in the Rural, 55 in the Peri-urban and 63 in the Urban Gradients. The primary data has been collected from the sample respondents of Rural, Peri-urban and Urban gradients using structured interview schedule. The data collected from the respondents pertained to the year 2020-2021.
Tools of Analysis
Factor Analysis: Factor Analysis was used to identify the causes for migration of the sample respondents. The main goal of factor analysis is to find a method to reduce the amount of information lost while creating a smaller collection of new, composite dimensions (factors) from a variety of original variables. www.extensionjournal.com One can test the data's eligibility for factor analysis using the following criterion: (i) The presence of enough correlations to support factor analysis can be determined visually by examining the correlation data matrix. (ii) The anti-image correlation matrix displays the partial correlation between the variables' negative values. These numbers have to be tiny for genuine factors to be present in the data. (iii) The Kaiser-Meyer-Olkin measure of sampling adequacy (KMO) is an additional metric used to assess the suitability of factor analysis and the degree of intercorrelation between the variables. The index ranges from 0 to 1 and small values of KMO measure indicate that a factor analysis of variables may not be a good idea, since correlation between pairs of variables cannot be explained by the other variables. A high value between 0.5 and 1.0 indicates that factor analysis is appropriate technique to be used. To obtain factor solutions two basic models, viz., common factor and principal component analysis are to be used. Common Factor Analysis is used to identify underlying factors or dimensions of causes of migration. It is a statistical method that converts an initial set of variables into a significantly smaller set of uncorrelated variables, which together contain the majority of the original set of variables' information, by a linear transformation. The linear combinations of variables are used to account for variation of each dimension in a multivariate space. The variance of factors is called Eigen Values, Characteristic Roots or Latent Root. Communality is the amount of variance, an original variable shares with others. Factor loadings are the correlation between the original variable and the factor. Squared factor loadings indicate the percentage of the variance in an original variable explained by a factor. For rotation, Orthogonal or Oblique method can be applied. In orthogonal rotation method, the axes are maintained at 90 degree, so that the resulting factors are uncorrelated. Within orthogonal method, either Varimax or Quatrimax method can be employed. Varimax method simplifies the columns in a matrix, whereas Quatrimax method stresses on simplifying the rows. In this study, Varimax method of rotation was used in order to have more clarity in factor solution. The Varimax criteria maximizes the sum of the variance of the square loadings within each column of the loading matrix.
Results and Discussion
The migration exodus is attributed to a number of push and pull factors and hence migration itself is the outcome of the relative strength of these factors. Factor analysis has been attempted in this study and varimax rotation was calculated to extract the most influencing push and pull factors of migration. The results of KMO measures of sampling adequacy and the Bartlett's test of sphericity, which determines the factorability of the correlation matrix of the causes for migration is presented in Table 1. The factor loadings represent the correlation between an original variable and its factor. Positive sign of factor loadings indicated that the variables were positively correlated with its factor. The factors and the loadings were categorized, viz., Push Factors-Economic, Push Factors-Non-Economic, Push Factors-Social, Push Factors-Environmental, Pull Factors-Economic, Pull Factors-Non-Economic, Pull Factors-Social. Factor I: The Push Factors-Economic was the main factor, which accounted for 5.40 per cent of variance in the total variable set, in which five variables, viz., decline in the per capita land availability, lower wages at origin, poor economic conditions of the family, non-availability of alternative sources of income and low agricultural income at origin were positively loaded with an Eigen value of 1.40.
| KMO and Bartlett's Test | — | — |
|---|---|---|
| Kaiser-Meyer-Olkin Measure of Sampling Adequacy | 0.611 | |
| Bartlett's Test of Sphericity | Approx. Chi-Square | 374.549 |
| Df | 325 | |
| Sig. | 0.030 |
Table text extracted from the original PDF; superscript letters are shown inline. The original table image is below.
View original table image
Factor II: The Push Factors-Non-Economic was accounted for 5.17 per cent in the total variable set, in which two variables set namely, poor infrastructure and large family size have been loaded with the Eigen values of 1.35 per cent.
Factor III: The Push Factors-Social accounted for 5.09 per cent of variance in the total variable set, with an Eigen value of 1.32. The two variables namely social status and family obligations were loaded in this factor. Factor IV: The Push Factors-Environmental accounted for 5.05 per cent of variance in the total variable set of natural calamities and crop failure, which had an Eigen value of 1.31. Factor V: The Pull Factors-Economic accounted for 4.91 per cent of variance in the total variable set, with three variables, namely, higher wages at destination, nearness to industries, availability of job at destination were loaded and obtained an Eigen value of 1.29. Factor VI: The Pull Factors-Non-Economic, viz., skill development, urban comforts and fulfilment of selfaspirations represented 4.56 per cent of variance in the total variable set with an Eigen value of 1.27. Factor VII: The Pull Factors-Social accounted for 4.55 per cent of variance and loaded with two set of variables i.e., good business environment and attraction to urban social fabric which had an Eigen value of 1.18. It is concluded that the push factors were more responsible for the migration than the pull factors. Among the various push and pull factors, lower wages at origin and large family size were the highly influential factors for the migration. The results are in accordance with Regmi (2014) [7] .
Conclusion
Factor analysis has been attempted in this study and varimax rotation was calculated to extract the most influencing push and pull factors of migration and concluded that the push factors were more responsible for the migration than the pull factors. The factor analysis extracted seven factors which together accounted for 55.17 per cent of total variance. The factors and the loadings were categorized, viz., Push Factors-Economic, Push Factors-Non-Economic, Push Factors-Social, Push Factors-Environmental, Pull Factors-Economic, Pull Factors-Non-Economic, Pull Factors-Social. Among the various push and pull factors, lower wages at origin and large family size were the highly influential factors for the migration. Hence, it is suggested that, the agricultural wage rates may be increased appropriately on regular basis to reduce the wage difference between rural and urban activities.
Acknowledgment
I would like to acknowledge that the research has done with the guidance of ICSSR Doctoral Fellowship.
Figures and tables from the paper
| Factors | Extracted factors | Variables | Factor loadings | Communalities |
|---|---|---|---|---|
| I. | Push Factors –Economic | Decline in the per capita land availability | 0.764 | 0.553 |
| Lower wages at origin | 0.843 | 0.726 | ||
| Poor economic conditions of the family | 0.699 | 0.509 | ||
| Non availability of alternatives sources of income | 0.712 | 0.586 | ||
| Low agricultural income at origin | 0.569 | 0.644 | ||
| II. | Push Factors- Non-Economic | Poor infrastructure | 0.762 | 0.591 |
| Large family size | 0.803 | 0.662 | ||
| III. | Push Factors- Social | Social status | 0.541 | 0.732 |
| Family obligations | 0.402 | 0.572 | ||
| IV. | Push Factors- Environmental | Natural calamities | 0.711 | 0.630 |
| Crop failure | 0.381 | 0.496 | ||
| V | Pull Factors – Economic | Higher wages at destination | 0.724 | 0.515 |
| Nearness to industries | 0.632 | 0.629 | ||
| Availability of job at destination | 0.702 | 0.573 | ||
| VI | Pull Factors –Non-Economic | Skill development | 0.665 | 0.619 |
| Urban comforts | 0.671 | 0.573 | ||
| Cultural Changes | 0.890 | 0.689 | ||
| VII | Pull Factors-Social | Good business environment | 0.694 | 0.544 |
| Attraction to social fabric | 0.743 | 0.630 |
Table text extracted from the original PDF; superscript letters are shown inline. The original table image is below.
View original table image
| Factors | I | II | III | IV | V | VI | VII |
|---|---|---|---|---|---|---|---|
| Eigen Values | 1.40 | 1.35 | 1.32 | 1.31 | 1.29 | 1.27 | 1.18 |
| Percent of Variance | 5.40 | 5.17 | 5.09 | 5.05 | 4.91 | 4.56 | 4.55 |
| Cumulative Percent of Variance | 5.41 | 10.58 | 20.85 | 36.04 | 41.01 | 45.92 | 55.17 |
Table text extracted from the original PDF; superscript letters are shown inline. The original table image is below.
View original table image
References
6 in the original paper- Maruf AA, Pervez AKMK, Sarker PK, Rahman MS, Ruiz-Menjivar J. Exploring the Factors of Farmers Rural-Urban Migration Decisions in Bangladesh. Agriculture. 2022;12(5):722.
- Gayathri E, Sita Devi K, Prabakar C, Ponnarasi T. Key Correlates of Migration on Rural Households: A Socioeconomic Analysis in Pudukkottai District of Tamil Nadu. Res J Agric Sci. 2020;11(1):203-208.
- Malhotra N, Devi P. Analysis of Factors Affecting Internal Migration in India. Amity J Econ. 2016;1(2):34-51.
- Raj S, Naik AD, Patil VK, Kavya VH. Regional Migration of Agriculture Labour to Other Sectors in Bidar District of Karnataka: A Factorial Analysis using Garrett's Scale. Int. J Comput Bus Manage. 2016;9(1):53-57.
- Regmi LK. An overview of population growth trends of Nepal. J Inst Sci Technol. 2014;19(1):57-61.
- Sanyal T, Maity K. On Labour Migration in India: Trends, Causes and Impacts. Econ Aff. 2018;63(1):5769.
Cited by 1
From OpenAlex, OpenCitations and reference lists read by Scinovex
- Studium przypadku działania kampanii społecznych na redukcję uprzedzeń rasistowskich w dobie politycznej instrumentalizacji lęku i wykorzystywania negatywnych emocji migracyjnych ↗
Katarzyna Majewska · Uniwersyteckie Czasopismo Socjologiczne · 2025
Artykuł analizuje wpływ kampanii społecznych na nastroje społeczne dotyczące rasizmu, szczególnie w kontekście rosnącej niechęci do uchodźców. Autorka wskazuje, że negatywne postawy wobec migrantów wynikają zarówno z czynników ekonomicznych, jak i ksenofobii wzmacnianej przez narracje medialne i polityczne. Kampanie społeczne, poprzez odpowiednio dobrane strategie komunikacyjne, mogą przeciwdziałać tym zjawiskom, choć ich skuteczność bywa ograniczona przez polaryzację społeczną i krótkotrwałość efektu.…
❝ 0PDF