
Research article · 2023 · Full text
International Journal of Statistics and Applied MathematicsEffect of different levels of phosphorus and sulphur on growth and yield of cowpea (Vigna sinensis) Cv. Pusa Phalguni
Volume 8(6S) · Pages 1289–1291 · DOI: 10.22271/maths.2023.v8.i6sq.1553 ↗
Research areasAgricultural Science and FertilizationAgronomic Practices and Intercropping SystemsAgricultural pest management studies
Abstract
Author-writtenThe experiment “Effect of different levels of phosphorous and sulphur on growth and yield of Cow pea (Vigna sinensis) Pusa Phalguni was conducted at the instruction a cum Research farm Department of Horticulture, Collage of Agriculture during kharif season 2012-2013. The experiment was laid out in factorial Randomized Design with three levels each of phosphorus and sulphur consisting nine treatment combination replicated thrice. The treatment comprising of levels of phosphorus viz. P1:40 kg P2O5/ ha,P2:50 kg P2O5/ha,P3:60 kg P2O5/ha and three levels of sulphur viz. S0:0 kg S / ha,S1: 20 kg S/ha,S2:40 kg S/ha and P1:60 kg P2O5/ha produced better growth number of branches, (13.56), number of functional leaves (17.10) Leaf area (17.55 dm2) and yield green pod (5o.51q) per hacter of cow pea under study.
Summary
Source-checkedPlain-language reading of the full paper, prepared with AI and checked against the text. Each point links to the authors' own words.
Why it matters
- Cowpea is a commercially grown crop in India, utilized as a vegetable for its green pods, as a pulse for its seeds, and for foliage and fodder. View evidence ↗
- Nitrogen and phosphorus are critical nutrients for cowpea as they are essential components of phospholipids and proteins, with phosphorus specifically aiding root growth and early maturity. View evidence ↗
- Due to its high protein content in both seeds and straw, cowpea requires more sulphur than other legume crops. View evidence ↗
The question
- The study aimed to evaluate how different levels of phosphorus and sulphur affect the growth and yield of the cowpea cultivar Pusa Phalguni. View evidence ↗
What they did
- The research used a factorial randomized design with nine treatment combinations, each replicated three times, testing three levels of phosphorus and three levels of sulphur. View evidence ↗
- Phosphorus levels were set at 40, 50, and 60 kg P2O5/ha, while sulphur levels were 0, 20, and 40 kg S/ha. View evidence ↗
- Nitrogen and potassium were applied at 50 kg/ha each; phosphorus was supplied via DAP, and sulphur was supplied via Gypsum. View evidence ↗
- Observations were recorded at 15-day intervals throughout the experiment. View evidence ↗
What they found
- The maximum plant height of 43.60 cm was achieved with the application of 40 kg S/ha. View evidence ↗
- The highest number of branches (13.50) was recorded when phosphorus was applied at 60 kg/ha. View evidence ↗
- At 60 days after sowing (DAS), applying 60 kg P2O5/ha resulted in the significantly highest number of functional leaves at 17.30 per plant. View evidence ↗
- The application of 40 kg S/ha led to the significantly highest leaf area of 21.55 dm² per plant. View evidence ↗
- The highest green pod yield, measuring 6.38 kg per plot and 50.61 q per hectare, was produced using 60 kg P2O5/ha. View evidence ↗
- Applying 40 kg S/ha produced a higher green pod yield of 6.5 kg per plot and 52.51 q per hectare compared to no sulphur application. View evidence ↗
What it means
- The authors conclude that 60 kg P2O5/ha produced better growth in terms of branches, functional leaves, leaf area, and green pod yield. View evidence ↗
Visual summary
3 visualsIllustrations explain the paper; charts are replotted from the paper's own table values.
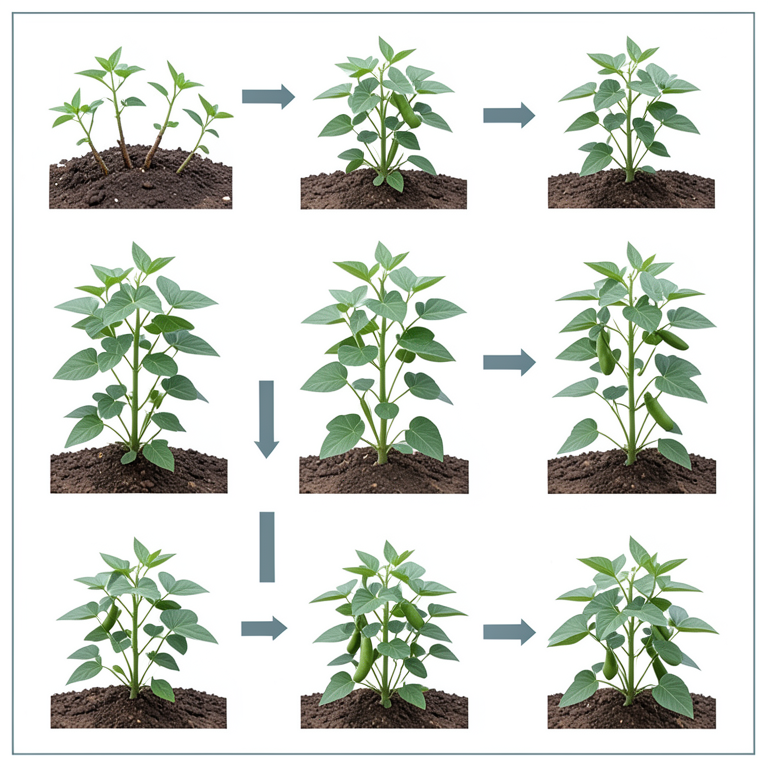
Experimental Treatment Matrix
AI-generated conceptual illustration (cowpea plants (Vigna sinensis Cv. Pusa Phalguni)). It explains the idea and does not show study data.
View source evidence ↗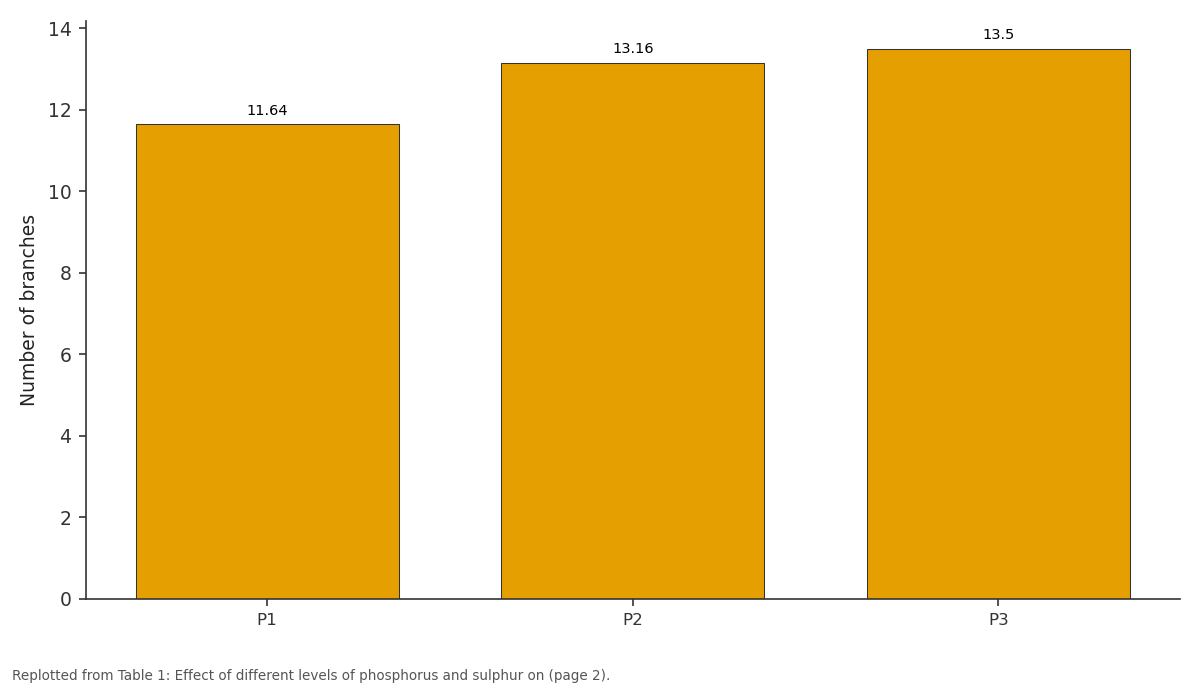
Number of branches: P1 vs P2 vs P3
Replotted from Table 1 (page 2) of the original paper. Every bar is the paper's own table value.
View source evidence ↗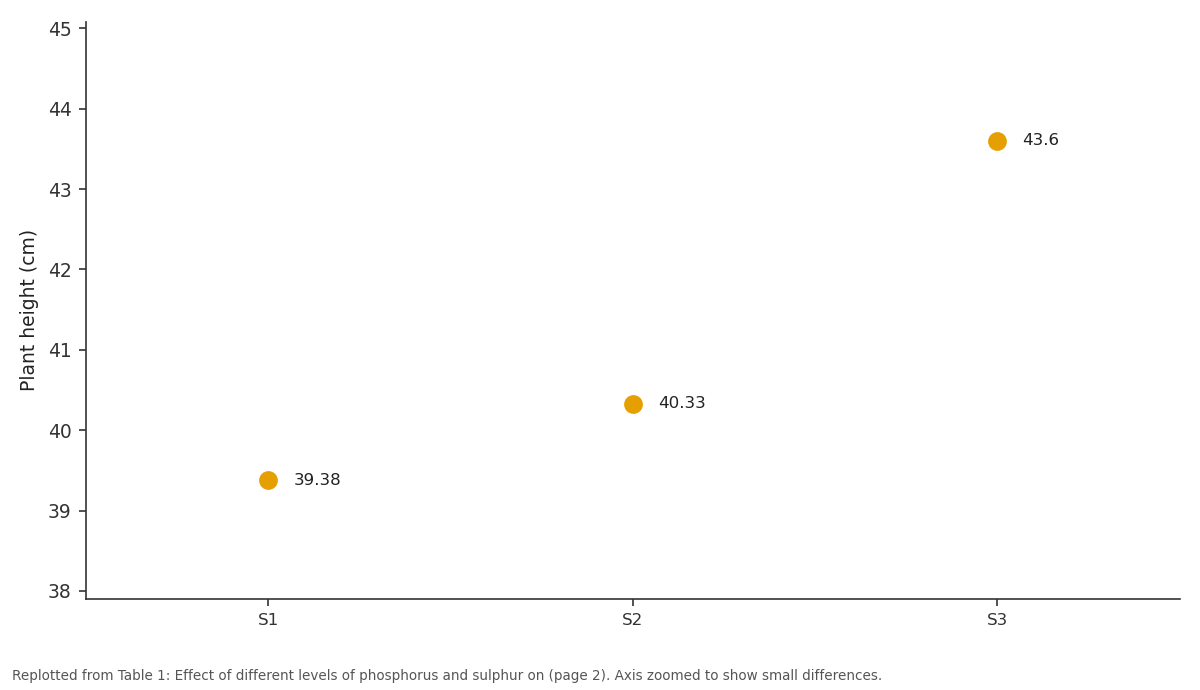
Plant height (cm): S1 vs S2 vs S3
Replotted from Table 1 (page 2) of the original paper. Every bar is the paper's own table value.
View source evidence ↗Figures & tables
From the original paper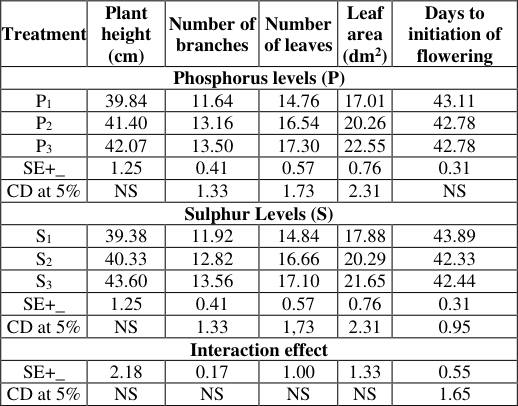 Table 1
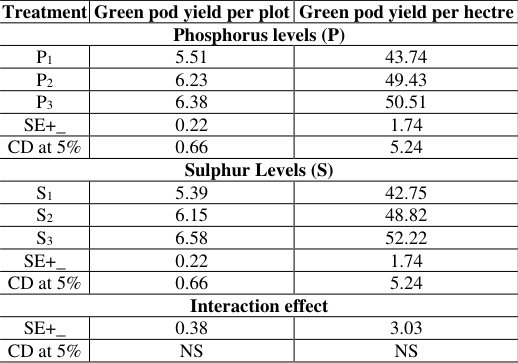 Table 2
Introduction
Cowpea is commercially growth throughout in india for its long pod green as vegetable for its seed as pulse for its foliage and fodder The nutrient available to plant particularly nitrogen and phosphorus are important constitution of protein and phospholipids, phosphorus not only enhance the root growth but also promotes early plant maturity Mullin et al., (1996) [3] phosphorus does not increase seed yield but also nodulation. Kuradikari et al., (1973) [2] reported that an increase of about 5%seed protein content of cowpea as a result of phosphorus application. Phosphorus is a vital element in all biological system and is limiting factor in enhancing the productivity of legumes. Its availability in tropical soils are less due to fixation by various soil reaction. Phosphorus does not only increase yield but also nodulation. Sulphur is a fourth major nutrient after nitrogen phosphorus and potassium Phosphorus all though not required in large quantities, critical to cowpea yield because of its multiple effect on plant nutrition (Muleba and Ezmumah, (1985) [4] Legume and oilseed crops have been found respond to sulphur application in soil because of deficiency in Availed sulphur Dev and kumar (1982) [1] . Because of relatively higher protein content in seed and straw cowpea requirs high amount of sulphur than other legume crops.
Materials and Methods
The experiment on effect of different levels of phosphorus and sulphur on yield of Cowpea. (Vigna sinensis) Pusa Phalguni was conducted at the instruction a cum Research farm Department of Horticulture, Collage of Agriculture, Latur during kharif season 2012-2013. The experiment was laid out in factorial randomized design with three levels each of phosphorus and sulphur consisting nine treatment combination replicated thrice. The treatment comprising of levels of phosphorus viz. P1:40 kg P 2 O 5 / ha,P 2 :50 kg P 2 O 5 /ha,P 3 :60 kg P 2 O 5 /ha and three levels of sulphur viz. S 0 :0 kg S / ha,S 1 : 20 kg S/ha,S 2 :40 kg S/ha. The recommended N and K each of 50 kg per hacter. Whereas the P and S was applied through urea and Diaammonium phosphate (DAP), phosphorus through DAP, potash through Mutrate of potash and sulphur through Gypsum. The cultural and other operation carried out during experimentation.
The crop was protected from insect and diseases by spraying pesticides, inecticides fungicides as and when required. The observation were recorded at 15 dayes interval.
Results and Discussion
Results presented in table in Table 1and 2 revelved that the different levels of fertigation had a significant influences on height of plant, number of leaves, leaf area and yield
Plant Height
The plant height at 60 DAS was not influenced significantly due to different levels of phosphorous while the maximum height of plant was recorded by the application of 60 kg P2O5 ha -1 (42.07cm). The different levels of sulphur the maximum value of plant height (43.60 cm)) was recorded by application of 40 kg S ha 1 Intraction effect of phosphorus and Sulphur on plant height was not found significant. The increasing plant height under phosphorus treatment might be due to role of phosphorus in casuing rapid cell division and cell elongation in the meristematic region of the plant similar results were also recorded by Sharma and Jat (2003) [7] .
Number of branches
The highest number of branches (13.50) recorded with the application of phosphorus at 60 kg h -1 and was found at par with 50 kg P 2 O 5 ha -1 The different levels of sulphur the significantly highest number of branches (13.56) per plant was observed with 40kg S h -1 at 60 DAS and was found at par with 20 kg S ha -1 . Intraction effect on number of branches per plant were not significant found. This may be probably due to the cumulative effect of phosphorus on the process of cell division, balanced nutrition and increased availability of phosporus. The result are close conformity with Yadav and Yadav (2011) [9] .
Number of leaves:
At 60 DAS application of 60 kg P 2 O 5 ha -1 produced significantly highest number of functional leaves. (17.30) per plant over 40kg S h -1 . The different levels of sulphur at 60 DAS application of 40kg S h -1 was recorded maximum number of branches per plant (17.10). The intraction effect between different levels of phosphorus and sulphur in mean number of leaves per plant was not found significant at 60 DAS. The might to due to phosphorus involved in the cell division, cell elongation. The results of the present study were in conformity with recorded by Owolade et al. (2003) [5] Leaf area: Significantly highest leaf area per plant (21.55dm 2 ) per plant was observed due to application of 40 kgS h -1 . Interaction effect was found non significan Days to initiation of flowering: Significantly minimum dayes (42.78days) to first flowering recorded by treatment 50 and60 kr phosphorus per hectar. The significantly early flowering (42.33 days) was reecoded when cowpea crpo was fertilizer with 20 kg Sper hectar was found stastically at par with 40kg per hectar Intraction effect found significant.
Green pod yield per plot and hectar:
The maximum green pod yield per plot and pre hector was influenced significantly due to different levels of phosphorus. The maximum pod yield per plot (6.38kg) and per hector (50.61q) was produced with the application of 60 kg P2O5 ha -1. The application of 40 kg S per hector was produced higher green pod yoeld per plot (6.5kg) and per hectar (52.22q). Which was found superior over without application of sulphur per hector. The application of 40 kgS h -1 was produced higher green pod yield per plot (6.5 kg) and per hectar (52.51 q) was found superior over without application of sulphur pper hectar. The higher green pod yield was recorde with higher level of phosphorus may be due to higher dose of phosphorus may be due to higher reproductive growth similar finding were reported by Rehman et al. (2007) [6] Subhramanian et al. (1977) [8] .
Figures and tables from the paper
| Treatment | Plant height (cm) | Number of branches | Number of leaves | Leaf area (dm2) | Days to initiation of flowering |
|---|---|---|---|---|---|
| Phosphorus levels (P) | |||||
| P1 | 39.84 | 11.64 | 14.76 | 17.01 | 43.11 |
| P2 | 41.40 | 13.16 | 16.54 | 20.26 | 42.78 |
| P3 | 42.07 | 13.50 | 17.30 | 22.55 | 42.78 |
| SE+ _ | 1.25 | 0.41 | 0.57 | 0.76 | 0.31 |
| CD at 5% | NS | 1.33 | 1.73 | 2.31 | NS |
| Sulphur Levels (S) | |||||
| S1 | 39.38 | 11.92 | 14.84 | 17.88 | 43.89 |
| S2 | 40.33 | 12.82 | 16.66 | 20.29 | 42.33 |
| S3 | 43.60 | 13.56 | 17.10 | 21.65 | 42.44 |
| SE+ _ | 1.25 | 0.41 | 0.57 | 0.76 | 0.31 |
| CD at 5% | NS | 1.33 | 1,73 | 2.31 | 0.95 |
| Interaction effect | |||||
| SE+ | 2.18 | 0.17 | 1.00 | 1.33 | 0.55 |
| _ CD at 5% | NS | NS | NS | NS | 1.65 |
Table text extracted from the original PDF; superscript letters are shown inline. The original table image is below.
View original table image
| Treatment | Green pod yield per plot | Green pod yield per hectre |
|---|---|---|
| Phosphorus levels (P) | ||
| P1 | 5.51 | 43.74 |
| P2 | 6.23 | 49.43 |
| P3 | 6.38 | 50.51 |
| SE+ _ | 0.22 | 1.74 |
| CD at 5% | 0.66 | 5.24 |
| Sulphur Levels (S) | ||
| S1 | 5.39 | 42.75 |
| S2 | 6.15 | 48.82 |
| S3 | 6.58 | 52.22 |
| SE+ | 0.22 | 1.74 |
| _ CD at 5% | 0.66 | 5.24 |
| Interaction effect | ||
| SE+ _ | 0.38 | 3.03 |
| CD at 5% | NS | NS |
Table text extracted from the original PDF; superscript letters are shown inline. The original table image is below.
View original table image
References
7 in the original paper- Kuradikeri CB, Patil RV, Krishnamurthy K. Response of cowpea (Vigna unguiculata L.) to varying fertilizer level. Mysore Journal of Agriculture Sciences. 1973;7:170-174.
- Mullins MC, Hammerschmidt M, Kane DA, Odenthal J, Brand M, Van Eeden FJ, et al. Genes establishing dorsoventral pattern formation in the zebrafish embryo: the ventral specifying genes. Development. 1996 Dec 1;123(1):81-93.
- Owolade OF, Adediran JA, Akande MA, Alali BS. Effect of application of cowpea fertilizer on brown blotch disease of cowpea. African Journal of Biotechnology. 2003;VI(5):343-347.
- Rehman MA, Hoque AK, Reheman NM, Talukdar MB, Islam MS. Effect of nitrogen and phosphorus on growth and yield of fresh bean. Journal of Soil and Nature. 2007;1(2):30-34.
- Sharma SK, Jat NL. Effect of phosphorus and sulfur on growth and yield of cowpea (Vigna unguiculata L.). Agricultural Research, New Series. 2003;24(1):215-216.
- Subhramanain A, Balasubramaian A, Venkatachalam C. Effect of varying levels of fertilizer and spacing on the yield of cowpea. Madras Agricultural Journal. 1977;64(9):614-615.
- Yadav SL, Yadav LR. Effect of phosphorus and biofertilizer on productivity of garden pea under semiarid conditions. Journal of Food Legumes. 2011;24(3):248249.