
Research article · 2023 · Full text
International Journal of Statistics and Applied MathematicsCorrelation analysis of perception of stakeholders towards preference of Chrysanthemum varieties
Volume 8(6S) · Pages 1319–1322 · DOI: 10.22271/maths.2023.v8.i6sr.1555 ↗
Research areasFlowering Plant Growth and Cultivation
Abstract
Author-writtenFloriculture is becoming a booming industry in the world today. The crop in India is subject to momentum of commercialization. Chrysanthemum (Dendranthema grandiflora) is popularly called as the “Queen of the east” with chromosome number 2n=2x=22 had its admirers and enthusiasts all over the world. Area under flower production in India is 64,768 hectares and that of Maharashtra is 6.606 ha. In India the area under chrysanthemum flower crop in is 25.76 hectares and that of Maharashtra is 0.39 ha. The study was conducted in Department of Floriculture and Landscape Architecture, College of horticulture, Dr. P. D. K. V. Akola, Maharashtra. 120 stakeholders were selected for study. The data was collected from 30 flower growers, 30 shopkeepers, 30consumers, 30 university scientists, thus the sample of 120 stakeholders were drawn and information from each were collected with the help of structured and pretested interview schedule. Frequencies, mean, standard deviation and coefficient of correlation were employed for interpreting the results. The exploratory design of social research was used for the present study.
Summary
Source-checkedPlain-language reading of the full paper, prepared with AI and checked against the text. Each point links to the authors' own words.
Why it matters
- Floriculture is currently a rapidly growing industry globally, and in India, it is experiencing a strong trend toward commercialization. View evidence ↗
- Chrysanthemum, known as the 'Queen of the east,' is highly popular for use in gardens, interior decoration as cut flowers, and greenhouse cultivation. View evidence ↗
- These flowers are utilized both as cut stems and loose flowers for various purposes, including bouquets, garlands, and religious worship. View evidence ↗
The question
- The study aimed to analyze the correlation between the perceptions of different stakeholders and their preferences for Chrysanthemum varieties. View evidence ↗
What they did
- The research was carried out at the Department of Floriculture and Landscape Architecture, College of Horticulture, Dr. P. D. K. V. Akola, Maharashtra. View evidence ↗
- The study sample consisted of 120 stakeholders, divided equally into four groups of 30: flower growers, shopkeepers, consumers, and university scientists. View evidence ↗
- Using an exploratory research design, participants were selected via simple random sampling and interviewed using a structured, pretested schedule. View evidence ↗
- Data analysis was performed using frequencies, means, standard deviations, and the coefficient of correlation. View evidence ↗
What they found
- Among flower growers, education and innovativeness showed a positive significant correlation (p < 0.05), while family size and annual income had no significant correlation with perception. View evidence ↗
- For shopkeepers, age, marketing experience, and market orientation were positively and highly significantly correlated with perception (p < 0.01). View evidence ↗
- Shopkeepers' education, annual income, marketing income, and economic motivation were significantly correlated with perception (p < 0.05), but family size was not. View evidence ↗
- Among consumers, age, education, occupation, social participation, and market orientation were positively and highly significantly correlated with perception (p < 0.01). View evidence ↗
- Consumer annual income and the purpose of using flowers were significantly correlated with perception (p < 0.05), while family size showed no significant correlation. View evidence ↗
- Interpersonal communication and self-confidence among university scientists were positively and significantly correlated with perception (p < 0.05). View evidence ↗
What it means
- The authors concluded that the null hypothesis was rejected for most profile characteristics that showed significant correlation with perception, while it was accepted for non-significant factors like family size. View evidence ↗
Visual summary
3 visualsIllustrations explain the paper; charts are replotted from the paper's own table values.

Stakeholder Composition
AI-generated conceptual illustration (Chrysanthemum flowers and diverse human stakeholders). It explains the idea and does not show study data.
View source evidence ↗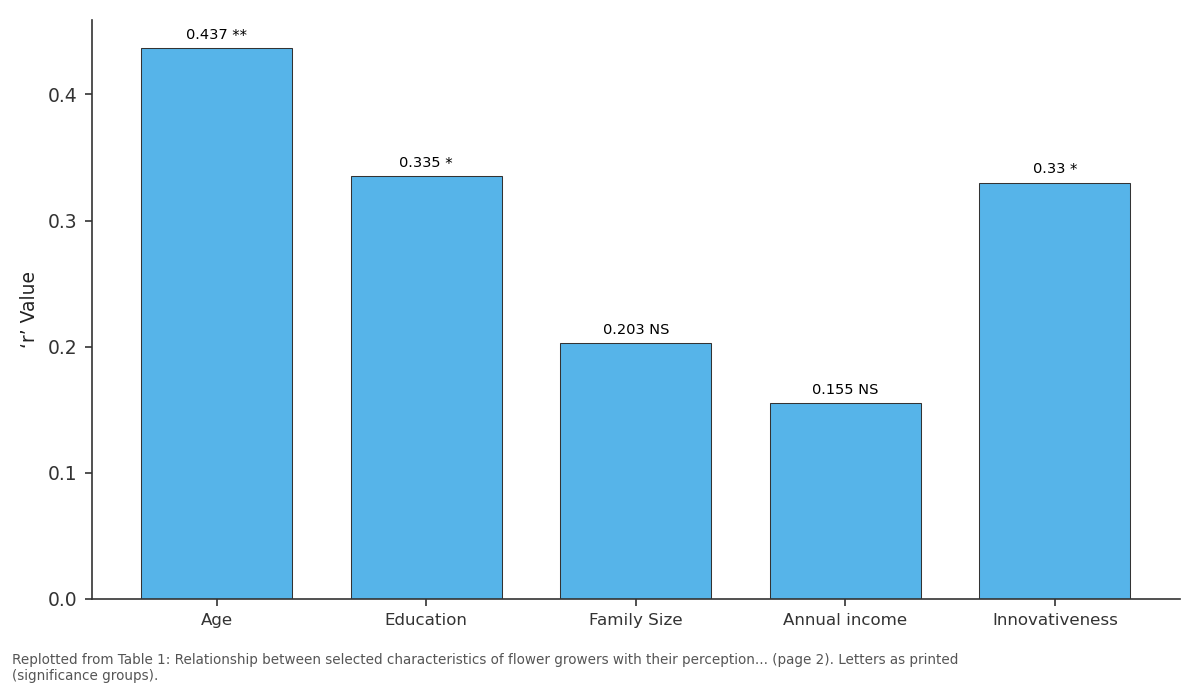
‘r’ Value: Age vs Education vs Family Size vs Annual income vs Innovativeness
Replotted from Table 1 (page 2) of the original paper. Every bar is the paper's own table value.
View source evidence ↗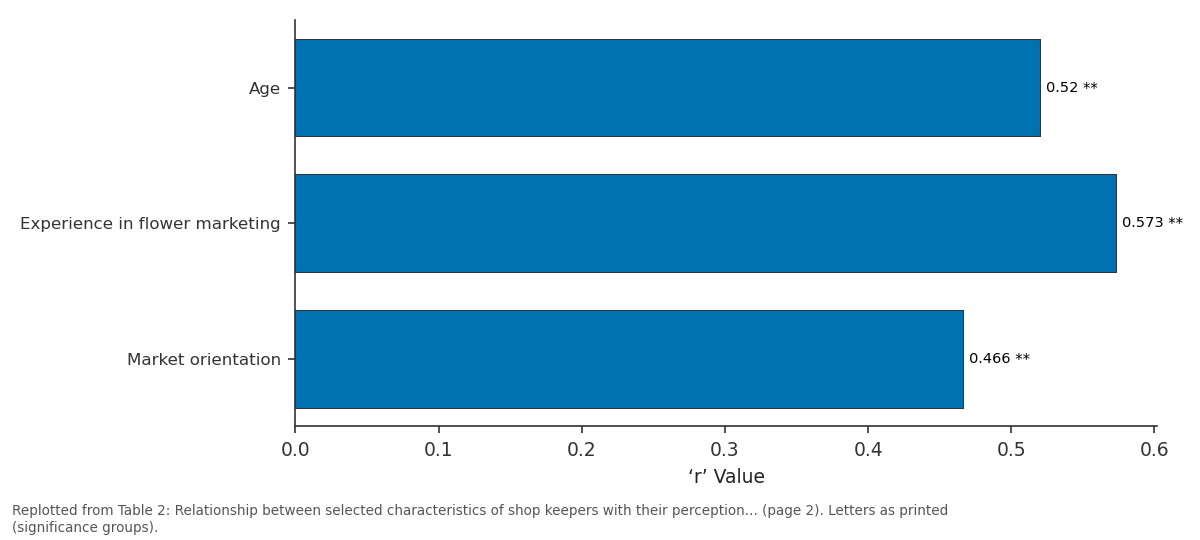
‘r’ Value: Age vs Experience in flower... vs Market orientation
Replotted from Table 2 (page 2) of the original paper. Every bar is the paper's own table value.
View source evidence ↗Figures & tables
From the original paper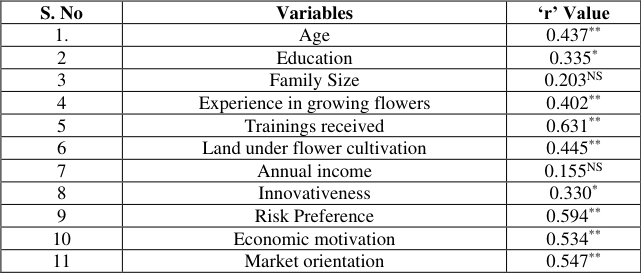 Table 1
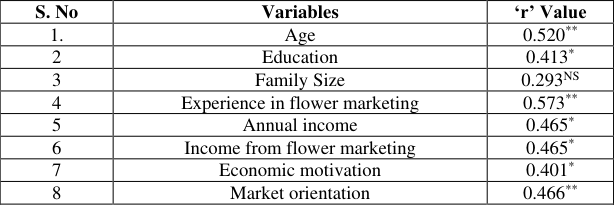 Table 2
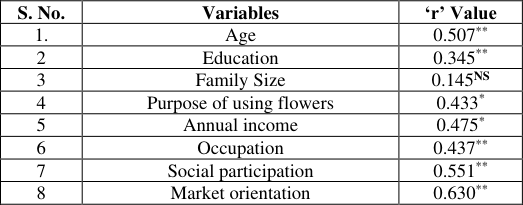 Table 3
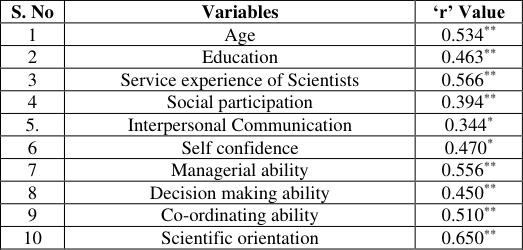 Table 4
Introduction
Chrysanthemum (Dendranthema grandiflora) is popularly called as the "Queen of the east" with chromosome number 2n = 2x = 22 had its admirers and enthusiasts all over the world. It belongs to the family Asteraceae. The chrysanthemum has earned tremendous popularity as an ornamental flower for the garden, as cut flower for interior decoration or for the green house cultivation. The flower is used as cut flower and loose flower are used for making garlands, veni, bouquets and for worship. The dwarf and compact growing plants are used in flowerbed, mixed borders, edging, pot plants, hanging baskets, window boxes and front row planting. The consumers are exposed greatly to the quality attributes of chrysanthemum and could assess better these attributes. Production of flowers is estimated to be nearly 30 lakh metric tonnes of loose flowers and over 500 million cut flowers with stem. In case of production also the estimates could be at variance from the actual figures as some of the flowers like rose, chrysanthemum, and tuberose are used both as loose flowers and with stem. Average market price of chrysanthemum flower is Rs.5 to Rs25/kg or dozen or each stem. The area under the Chrysanthemum flower crop in Maharashtra According to data released by (Indiastatagri) in the year (2017-2018) was 0.39 ha, production was 1.65 metric tonnes and productivity is 4.33metric tonnes per ha. In Maharashtra the leading districts in floriculture production are Nasik, Ahmednag Thane, satara, sangli and Nagpur, and in India the area under chrysanthemum flower crop in is 25.76 hectares and production is 464.41 metric tonnes (India stat Agri). The present study was conducted in the Department of Floriculture and Landscape Architecture, College of Horticulture, Dr. Panjabrao Deshmukh Krishi Vidyapeeth, Akola, Maharashtra. Department of Floriculture and Landscape Architecture had released some of flower crop varieties of Chrysanthemum, Gladiolus etc. Shanti is a variety of chrysanthemum and it is very good cut flower variety. Methodology: Over a few years many varieties of were growing and trails are being conducted in the Department of Floriculture and Landscape Architecture. To make awareness of different varieties of a chrysanthemum department appealed all the stakeholders i.e. flower growers, shopkeepers, consumers, university scientists and university students to visit the chrysanthemum flower demonstration trails. Number of stakeholders visited to the chrysanthemum trail plots during flowering stage. Accordingly the visiting stakeholders were contacted and are selected through simple random sampling method. Exploratory research design was used. Structured interview schedule was used for collecting the data. Total number of respondents were 120 consists of four groups of stakeholders. They were flowers growers, shopkeepers, consumers, and university scientists are selected. Each group of stakeholders consists of 30 respondents. Frequencies, mean, standard deviation and coefficient of correlation were employed for analysis of the data and interpreting the results.
Coefficient of correlation:
This technique was used to find out the relationship between two variables and the following formula was used for computation of 'r' value.
Where, r = Correlation coefficient X = Score of independent variables Y = Score of dependent variables X = Mean of independent variable Y = Mean of dependent variable If 'r' calculated is more than the table value at 0.01 and 0.05 level of probability at (n-2) degree of freedom, the relationship was significant and if less than table value then the relationship was non-significant. The perusal of the data displayed in table 1 clearly indicates the calculated co-relation co-efficient between perception of flower growers and their profile revealed the following results which clearly indicated that, selected characteristics of flower growers i.e. age (0.437 ** ), experience in growing flowers(0.402 ** ), trainings received(0.631 ** ), land under flower cultivation (0.445 ** ), risk preference(0.594 ** ), economic motivation (0.534 ** )and market orientation(0.547 ** ) were found to be positively and highly significantly correlated with perception at 0.01 level of probability. Whereas, education (0.335 * ), Innovativeness (0.330 * ) and were found to be positively and significantly correlated with perception at 0.05 level of probability. Whereas, the family size (0.203 NS ) and annual income (0.155 NS ) were found to non-significantly correlated with perception. The perusal of the data displayed in table 2 clearly indicates the calculated co-relation co-efficient between perception of shop keepers and their profile revealed the following results which clearly indicated selected characteristics of shop keepers i.e. age (0.520 ** ), experience flower marketing (0.573 ** ) and market orientation (0.466 ** ) were found to be positively and highly significantly correlated with perception at 0.01 level of probability. Whereas, education (0.413 * ), Annual income (0.465 * ), Income from flower marketing (0.465 * ) and economic motivation (0.401 * ) were found to be positively and significantly correlated with perception at 0.05 level of probability whereas, the family size (0.293 NS ) was found to be non-significantly correlated with perception The perusal of the data displayed in table 3 clearly indicates the calculated co-relation co-efficient between perception of consumers and their profile revealed the following results which clearly indicated selected characteristics of consumers i.e., age (0.507 ** ), education (0.345 ** ), occupation (0.437 ** ), social participation (0.551 ** ) and market orientation (0.630 ** ) were found to be positively and highly significantly correlated with perception at 0.01 level of probability. Whereas, annual income (0.475 * ) and Purpose of sing flowers (0.433 * ), were found to be positively and significantly correlated with perception at 0.05 level of probability. Whereas, the family size (0.145 NS ) was found to be non-significantly correlated with perception. The perusal of the data displayed in Table 4 clearly indicates the calculated co-relation co-efficient between perception of university scientists and their profile revealed the following results which clearly indicated selected characteristics of university scientists i.e. age (0.534 ** ), education (0.463 ** ), service experience of scientists (0.566 ** ), social participation (0.394 ** ), managerial ability (0.556 ** ), co-ordinating ability (0.510 ** ), decision making ability (0.450 ** ) and scientific orientation (0.650 ** ) were found to be positively and highly significantly correlated with perception at 0.01 level of probability. Whereas, interpersonal communication (0.344 * ), self-confidence (0.470 * ) were found to be positively and significantly correlated with perception at 0.05 level of probability.
| S. No | Variables | ‘r’ Value |
|---|---|---|
| 1 | Age | 0.534** |
| 2 | Education | 0.463** |
| 3 | Service experience of Scientists | 0.566** |
| 4 | Social participation | 0.394** |
| 5. | Interpersonal Communication | 0.344* |
| 6 | Self confidence | 0.470* |
| 7 | Managerial ability | 0.556** |
| 8 | Decision making ability | 0.450** |
| 9 | Co-ordinating ability | 0.510** |
| 10 | Scientific orientation | 0.650** |
Table text extracted from the original PDF; superscript letters are shown inline. The original table image is below.
View original table image
| S. No. | Variables | ‘r’ Value |
|---|---|---|
| 1. | Age | 0.507** |
| 2 | Education | 0.345** |
| 3 | Family Size | 0.145NS |
| 4 | Purpose of using flowers | 0.433* |
| 5 | Annual income | 0.475* |
| 6 | Occupation | 0.437** |
| 7 | Social participation | 0.551** |
| 8 | Market orientation | 0.630** |
Table text extracted from the original PDF; superscript letters are shown inline. The original table image is below.
View original table image
| S. No | Variables | ‘r’ Value |
|---|---|---|
| 1. | Age | 0.520** |
| 2 | Education | 0.413* |
| 3 | Family Size | 0.293NS |
| 4 | Experience in flower marketing | 0.573** |
| 5 | Annual income | 0.465* |
| 6 | Income from flower marketing | 0.465* |
| 7 | Economic motivation | 0.401* |
| 8 | Market orientation | 0.466** |
Table text extracted from the original PDF; superscript letters are shown inline. The original table image is below.
View original table image
| S. No | Variables | ‘r’ Value |
|---|---|---|
| 1. | Age | 0.437** |
| 2 | Education | 0.335* |
| 3 | Family Size | 0.203NS |
| 4 | Experience in growing flowers | 0.402** |
| 5 | Trainings received | 0.631** |
| 6 | Land under flower cultivation | 0.445** |
| 7 | Annual income | 0.155NS |
| 8 | Innovativeness | 0.330* |
| 9 | Risk Preference | 0.594** |
| 10 | Economic motivation | 0.534** |
| 11 | Market orientation | 0.547** |
Table text extracted from the original PDF; superscript letters are shown inline. The original table image is below.
View original table image
Results and Discussion
Results and Discussion
Conclusion
The findings of the data displayed in table 1 clearly indicates the calculated co-relation co-efficient between perception of flower growers and their profile revealed the following results which clearly indicated that, selected characteristics of flower growers i.e. age, experience in growing flowers, trainings received, land under flower cultivation, risk preference, economic motivation and market orientation were found to be positively and highly significantly correlated with perception. Whereas, education, Innovativeness and were found to be positively and significantly correlated with perception. Therefore, the null hypothesis was rejected for these characteristics. Whereas, the family size and annual income were found to be non-significantly correlated with perception. Therefore, the null hypothesis was accepted for this characteristic. The findings of the data displayed in the table 2 clearly indicates the calculated co-relation co-efficient between perception of shop keepers and their profile revealed the following results which clearly indicated that, selected characteristics of shop keepers i.e. age, experience flower marketing, and market orientation were found to be positively and highly significantly correlated with perception. Whereas education, Annual income, income from flower marketing, economic motivation were found to be positively and significantly correlated with perception. Therefore, the null hypothesis was rejected for these characteristics. Whereas, the family size was found to be non-significantly correlated with perception of shopkeepers. Therefore, the null hypothesis was accepted for this characteristic. The findings of the data displayed in table 3 clearly indicates the calculated co-relation co-efficient between perception of consumers and their profile revealed the following results which clearly indicated that, selected characteristics of consumers i.e., age, education, occupation, social participation, and market orientation were found to be positively and highly significantly correlated with perception. Whereas, annual income and Purpose of using flowers were found to be positively and significantly correlated with perception at 0.05 level of probability Therefore, the null hypothesis was rejected for these characteristics. Whereas, the family size was found to be non-significantly correlated with perception of consumers. Therefore, the null hypothesis was accepted for this characteristic. The findings of the data displayed in table 4 clearly indicates the calculated co-relation co-efficient between perception of university scientists and their profile revealed the following results which clearly indicated that, selected characteristics of university scientists i.e. age, education, service experience of scientists, social participation, managerial ability, coordinating ability, decision making ability, co-ordinating ability and scientific orientation were found to be positively and highly significantly correlated. Whereas Interpersonal communication, self-confidence was found to be positively and significantly correlated with perception 0. Therefore, the null hypothesis was rejected for these characteristics.
References
1 in the original paper- Srivani. Farmers Perception towards Pradhan Mantri van Dhan Vikas Yojana in East Godavari District of Andhra Pradesh. Indian journal of Extension Education. 2022;58(1):165-169.