
Research article · 2024 · Full text
International Journal of Research in AgronomyInfluence of soil, environment, crop and verities on protein and minerals (in, Zn, Cu and Mn), in northern Karnataka
Volume 7(1) · Pages 24–36 · DOI: 10.33545/2618060x.2024.v7.i1a.187 ↗
Research areasRice Cultivation and Yield ImprovementAgricultural Science and FertilizationGenetics and Plant Breeding
Abstract
Author-writtenSmall millets are climate smart cereals and they are rich in fibre, protein and minerals which are essential for human good health. Now days, number of nations including India suffering from malnutrition. The aim of investigation is to know what factors influence on nutrients of small millets are. presently There were eight different genotypes were taken from four small millet crops viz., Finger millet, foxtail millet, proso millet and little millet and experiments were carried out in Hanumanamatti and Dhrwad in zone -8 and Mudhol in zone-3 of Karnataka. These genotypes produced protein range from 7.05 per cent (DHFM-78-3 at finger millet) to 11.975 per cent (DHPM-2769 in proso millet), iron content recorded range from1.437 mg/100 g (karisavi grain) to 5.686 mg/ 100 (DHPM-2769in proso millet at Dharwad). Variability of manganese range between 0.0962 mg/ 100 g (DHPM-2769 at Dharwad) to 0.931 mg /100g of (DHFM-78-3 in finger millet at Hanumanamatti), while copper range from 0.207 mg /100 g (DHLM-36-3 in little millet at Hanumanamatti) to 0.934 mg/100 g (DHLM-36-3 in little millet at Mudhol). The zinc content varied from 0.364 mg/100g (Mallesavi in little millet at Hanumanamatti) to 1.262 mg/100g of grain (DHPM-2769, Mudhol).
Summary
Source-checkedPlain-language reading of the full paper, prepared with AI and checked against the text. Each point links to the authors' own words.
Why it matters
- Small millets are considered climate-smart cereals that provide essential proteins, minerals, and fiber necessary for human health. View evidence ↗
- The study is motivated by the fact that many nations, including India, are currently experiencing malnutrition. View evidence ↗
The question
- The research aims to identify the factors that influence the nutrient content of small millets. View evidence ↗
What they did
- Eight genotypes from four small millet crops (foxtail, little, proso, and finger millet) were grown across three locations in Karnataka: Hanumanamatti, Dharwad, and Mudhol. View evidence ↗
- The researchers collected grains to estimate the levels of protein and specific minerals, including iron, manganese, copper, and zinc, following AOAC 2005 standards. View evidence ↗
- The evaluation of the eight cultivars was conducted using three replications. View evidence ↗
What they found
- Across the crops, foxtail millet had the highest average protein content (10.84%), followed by proso millet (10.82%), little millet (8.84%), and finger millet (7.8%). View evidence ↗
- Little millet recorded the highest average iron content at 3.11 mg/100g, while the lowest was noted in finger millet at 1.947 mg/100g. View evidence ↗
- Finger millet (DHFM-78-3) had the highest manganese content (0.652 mg/100g), whereas proso millet had the lowest (0.141 mg/100g). View evidence ↗
- Proso millet genotypes exhibited the highest zinc content (1.26 mg/100g), while little millet had the lowest (0.436 mg/100g). View evidence ↗
- The highest copper content was found in finger millet (DHFM-78-3) at 0.792 mg/100g, with foxtail millet recording the lowest at 0.558 mg/100g. View evidence ↗
- The study found that protein content is influenced by the specific crop, variety, soil type, and environment. View evidence ↗
- The nitrogen content in the millets generally followed the nitrogen levels in the soil, although not in an exact proportion. View evidence ↗
- Genotype, soil, and environment significantly affected manganese levels in foxtail, little, and finger millets, but had very little influence on proso millet. View evidence ↗
What it means
- The authors conclude that proso millet generally provides the highest protein content (~11.5%), while finger millet provides the least (~8.0%). View evidence ↗
Visual summary
3 visualsIllustrations explain the paper; charts are replotted from the paper's own table values.
Nutrient Comparison Across Millet Types
AI-generated conceptual illustration (Foxtail, proso, little, and finger millet grains). It explains the idea and does not show study data.
View source evidence ↗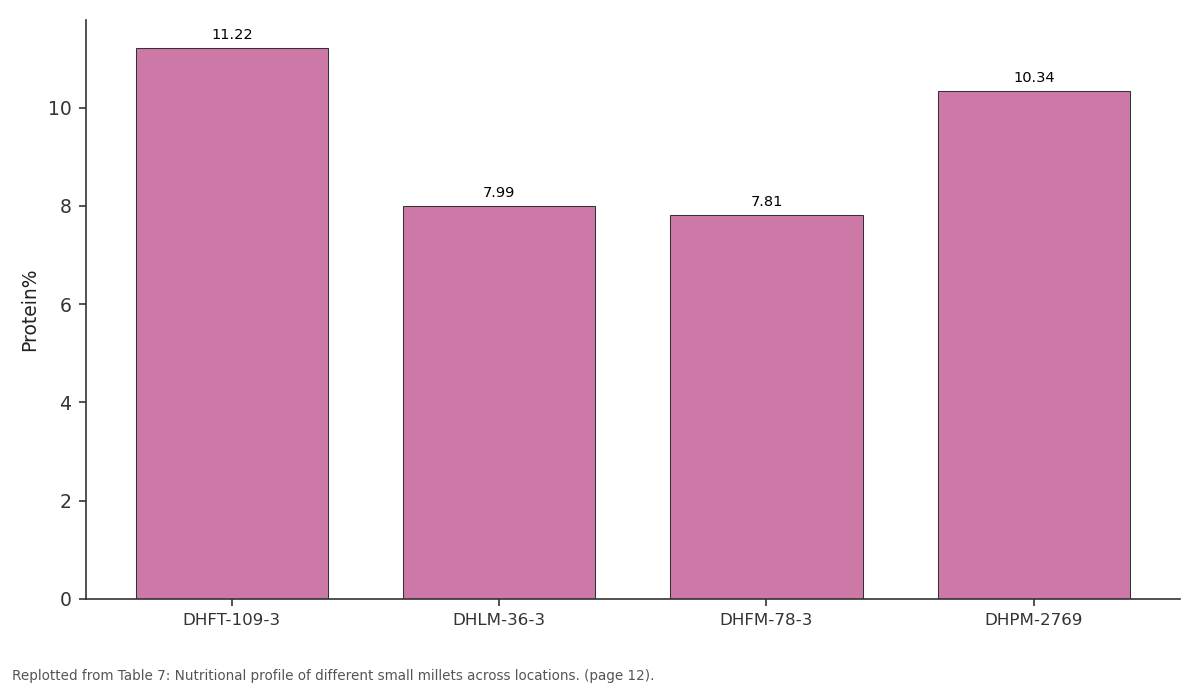
Average across location: DHFT-109-3 vs DHLM-36-3 vs DHFM-78-3 vs DHPM-2769
Replotted from Table 7 (page 12) of the original paper. Every bar is the paper's own table value.
View source evidence ↗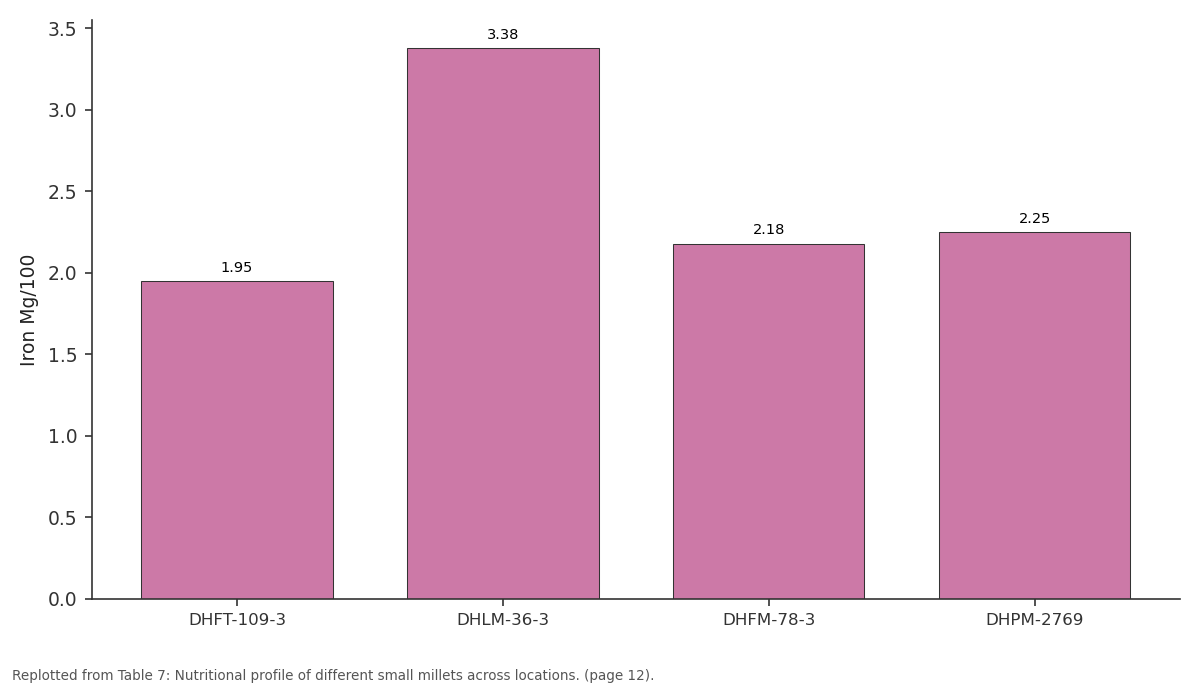
Average across location: DHFT-109-3 vs DHLM-36-3 vs DHFM-78-3 vs DHPM-2769
Replotted from Table 7 (page 12) of the original paper. Every bar is the paper's own table value.
View source evidence ↗Figures & tables
From the original paper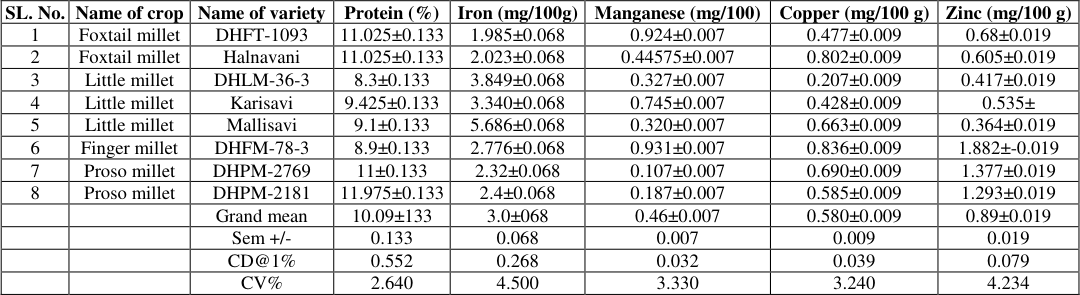 Table 1
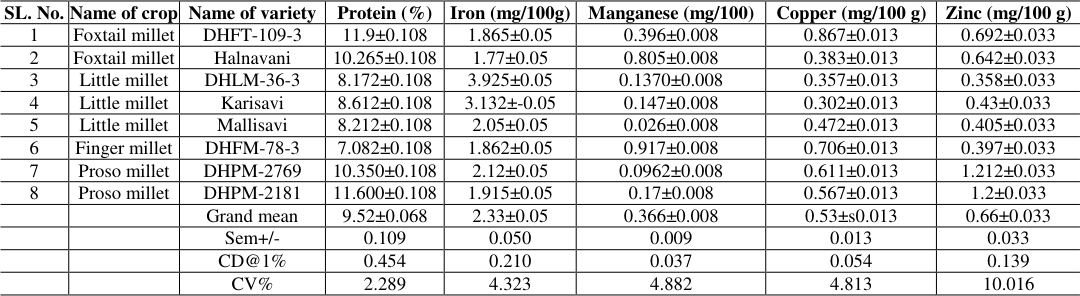 Table 2
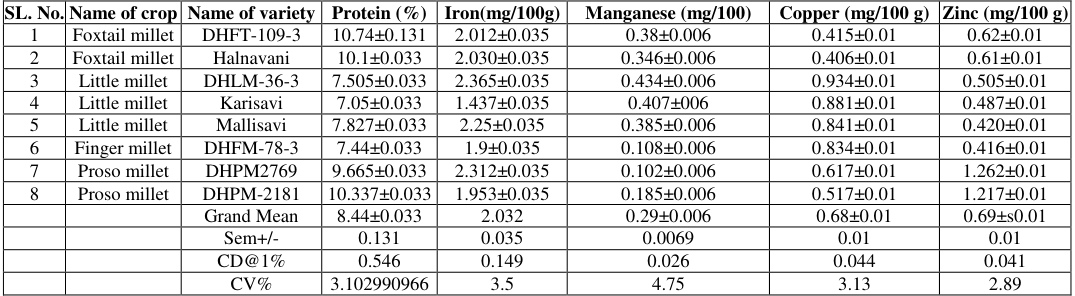 Table 3
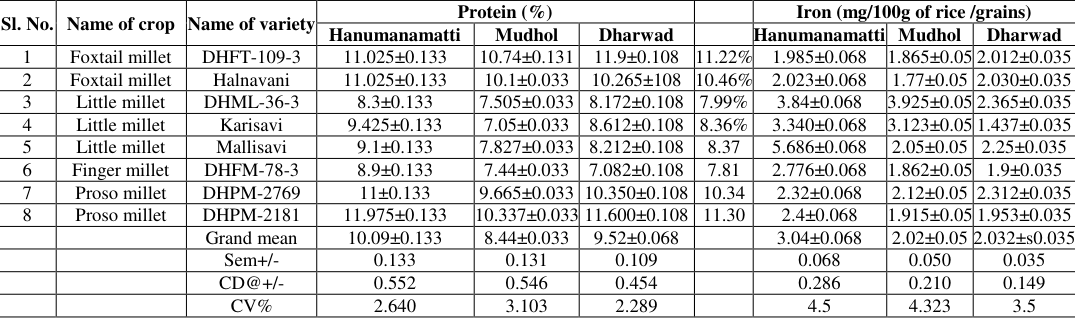 Table 4
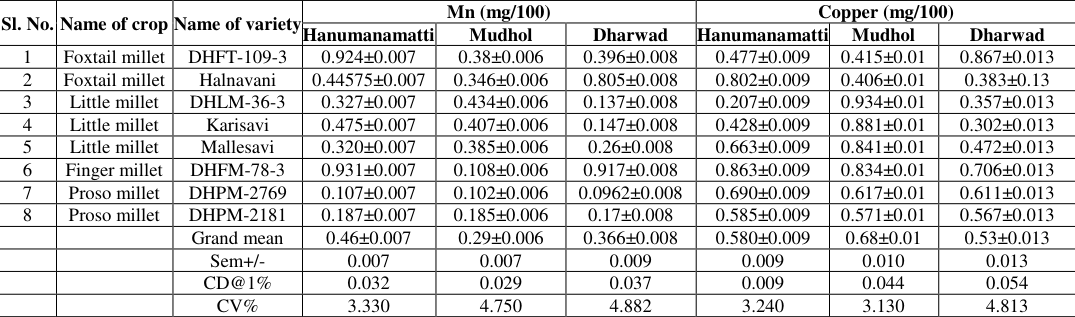 Table 5
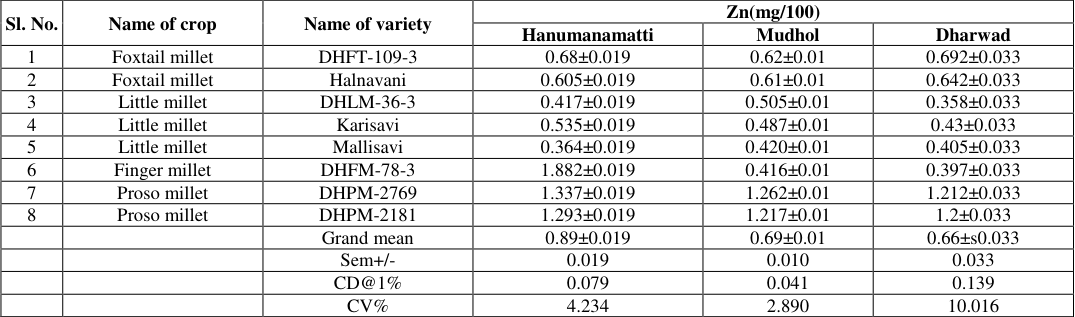 Table 6
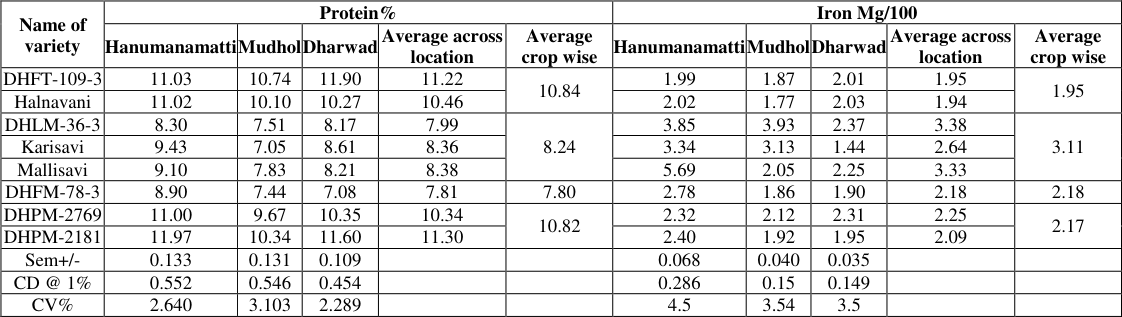 Table 7
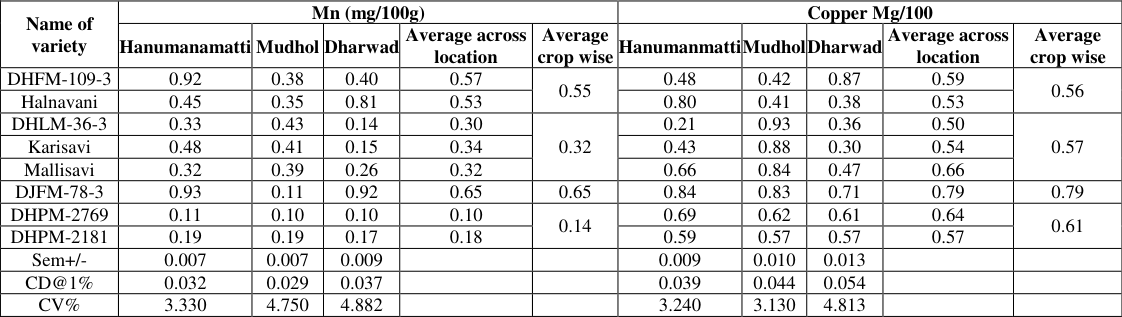 Table 8
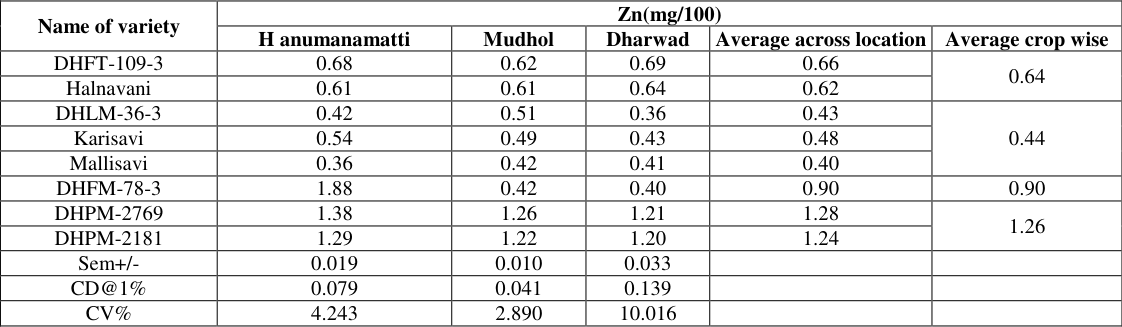 Table 9
 Table 10
Introduction
The group of small millets is represented by finger millet (Eleusine coracana) little millet (Panicum sumatrense), foxtail millet (Setaria italic) barnyard millet (Echinochloa frumentacea) and Proso millet (Panicum miliaceum). Millets are group of small grained cereal food crops which are highly nutritious and grown under marginal/ low fertile soils with very low inputs such as fertilizers and pesticides. These crops largely contribute to food and nutritional security of India. Most of millet crops are native of India and are popularly known as nutri cereal as they provide most of the nutrients required for normal functioning of human body. Millets are rain fed crops and are grown in regions with low rainfall and thus resume greater importance for sustained agriculture and food security. Millets require very less water as compared to rice and wheat and considered drought tolerant crops. These crops are majority grown in regions receiving less than 450 mm rain fall (compared to about 700 mm for maize). There are twenty amino acids that help to form the thousands of different proteins in our body and our body needs protein for growth and maintenance of tissues. Proteins do most their work in the cell and various jobs which includes antibodies production against microbes. Similarly, essential elements like iron, zinc, manganese and copper also play big role in metabolic activities which help to lead normal life. These all things insist to know quantity of protein and essential minerals in different genotypes of different small millets in different locations.
Materials and Method
Eight small millets genotypes viz., DHFt-109-3 and Halnavani of foxtail millet and DHLM-36-3, Karisavi and Mallesavi of little millet and DHPM-2769 and DHPM-2181 of proso millet and DHFM-78-3 of finger millet were grown at Hanumanamatti (red soil and zone-8 of Karnataka), Dharwad (black soil and zone 8 of Karnataka) and Mudhol (black soil and zone-3 of Karnataka) collected the grains and estimated protein and minerals viz., iron, manganese, copper and zinc according to AOAC 2005. The experiment was performed at the Department of Food and nutrition, College of Community Science, University of Agricultural Sciences, Dharwad, Karnataka state, India. Eight cultivars from four small millets were evaluated in three replications. Eight small millets genotypes viz., DHFt-109-3 and Halnavani in foxtail millet and DHLM-36-3, Karisavi and Mallesavi in little millet and DHPM-2769 and DHPM-2181 in proso millet and DHFM-78-3 in finger millet were grown at Hanumanamatti (red soil and zone-8 of Karnataka), Dharwad (black soil and zone 8 of Karnataka) and Mudhol (black soil and zone-3 of Karnataka) collect the grains and estimated protein and essential minerals and estimation procedure has been given below.
Protein estimation
The experiment was performed at Food Technology Department of the Community Science College, University of Agricultural Sciences, Dharwad, Karnataka state, India. Eight cultures from four small millets were evaluated in three replications. Out of four crops foxtail millet genotypes produced maximum followed by proso millet, little millet and finger millet. The nitrogen analyses were performed according to the INCT-CA method N-001/1 (Kjeldahl method) using the salt sodium sulfate (Na2SO4 P.A., Vetec V000121) and the copper sulfate catalyst (CuSO4.5H2O P.A., Isofar 321) as digestion mixture components. However, different ratios between these compounds (salt-to-catalyst ratio) and different amounts of the digestion mixture per aliquot were used. The same concentrated sulfuric acid was used for all analyses (H2SO4 technical grade 95% Vetec V0T0145). The experiment lasted nine days, and each group of samples (low-nitrogen, high-nitrogen, and the standard) was analyzed for three consecutive days. To perform the digestion procedures, approximately 200 mg of the samples were poured into glass tubes followed by the addition of the digestion mixture according to the aforementioned treatments. Subsequently, 5 mL of sulfuric acid was added. The tubes were then heated up to 400°C, and from this moment began the digestion time count. The digestion endpoint was defined when the solution became liquid and translucent, and the brownish smoke stopped being released. The tubes were allowed to cool at room temperature. After that, distilled water was added to the tube in sufficient quantity to double the final volume of the solution and then manually stirred. Then, the contents of the tubes were steam-distilled in the Kjeldahl distillation apparatus (TE-036/1, Tecnal Equipamentos para Laboratórios, Piracicaba, and São Paulo State, Brazil) using 25 mL of a sodium hydroxide solution (500 g L -1 , NaOH P.A., ACS Vetec 1137). The steam obtained from distillation was collected in an Erlenmeyer flask containing 20 mL of a boric acid solution (40 g L -1 , H3BO3 P.A., Proquímios). Methyl red and bromocresol green were used as indicators. The final volume of the distilled was standardized to 100 mL. The distilled was then titrated with a standard solution of hydrochloric acid (0.02 N for low-nitrogen materials and 0.05 N for the standard and high-nitrogen materials, HCl P.A., Vetec V000154). The hydrochloric acid solutions were previously standardizing using sodium carbonate solutions (Na2CO3 anhydrous P.A., Isofar 349) as described in method INCT-CA N-001/1. Nitrogen contents in the samples were estimated through the equation:
Where, (1) N is the nitrogen content (g kg -1) , V is the volume of hydrochloric acid solution in the titration (mL), B is the volume of hydrochloric acid solution obtained in the titration of the blanks (mL), Ne is the expected normality of hydrochloric acid solution (0.02 or 0.05 N), f is the correction factor of the hydrochloric acid normality obtained by using sodium carbonate solutions, and A is the aliquot weight (mg). The evaluations of the analytical standard (Lysine-HCl) were performed based on the nitrogen recovery from the aliquots (g g - 1) . The actual content of nitrogen in Lysine-HCl was established through the chemical composition of the molecule and the purity of the material. The dry matter content of the standard was performed in triplicate by the Karl Fisher titration method using the equipment 870 KF Titrino plus (Metrohm, Herisau, Switzerland). The nitrogen content of the standard was 137.3 g N kg -1 of dry matter. The statistical analyses of the nitrogen recovery of the standard were performed according to the model.
Where, Yijkl is the nitrogen recovery in the aliquot l, at day k, using saltto-metal catalyst ratio i, and amount of digestion mixture j; µ is the general constant; Ri is the effect of salt-to-metal catalyst ratio in the digestion mixture i (fixed effect); Qj is the effect of digestion mixture amount j (fixed effect); RQij is the interaction between the main effects (fixed effect); Dk is the effect of the day of analysis k (random effect); and εijkl is the random error.
Based on the results of analysis of variance, the evaluation of nitrogen recovery from the standard was performed through Student's t-test considering the hypotheses:
When the null hypothesis was accepted (3a), it was concluded that there is complete recovery of the nitrogen from the standard. The statistical analyses of the nitrogen content and digestion time for high-and low-nitrogen materials were performed separately. It is noteworthy that the nitrogen contents were evaluated on as-is basis in order to avoid the accumulation of error from the estimation of the total dry matter content. The model was:
Yijklm is nitrogen content or digestion time in the aliquot m, at day l, from sample i, using salt-to-metal catalyst ratio j, and digestion mixture amount k; µ is the general constant; Mi is the sample effect i (fixed effect); Rj is the effect of salt-to-metal catalyst ratio in the digestion mixture j (fixed effect); Qk is the effect of digestion mixture amount k (fixed effect); MRij, MQik, RQjk and MRQijk are the interactions between the main effects (fixed effects); Dl is the effect of the day of analysis (random effect); and εijklm is the random error. Subsequently, another set of analysis of variance was performed for the nitrogen content of each sample evaluated by each treatment according to the model.
Yij is the nitrogen content in the aliquot j analysed on day i; µ is the general constant; Di is the effect of the day of analysis i (random effect), and ε(i)j is the random error.
The estimate of residual variance (variability between aliquots) obtained from model ( 5) was used to calculate the repeatability of nitrogen contents according to each treatment as follows:
Where: r is the standardized repeatability (%), is the residual variance, and is the average content of nitrogen. All statistical procedures were carried out using the Mixed procedure of SAS 9.4 (2014 ) and adopting α = 0.05. When necessary, average values were compared using the Fisher's Least Significant Difference.
Estimation of minerals
Estimation of minerals
Results and Discussion
The protein name comes from the Greek word proteins meaning ''primary'' or first place. Proteins are made up of amino acids that joins together to form long chains. Generally protein as a string beads in which each bead in which each bead is an amino acid. There are 20 amino acids that help to form the different proteins in body. Proteins do most of their work in the cell and perform various jobs. Important works of proteins are 1) growth and maintenance of tissues. other small millets. These results reveal that protein content depends upon crop, variety, soil and environment. Similar results were observed by Sujata Bhat et al 2018 [2] , Sarita Ekta Singh 2016 [3] and Himanshu et al 2018 [5] in only one location. Iron (Fe).
The role of iron in our body was very complex. Iron is an essential element for blood production beyond this, iron supports many other body functions as well. Despite its importance, we know less about why we need to ensure we maintain our iron level or how much iron we need. Look into the following functions that our iron levels help to sustain good health.
1. If we feel that you may be need support one or more of these areas, it may be worth consulting our health care practitioner about our iron levels. 2. One of most important functions of iron is heme synthesis which forms haemoglobin a protein found in red blood cells. 3. Haemoglobins' primary role is to transport oxygen from the lungs to body tissue to maintain basic life functions. 4. Without healthy blood cells, our body can't get enough oxygen result of this increasing tired or exhausted. 5. Iron plays vital role in the process by which cells generate energy. 6. Human cells require iron in order to covert biochemical energy from nutrients into ATP (Adenosine Triphosphate) from multistep process known as cellular respiration. ATP is the primary energy source. Without sufficient iron less ATP can be produced which is another reason why these lacking iron are easily tired and fatigued. 7. Iron is necessary for immune cells proliferation and maturation, particularly lymphocytes which are associated with helping us to keep us to keep healthy. Lower level of iron may contribute to increased risk of our immune system being compromised and our body falling sick. 8. Iron play an important role in maintaining normal cognitive function includes brain function such as memory, attention (concentration), alertness, learning, intelligence, language and problem solving. Maintaining sufficient level of iron in our bodies help us to ensure our brain is performing its best any mental work having to rely on that shot of caffeine in the morning.
As our body don't produce iron we need to make sure we include sufficient iron as part of our healthy diets. Some people lifestyles can mean that they struggle to get iron they need from their diet alone.
Iron is not actively excreted from our body in urine or intestines.
Iron is only lost with cells from skin and interior surface of body intestine, urinary track and air ways. The total amount is estimated at lost 14 µg per kilogram body weight per day (Green R. 1968) [10] . In children probably more correct to relate these losses to body surface. Out of four small millets, little millet (3.11 mg/100 g of rice) recorded highest iron content followed by proso millet (2.17 mg/100 g of rice) and finger millet (2.17 mg/100 g of rice) and foxtail millet (1.947 mg/100 g of rice). Himansu et al (2018) [5] reported 3.9-7.5 mg/100 g of finger millet grain, 3.26 -19 mg/100g of foxtail millet rice, 13-20 mg/100 g of little millet rice, 4.0 -5.2 mg/100 g of proso millet rice. Sujata Bhat et al (2018) [2] found 3.9 mg/100 g of iron in finger millet grain. Similar results were observed by Murgan and Nirmalkumari (2006) [1] iron rich in foxtail millet grain (2.8 mg/100 g grain).
Manganese (Mn) is an essential nutrient for intercellular activities; it functions as co factor for a variety of enzymes, including organase, glutamine synthetase (GS), Pyruate carboxylase and Mn superoxide dismutase (Mn-SOD). Through this metallo protein, Mn plays critically important role in development, digestion, reproduction, immune response and regulation of neuronal activities. Generally, Mn deficiency is rare contrast Mn poisoning may be encountered upon over exposure to this mental. Excessive Mn tends to accumulate in liver pancrease, bone, kidneys, and brain with the latter being the major torget of Mn intoxication. Hapatic cirrhosis, polyethemia, hyper manganesemia, dystonia and Parkinsonism like symptoms have been reported in patients with Mn poisoning. In recent years Mn has come to forefront of environmental concerns due to its neurotoxicity. and Dharwad (0.396 mg/100 g of rice). The manganese present in grains not agreed with soil manganese in different locations.
The foxtail millet land race, Halnavani recorded maximum manganese at Dharwad (0.805 mg/100 g of rice) but it noticed lower level at Hanumanamatti (0.445 mg/100 g of rice) and Mudhol (0.434 mg/100 g of rice). These results were not holds good with soil manganese in different locations. Little millet land race, Karisavi recorded maximum manganese content at Hanumanamatti (0.475 mg/100 g of rice) and Mudhol (0.407 mg/100 g) but it produced lower level of manganese at Dharwad (0.107 mg/100 g of rice) and these manganese content not accordance with soil manganese. Another little millet land race Mallesavi exhibited highest manganese at Mudhol (0.385 mg/100 g of rice) followed by Hanumanamatti (0.32 mg/100 g of rice),) and Dharwad (0.26 mg/100 g of rice). These observations complete agreed with soil manganese content in different locations. DHLM-36-3produced highest manganese at Mudhol (0.434mg/100 g rice) followed by Hanumanamatti (0.327 mg/100 g of rice) and Dharwad (0.137 mg /100 g of rice). These results were complete contrast to soil manganese content in different locations. Finger millet variety, DHFM78-3 recorded higher manganese content at Hanumanamatti (0.931 mg/100 g of rice) and Dharwad (0.917 mg/100 g of rice) but it recorded lower level of manganese at Mudhol (0.108 mg/100 g of rice). These results were holds good with soil Mn in different locations The proso millet genotypes, DHPM-2769 and DHPM-2181 produced lower level of manganese (0.107 and 0.187 mg/100 g of rice, respectively) at Hanumanamatti, 0.102 and 0.185 mg/100 g of rice at Mudhol and 0.17 and 0.366 mg/100 g of rice at Dharwad. The results clearly stated that genotype, and soil, environment play big role in production of manganese content in foxtail millet, little millet and finger millet but soil and environment was very less influence on proso millet genotypes.
The manganese content of different small millets in different locations was estimated and data were depicted in table 5. Look into different small millet crops, Finger millet genotype, DHFM-78-3 (0.652 mg/100 g of rice) produced highest manganese followed by foxtail millet (0.55 mg/100 g of rice) and little millet (0.321 mg/100 g of rice) and least manganese found in proso millet (0.141 mg/100 g of rice). Small millets produced manganese content optimum level according to human requirement (1.8-2.3 mg/day /person). Himanusu et al (2018) [5] observed 5-5. [5] reported 2-2.3 mg/100 g, 2.14-9 mg/100 g,3.5-11 mg/100 g and 1.4-2.4 mg/100 g of zinc content in finger millet grain, foxtail millet, little millet and proso millet rice, respectively.
| Sl. No. | Name of crop | Name of variety | Mn (mg/100) | — | — | Copper (mg/100) | — | — |
|---|---|---|---|---|---|---|---|---|
| Hanumanamatti | Mudhol | Dharwad | Hanumanamatti | Mudhol | Dharwad | |||
| 1 | Foxtail millet | DHFT-109-3 | 0.924±0.007 | 0.38±0.006 | 0.396±0.008 | 0.477±0.009 | 0.415±0.01 | 0.867±0.013 |
| 2 | Foxtail millet | Halnavani | 0.44575±0.007 | 0.346±0.006 | 0.805±0.008 | 0.802±0.009 | 0.406±0.01 | 0.383±0.13 |
| 3 | Little millet | DHLM-36-3 | 0.327±0.007 | 0.434±0.006 | 0.137±0.008 | 0.207±0.009 | 0.934±0.01 | 0.357±0.013 |
| 4 | Little millet | Karisavi | 0.475±0.007 | 0.407±0.006 | 0.147±0.008 | 0.428±0.009 | 0.881±0.01 | 0.302±0.013 |
| 5 | Little millet | Mallesavi | 0.320±0.007 | 0.385±0.006 | 0.26±0.008 | 0.663±0.009 | 0.841±0.01 | 0.472±0.013 |
| 6 | Finger millet | DHFM-78-3 | 0.931±0.007 | 0.108±0.006 | 0.917±0.008 | 0.863±0.009 | 0.834±0.01 | 0.706±0.013 |
| 7 | Proso millet | DHPM-2769 | 0.107±0.007 | 0.102±0.006 | 0.0962±0.008 | 0.690±0.009 | 0.617±0.01 | 0.611±0.013 |
| 8 | Proso millet | DHPM-2181 | 0.187±0.007 | 0.185±0.006 | 0.17±0.008 | 0.585±0.009 | 0.571±0.01 | 0.567±0.013 |
| Grand mean | 0.46±0.007 | 0.29±0.006 | 0.366±0.008 | 0.580±0.009 | 0.68±0.01 | 0.53±0.013 | ||
| Sem+/- | 0.007 | 0.007 | 0.009 | 0.009 | 0.010 | 0.013 | ||
| CD@1% | 0.032 | 0.029 | 0.037 | 0.009 | 0.044 | 0.054 | ||
| CV% | 3.330 | 4.750 | 4.882 | 3.240 | 3.130 | 4.813 |
Table text extracted from the original PDF; superscript letters are shown inline. The original table image is below.
View original table image
Copper
Copper is also vital dietary nutrient, although only small amounts of the metal are needed for wellbeing (5). Although copper is the body (behind iron and zinc), the total amount of copper in the body is only 75-100 mili gram (6)Copper is present in every tissue of the body but it stored primarily in liver with fewer amounts found in the brain, heart, kidney and muscles. Copper plays an important role in our metabolism, largely because it allows many critical enzymes to function properly. Copper is an essential for maintaining strength of the skin, blood vessels, epithelial and connective tissues through body. Copper plays role in the production of haemoglobin, mylin, melanin and it also keep the thyroid gland functioning normally. Copper can be act as antioxidant and pro antioxidant.
Copper metabolism: copper is absorbed in the gut and transported to the liver bound to albumin. It enters the blood streams via plam protein called ceruloplasmin where its metabolism is controlled and is excreted in bile.
Copper enzymes:
Copper protein have diverse roles in biological electron transport and oxygen transportation process that exploit the easy inter conversion of Cu (I) and Cu (II) (55).
In cytochrome copper oxidase which is required for aerobic respiration, copper and iron cooperate in the reduction of oxygen. Copper is also found Cu/Zn super oxide dismutase is an enzyme that detoxify super oxides by converting it to oxygen and hydrogen peroxide 2H2O--→ H2O2+O2 (7, 55). Copper is also component of lysyl oxidase an enzyme that participates in the synthesis of collegen and elastin, two important structural proteins found in bone and connective tissue. As part of the enzyme cytochrome C oxidase. Copper play a role in energy production as part dopamine β hydroxyylase a role in conversion of dopamine to norepine phrine and with factor IV helps in blood clotting. Copper is also important for production of the thyroid hormone thyroxine. The copper containing enzyme tyrosinase converts tyrosine to melinine. Cu is also necessary for the synthesis of phospholipids found in myelin sneaths in pheripheral nerves. Several Cu protein don't interact directly with substances, hence they are not enzymes. These proteins relay electrons by the process called electron transfer. These all studies clearly indicated and need to investigate copper quantity in different small millet in different locations. The study conducted at Hanumanamatti, Dharwad and Mudhol and results were elaborated in Table1, 2, 3, 4 and 5.
| SL. No. | Name of crop | Name of variety | Protein (%) | Iron (mg/100g) | Manganese (mg/100) | Copper (mg/100 g) | Zinc (mg/100 g) |
|---|---|---|---|---|---|---|---|
| 1 | Foxtail millet | DHFT-1093 | 11.025±0.133 | 1.985±0.068 | 0.924±0.007 | 0.477±0.009 | 0.68±0.019 |
| 2 | Foxtail millet | Halnavani | 11.025±0.133 | 2.023±0.068 | 0.44575±0.007 | 0.802±0.009 | 0.605±0.019 |
| 3 | Little millet | DHLM-36-3 | 8.3±0.133 | 3.849±0.068 | 0.327±0.007 | 0.207±0.009 | 0.417±0.019 |
| 4 | Little millet | Karisavi | 9.425±0.133 | 3.340±0.068 | 0.745±0.007 | 0.428±0.009 | 0.535± |
| 5 | Little millet | Mallisavi | 9.1±0.133 | 5.686±0.068 | 0.320±0.007 | 0.663±0.009 | 0.364±0.019 |
| 6 | Finger millet | DHFM-78-3 | 8.9±0.133 | 2.776±0.068 | 0.931±0.007 | 0.836±0.009 | 1.882±-0.019 |
| 7 | Proso millet | DHPM-2769 | 11±0.133 | 2.32±0.068 | 0.107±0.007 | 0.690±0.009 | 1.377±0.019 |
| 8 | Proso millet | DHPM-2181 | 11.975±0.133 | 2.4±0.068 | 0.187±0.007 | 0.585±0.009 | 1.293±0.019 |
| Grand mean | 10.09±133 | 3.0±068 | 0.46±0.007 | 0.580±0.009 | 0.89±0.019 | ||
| Sem +/- | 0.133 | 0.068 | 0.007 | 0.009 | 0.019 | ||
| CD@1% | 0.552 | 0.268 | 0.032 | 0.039 | 0.079 | ||
| CV% | 2.640 | 4.500 | 3.330 | 3.240 | 4.234 |
Table text extracted from the original PDF; superscript letters are shown inline. The original table image is below.
View original table image
The copper content of different small millet at Hanumanamatti was estimated and elaborated in table 1. The foxtail millet land race Halnavani (0.802 mg/100 g of rice), little millet land race, Mallesavi (0.663 mg/100 g of rice), finger millet variety DHFM-78-3 (0.836 mg/100 g of grain) and proso millet variety, DHPM-2769 (0.69 mg/ 100 g of rice) were recorded statistically superior over grand mean (0.58 mg /100 g of rice) for copper content. At Dharwad Foxtail millet genotype DHFt-109-3 (0.867 mg/100 g of rice), finger millet genotype, DHFM-78-3 (0.706 mg/100 g of grain) and proso millet genotype DHPM-2769 (0.611 mg/ 100 g of rice) produced copper content more than grand mean (0.53 mg/100 g of rice) and results has been briefed in table 2. The copper content of different small millets at Mudhol has been presented in table 3. The little millet variety, DHLM-36-3 (0.934 mg/ 100 g of rice) recorded highest copper content followed by land races Karisavi (0.881 mg/ 100 g of rice), Mallesavi ((0.841 mg/100 g of rice) and finger millet genotype, DHFM-78-3 (0.834 mg/100 g of grain) were exhibited statistically superior over grand mean (0.68 mg/100 g of rice). The copper content varies from genotype to genotype and location to location and results have been presented in Table 4.
| Sl. No. | Name of crop | Name of variety | Protein (%) | — | — | — | Iron (mg/100g of rice /grains) | — | — |
|---|---|---|---|---|---|---|---|---|---|
| Hanumanamatti | Mudhol | Dharwad | Hanumanamatti | Mudhol | Dharwad | ||||
| 1 | Foxtail millet | DHFT-109-3 | 11.025±0.133 | 10.74±0.131 | 11.9±0.108 | 11.22% | 1.985±0.068 | 1.865±0.05 | 2.012±0.035 |
| 2 | Foxtail millet | Halnavani | 11.025±0.133 | 10.1±0.033 | 10.265±108 | 10.46% | 2.023±0.068 | 1.77±0.05 | 2.030±0.035 |
| 3 | Little millet | DHML-36-3 | 8.3±0.133 | 7.505±0.033 | 8.172±0.108 | 7.99% | 3.84±0.068 | 3.925±0.05 | 2.365±0.035 |
| 4 | Little millet | Karisavi | 9.425±0.133 | 7.05±0.033 | 8.612±0.108 | 8.36% | 3.340±0.068 | 3.123±0.05 | 1.437±0.035 |
| 5 | Little millet | Mallisavi | 9.1±0.133 | 7.827±0.033 | 8.212±0.108 | 8.37 | 5.686±0.068 | 2.05±0.05 | 2.25±0.035 |
| 6 | Finger millet | DHFM-78-3 | 8.9±0.133 | 7.44±0.033 | 7.082±0.108 | 7.81 | 2.776±0.068 | 1.862±0.05 | 1.9±0.035 |
| 7 | Proso millet | DHPM-2769 | 11±0.133 | 9.665±0.033 | 10.350±0.108 | 10.34 | 2.32±0.068 | 2.12±0.05 | 2.312±0.035 |
| 8 | Proso millet | DHPM-2181 | 11.975±0.133 | 10.337±0.033 | 11.600±0.108 | 11.30 | 2.4±0.068 | 1.915±0.05 | 1.953±0.035 |
| Grand mean | 10.09±0.133 | 8.44±0.033 | 9.52±0.068 | 3.04±0.068 | 2.02±0.05 | 2.032±s0.035 | |||
| Sem+/- | 0.133 | 0.131 | 0.109 | 0.068 | 0.050 | 0.035 | |||
| CD@+/- | 0.552 | 0.546 | 0.454 | 0.286 | 0.210 | 0.149 | |||
| CV% | 2.640 | 3.103 | 2.289 | 4.5 | 4.323 | 3.5 |
Table text extracted from the original PDF; superscript letters are shown inline. The original table image is below.
View original table image
| SL. No | . Name of crop | Name of variety | Protein (%) | Iron(mg/100g) | Manganese (mg/100) | Copper (mg/100 g) | Zinc (mg/100 g) |
|---|---|---|---|---|---|---|---|
| 1 | Foxtail millet | DHFT-109-3 | 10.74±0.131 | 2.012±0.035 | 0.38±0.006 | 0.415±0.01 | 0.62±0.01 |
| 2 | Foxtail millet | Halnavani | 10.1±0.033 | 2.030±0.035 | 0.346±0.006 | 0.406±0.01 | 0.61±0.01 |
| 3 | Little millet | DHLM-36-3 | 7.505±0.033 | 2.365±0.035 | 0.434±0.006 | 0.934±0.01 | 0.505±0.01 |
| 4 | Little millet | Karisavi | 7.05±0.033 | 1.437±0.035 | 0.407±006 | 0.881±0.01 | 0.487±0.01 |
| 5 | Little millet | Mallisavi | 7.827±0.033 | 2.25±0.035 | 0.385±0.006 | 0.841±0.01 | 0.420±0.01 |
| 6 | Finger millet | DHFM-78-3 | 7.44±0.033 | 1.9±0.035 | 0.108±0.006 | 0.834±0.01 | 0.416±0.01 |
| 7 | Proso millet | DHPM2769 | 9.665±0.033 | 2.312±0.035 | 0.102±0.006 | 0.617±0.01 | 1.262±0.01 |
| 8 | Proso millet | DHPM-2181 | 10.337±0.033 | 1.953±0.035 | 0.185±0.006 | 0.517±0.01 | 1.217±0.01 |
| Grand Mean | 8.44±0.033 | 2.032 | 0.29±0.006 | 0.68±0.01 | 0.69±s0.01 | ||
| Sem+/- | 0.131 | 0.035 | 0.0069 | 0.01 | 0.01 | ||
| CD@1% | 0.546 | 0.149 | 0.026 | 0.044 | 0.041 | ||
| CV% | 3.102990966 | 3.5 | 4.75 | 3.13 | 2.89 |
Table text extracted from the original PDF; superscript letters are shown inline. The original table image is below.
View original table image
| SL. No. | Name of crop | Name of variety | Protein (%) | Iron (mg/100g) | Manganese (mg/100) | Copper (mg/100 g) | Zinc (mg/100 g) |
|---|---|---|---|---|---|---|---|
| 1 | Foxtail millet | DHFT-109-3 | 11.9±0.108 | 1.865±0.05 | 0.396±0.008 | 0.867±0.013 | 0.692±0.033 |
| 2 | Foxtail millet | Halnavani | 10.265±0.108 | 1.77±0.05 | 0.805±0.008 | 0.383±0.013 | 0.642±0.033 |
| 3 | Little millet | DHLM-36-3 | 8.172±0.108 | 3.925±0.05 | 0.1370±0.008 | 0.357±0.013 | 0.358±0.033 |
| 4 | Little millet | Karisavi | 8.612±0.108 | 3.132±-0.05 | 0.147±0.008 | 0.302±0.013 | 0.43±0.033 |
| 5 | Little millet | Mallisavi | 8.212±0.108 | 2.05±0.05 | 0.026±0.008 | 0.472±0.013 | 0.405±0.033 |
| 6 | Finger millet | DHFM-78-3 | 7.082±0.108 | 1.862±0.05 | 0.917±0.008 | 0.706±0.013 | 0.397±0.033 |
| 7 | Proso millet | DHPM-2769 | 10.350±0.108 | 2.12±0.05 | 0.0962±0.008 | 0.611±0.013 | 1.212±0.033 |
| 8 | Proso millet | DHPM-2181 | 11.600±0.108 | 1.915±0.05 | 0.17±0.008 | 0.567±0.013 | 1.2±0.033 |
| Grand mean | 9.52±0.068 | 2.33±0.05 | 0.366±0.008 | 0.53±s0.013 | 0.66±0.033 | ||
| Sem+/- | 0.109 | 0.050 | 0.009 | 0.013 | 0.033 | ||
| CD@1% | 0.454 | 0.210 | 0.037 | 0.054 | 0.139 | ||
| CV% | 2.289 | 4.323 | 4.882 | 4.813 | 10.016 |
Table text extracted from the original PDF; superscript letters are shown inline. The original table image is below.
View original table image
The foxtail millet variety DHFt-109-3 recorded maximum copper content at Dharwad (0.867 mg/100 g of rice), followed by Hanumanamatti (0.477 mg/100 g of rice) and Mudhol (0.415 mg/100 g of rice) but land race Halnavani produced highest copper at Hanumanamatti (0.802 mg/100 g of rice) followed by Mudhol (0.406 mg/100 g of rice) and Dharwad (0.383 mg/100 g of rice). These results were not proportion to soil copper content at different locations (Hanumanamatti: 0.48 ppm, Dharwad: 1.75 and 3.57 ppm). The little millet variety, DHLM-36-3 produced maximum copper content at Mudhol (0.934 mg/100 g of rice) followed by Dharwad (0.357 mg/100 g of rice) and Hanumanamatti (0.207 mg/100 g of rice). The copper content of soil also similar pattern as found in grains / rice at Mudhol (3.57 ppm), Dharwad (1.75 ppm) and Hanumanamatt (0.48 ppm). The little millet land races Karisavi and Mallesavi (0.881 and 0.841 mg/100 g of rice) recorded highest copper content at Mudhol followed by Hanumanamatti (0.428 and 0.663 mg/100 g of rice) and Dharwad (0.302 and 0.472 mg/100 g of rice), respectively. These were not holds good with soil copper content. The finger millet genotype DHFM-78-3 (approximately 0.8 mg/100 g of rice) and proso millet genotypes, DHPM-2769 (approximately (0.69 mg/100 g of rice) and DHPM -2181 (0.56 mg/100 g of rice) exhibited copper content more or less similar across the locations (Hanumanamatti, Dharwad and Mudhol). These results were not similar with soil copper content at different locations.
The copper content in different crops in different locations has estimated and briefed in table 5. The DHFM-78-3 produced highest copper content of 0.79 mg/100 g of grain followed by proso millet rice of 0.67 mg/100 g of rice, little millet of 0.57 mg/ 100 g of rice and foxtail millet of 0.56 mg/ 100 g of rice.
Himanshu, et al (2018) [5] observed 0.4-4 mg/100 g, 1-3.0 mg/100 g, 1.0-4.0 mg/100 g and 0.83-5.8 mg/100g of copper content in finger millet grain, foxtail millet, little millet and proso millet rice, respectively.
difference for iron content among genotypes in different small millets at Hanumanamatti, Dharwad and Mudhol, respectively. The little millet land race Mallesavi produced highest iron content at Hanumanamatti (5.686 mg / 100 g of rice) followed by Dharwad (2.25 mg/100 g of rice) and Mudhol (2.05 mg /100 g of rice). These results were accorded with soil iron content at Hanumanamatti (21.08 ppm), Dharwad soil (4.25 ppm) and Mudhol soil (3.82 ppm) but these were not exact proportion. The land race Karisavi and improved variety DHLM-36-3 exhibited maximum iron content at Hanumanmatti (3.34 and 3.849 mg/100 g of rice) followed by Mudhol (3.13 and 3.925 mg / 100 g of rice) and Dharwad (1.437 and 2.365 mg/100 g of rice), respectively. These results were not agreed with soil content of different locations. The finger millet improved variety DHFM-78-3 produced highest iron content at Hanumanamatti (2.776 mg/ 100 g of grains) followed by Dharwad (1.9 mg/100 g of grains) and Mudhol (1.86 mg /100 g of grains Out of four small millets, proso millet genotypes (1.26 mg/100 g of rice) produced highest zinc content followed by finger millet (0.89 mg / 100 g of grain) and foxtail millet (0.642 mg/100 g of rice) and lowest zinc content found in little millet (0.436 mg/100 g of rice). The finger millet genotype, DHFM-78-3 produced higher zinc content at Hanumanamatti (1.882 mg/100 g of grain) while, lower levels of zinc values at Mudhol (0.416 mg/ 100 g of grain) and Dharwad (0.397 mg/100 g of grain). The proso millet produced higher values of zinc content across the locations and foxtail and little and proso millet produced more or less similar zinc values across the locations. Himanshu et al. (2018) [5] reported 2-2.3 mg/100 g, 2.14-9 mg/100 g,3.
Figures and tables from the paper
| Sl. No. | Name of crop | Name of variety | Zn(mg/100) | — | — |
|---|---|---|---|---|---|
| Hanumanamatti | Mudhol | Dharwad | |||
| 1 | Foxtail millet | DHFT-109-3 | 0.68±0.019 | 0.62±0.01 | 0.692±0.033 |
| 2 | Foxtail millet | Halnavani | 0.605±0.019 | 0.61±0.01 | 0.642±0.033 |
| 3 | Little millet | DHLM-36-3 | 0.417±0.019 | 0.505±0.01 | 0.358±0.033 |
| 4 | Little millet | Karisavi | 0.535±0.019 | 0.487±0.01 | 0.43±0.033 |
| 5 | Little millet | Mallisavi | 0.364±0.019 | 0.420±0.01 | 0.405±0.033 |
| 6 | Finger millet | DHFM-78-3 | 1.882±0.019 | 0.416±0.01 | 0.397±0.033 |
| 7 | Proso millet | DHPM-2769 | 1.337±0.019 | 1.262±0.01 | 1.212±0.033 |
| 8 | Proso millet | DHPM-2181 | 1.293±0.019 | 1.217±0.01 | 1.2±0.033 |
| Grand mean | 0.89±0.019 | 0.69±0.01 | 0.66±s0.033 | ||
| Sem+/- | 0.019 | 0.010 | 0.033 | ||
| CD@1% | 0.079 | 0.041 | 0.139 | ||
| CV% | 4.234 | 2.890 | 10.016 |
Table text extracted from the original PDF; superscript letters are shown inline. The original table image is below.
View original table image
| Name of variety | Protein% | — | — | — | — | Iron Mg/100 | — | — | — | — |
|---|---|---|---|---|---|---|---|---|---|---|
| Hanumanamatti | Mudhol | Dharwad | Average across location | Average crop wise | Hanumanamatti | Mudhol | Dharwad | Average across location | Average crop wise | |
| DHFT-109-3 | 11.03 | 10.74 | 11.90 | 11.22 | 10.84 | 1.99 | 1.87 | 2.01 | 1.95 | 1.95 |
| Halnavani | 11.02 | 10.10 | 10.27 | 10.46 | 2.02 | 1.77 | 2.03 | 1.94 | ||
| DHLM-36-3 | 8.30 | 7.51 | 8.17 | 7.99 | 8.24 | 3.85 | 3.93 | 2.37 | 3.38 | 3.11 |
| Karisavi | 9.43 | 7.05 | 8.61 | 8.36 | 3.34 | 3.13 | 1.44 | 2.64 | ||
| Mallisavi | 9.10 | 7.83 | 8.21 | 8.38 | 5.69 | 2.05 | 2.25 | 3.33 | ||
| DHFM-78-3 | 8.90 | 7.44 | 7.08 | 7.81 | 7.80 | 2.78 | 1.86 | 1.90 | 2.18 | 2.18 |
| DHPM-2769 | 11.00 | 9.67 | 10.35 | 10.34 | 10.82 | 2.32 | 2.12 | 2.31 | 2.25 | 2.17 |
| DHPM-2181 | 11.97 | 10.34 | 11.60 | 11.30 | 2.40 | 1.92 | 1.95 | 2.09 | ||
| Sem+/- | 0.133 | 0.131 | 0.109 | 0.068 | 0.040 | 0.035 | ||||
| CD @ 1% | 0.552 | 0.546 | 0.454 | 0.286 | 0.15 | 0.149 | ||||
| CV% | 2.640 | 3.103 | 2.289 | 4.5 | 3.54 | 3.5 |
Table text extracted from the original PDF; superscript letters are shown inline. The original table image is below.
View original table image
| Name of variety | Mn (mg/100g) | — | — | — | — | Copper Mg/100 | — | — | — | — |
|---|---|---|---|---|---|---|---|---|---|---|
| Hanumanamatti | Mudhol | Dharwad | Average across location | Average crop wise | Hanumanmatti | Mudhol | Dharwad | Average across location | Average crop wise | |
| DHFM-109-3 | 0.92 | 0.38 | 0.40 | 0.57 | 0.55 | 0.48 | 0.42 | 0.87 | 0.59 | 0.56 |
| Halnavani | 0.45 | 0.35 | 0.81 | 0.53 | 0.80 | 0.41 | 0.38 | 0.53 | ||
| DHLM-36-3 | 0.33 | 0.43 | 0.14 | 0.30 | 0.32 | 0.21 | 0.93 | 0.36 | 0.50 | 0.57 |
| Karisavi | 0.48 | 0.41 | 0.15 | 0.34 | 0.43 | 0.88 | 0.30 | 0.54 | ||
| Mallisavi | 0.32 | 0.39 | 0.26 | 0.32 | 0.66 | 0.84 | 0.47 | 0.66 | ||
| DJFM-78-3 | 0.93 | 0.11 | 0.92 | 0.65 | 0.65 | 0.84 | 0.83 | 0.71 | 0.79 | 0.79 |
| DHPM-2769 | 0.11 | 0.10 | 0.10 | 0.10 | 0.14 | 0.69 | 0.62 | 0.61 | 0.64 | 0.61 |
| DHPM-2181 | 0.19 | 0.19 | 0.17 | 0.18 | 0.59 | 0.57 | 0.57 | 0.57 | ||
| Sem+/- | 0.007 | 0.007 | 0.009 | 0.009 | 0.010 | 0.013 | ||||
| CD@1% | 0.032 | 0.029 | 0.037 | 0.039 | 0.044 | 0.054 | ||||
| CV% | 3.330 | 4.750 | 4.882 | 3.240 | 3.130 | 4.813 |
Table text extracted from the original PDF; superscript letters are shown inline. The original table image is below.
View original table image
| Name of variety | Zn(mg/100) | — | — | — | — |
|---|---|---|---|---|---|
| H anumanamatti | Mudhol | Dharwad | Average across location | Average crop wise | |
| DHFT-109-3 | 0.68 | 0.62 | 0.69 | 0.66 | 0.64 |
| Halnavani | 0.61 | 0.61 | 0.64 | 0.62 | |
| DHLM-36-3 | 0.42 | 0.51 | 0.36 | 0.43 | 0.44 |
| Karisavi | 0.54 | 0.49 | 0.43 | 0.48 | |
| Mallisavi | 0.36 | 0.42 | 0.41 | 0.40 | |
| DHFM-78-3 | 1.88 | 0.42 | 0.40 | 0.90 | 0.90 |
| DHPM-2769 | 1.38 | 1.26 | 1.21 | 1.28 | 1.26 |
| DHPM-2181 | 1.29 | 1.22 | 1.20 | 1.24 | |
| Sem+/- | 0.019 | 0.010 | 0.033 | ||
| CD@1% | 0.079 | 0.041 | 0.139 | ||
| CV% | 4.243 | 2.890 | 10.016 |
Table text extracted from the original PDF; superscript letters are shown inline. The original table image is below.
View original table image
| Village Name | N | Iron (ppm) | Zn (ppm) | Mn (ppm) | Copper(ppm) |
|---|---|---|---|---|---|
| Mudhol | 109 | 3.82 | 0.29 | 2.04 | 3.57 |
| Dharwad | 139 | 4.25 | 0.93 | 4.51 | 1.75 |
| Hanamanamatti | 245 | 21.08 | 1.30 | 3.21 | 0.48 |
Table text extracted from the original PDF; superscript letters are shown inline. The original table image is below.
View original table image
References
9 in the original paper- Murugan R, Nirmalkumari A. Genetic divergence in foxtail millet (Setaria italic) Indian Journal of Genetics. 2006;66(4);339-340.
- Bhat SC, Nandini V, Tippeswamy, Prabhakar. Significance ofsmall milletin nutrition and health -Areview Asian Journal of Dairy and food Research. 2018;37(1);35-40.
- Sarita, Singh E. Potrentials of millets: Nutrients Composition and Health Benfits Journal of Scientific and Innovative Research. 2016;5(2):46-50.
- Qaisrani SNS, Murtaza AH, Khan F, Bibi SMJ, Iqbal F, Azam I, et al. Variability in Millet: Factors Influencing Its Nutritional Profile and Zootechnical in Poultry Journal of Applied and Poultry research. 2019;28(2):242-252.
- Himanshu, Chauhan M, Sachin K, Sonawane SS, Arya. Nutritional and Nutaceutical Properties of Millets: A Review Clinical Journal of Nutrition and Dietetics. 2018;1(1):1-10.
- Conard ME, Umbreit JN. Disorder iron metabolism" The New England Journal of Medicine. 2000;342(17):1293-4. DIO: 10.1056/NEJM
- Keen CL, Ensunsa JL, Watson MH. Nutrion effects of manganese from experimental studies. Nuerotoxicology. 1999;2(3):213-223.
- Scheiber, Ivo, Dringen, Ratt, Mercer, Julian FB. Copper effect of Deficiency and over load (Interrelation between essential ions in life Science: 13 Sprinnger. 2013, 359-87
- Green R, Charlton R, Seftel H, Bothwell T, Mayet F, Adams B, et al. Body iron excretion in man: A collaborative study. The American journal of medicine. 1968;45(3):33653.