
Research article · 2024 · Full text
International Journal of Agriculture Extension and Social DevelopmentStudents perceptions towards teaching faculty of agriculture: The case study of university of agriculture sciences, Raichur, Karnataka
Volume 7(1) · Pages 144–147 · DOI: 10.33545/26180723.2024.v7.i1b.202 ↗
Research areasLivestock Management and Performance ImprovementAgricultural Economics and Practices
Abstract
Author-writtenThis study was conducted to determine student’s perception towards the teaching faculty of agriculture and college administration by using random sampling method. The study was conducted at the Agricultural College, Raichur during the academic year 2017-2018. This research was conducted with 50 students by using questionnaire. The study revealed that the majority (66.00%) of the students had a rural background, 48.00 per cent of the fathers of respondents were engaged in farming, 66 per cent of the students were studied in state language, 66 per cent of the students obtained a ‘second class’ followed by 32.00 per cent achieved ‘first class’. With regard to overall perception of students towards teaching faculty, 64.00 per cent of the students perceived that teachers were good at teaching qualities and skills, Whereas 20.00 per cent of them perceived teachers had poor teaching qualities. With respect to student’s perception about college administration indicated that, 56.00 per cent of the student were fully satisfied with the measures taken to eradicate ragging followed by ban on cigarette, liquor and other items in college premises (38%), auditorium – access and maintenance (32%) and admission procedure (30%).
Summary
Source-checkedPlain-language reading of the full paper, prepared with AI and checked against the text. Each point links to the authors' own words.
Why it matters
- Agriculture is a critical component of the Indian economy, contributing 28.00% to the national income and employing 62% of the rural population. View evidence ↗
- Evaluating how students perceive their teachers in higher education is considered essential for both the students and the university's administration. View evidence ↗
The question
- The study aimed to determine the perceptions of students regarding the teaching faculty at the University of Agricultural Sciences in Raichur. View evidence ↗
What they did
- Data was collected via a pre-tested questionnaire using a five-point Likert scale (Excellent to Very Poor, weighted 5 to 1) to measure perceptions of faculty and administration. View evidence ↗
What they found
- Among the participants, 66.00% (33 students) were from rural backgrounds. View evidence ↗
- The majority of students (66.00%) achieved a 'second class' CGPA (6-7.99), while 32.00% achieved 'first class' and 2.00% achieved 'distinction'. View evidence ↗
- Regarding overall faculty perception, 64.00% of students rated teaching qualities and skills as 'Good', while 20.00% rated them as 'Poor' and 16.00% as 'Average'. View evidence ↗
- The highest rating for 'Excellent' was given to the faculty's ability to conduct examinations and evaluations, perceived as such by 62.00% of students. View evidence ↗
- The highest level of administrative satisfaction was for measures taken to eradicate ragging, with 56.00% of students being 'Fully Satisfied'. View evidence ↗
What it means
- The authors conclude that the teaching faculty are generally perceived as good in terms of their skills, behavior, and teaching qualities. View evidence ↗
- The authors recommend that educational institutions focus on quality teaching and foster collaboration between teachers and students to improve education. View evidence ↗
Visual summary
2 visualsIllustrations explain the paper; charts are replotted from the paper's own table values.
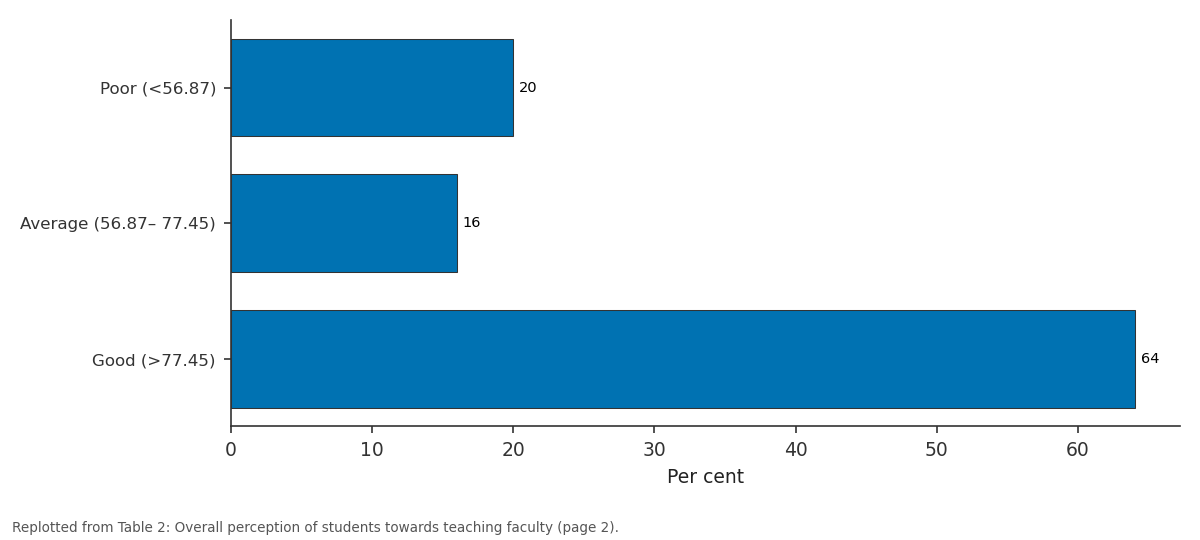
Per cent: Poor (<56.87) vs Average (56.87– 77.45) vs Good (>77.45)
Replotted from Table 2 (page 2) of the original paper. Every bar is the paper's own table value.
View source evidence ↗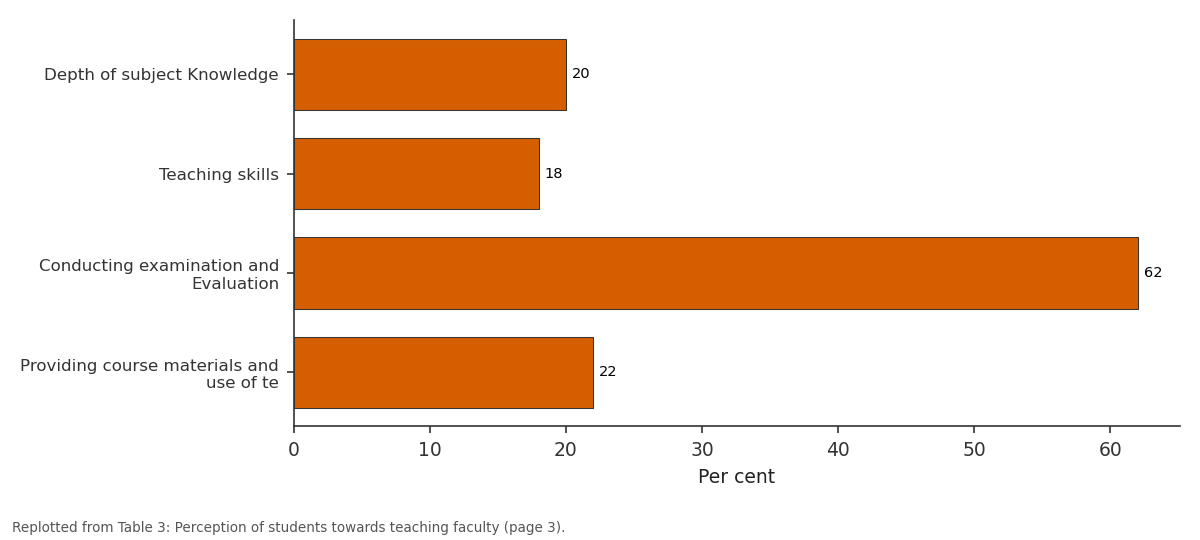
%: Depth of subject... vs Teaching skills vs Conducting examination... vs Providing course...
Replotted from Table 3 (page 3) of the original paper. Every bar is the paper's own table value.
View source evidence ↗Figures & tables
From the original paper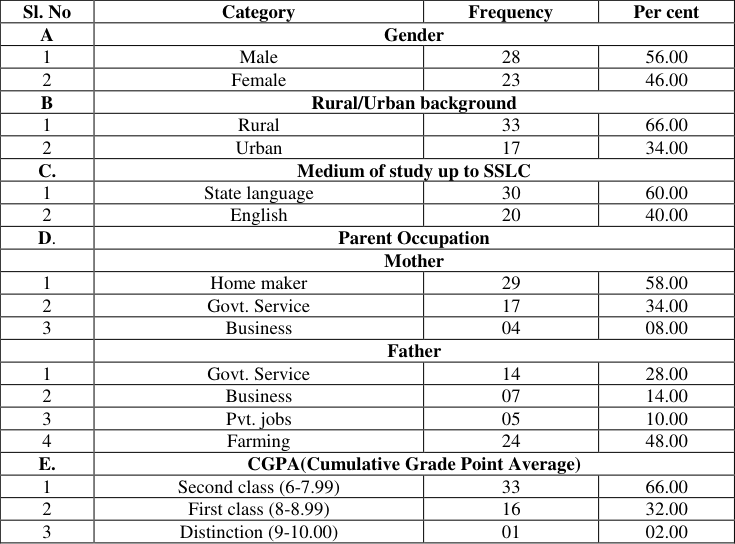 Table 1
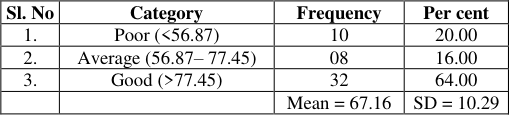 Table 2
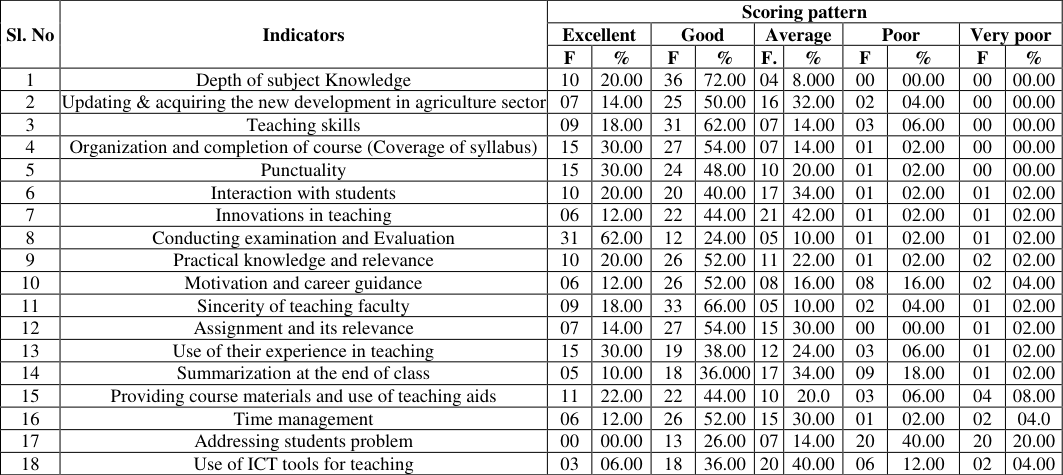 Table 3
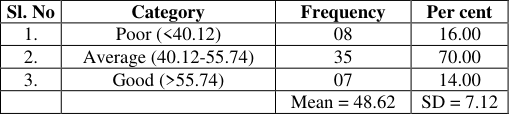 Table 4
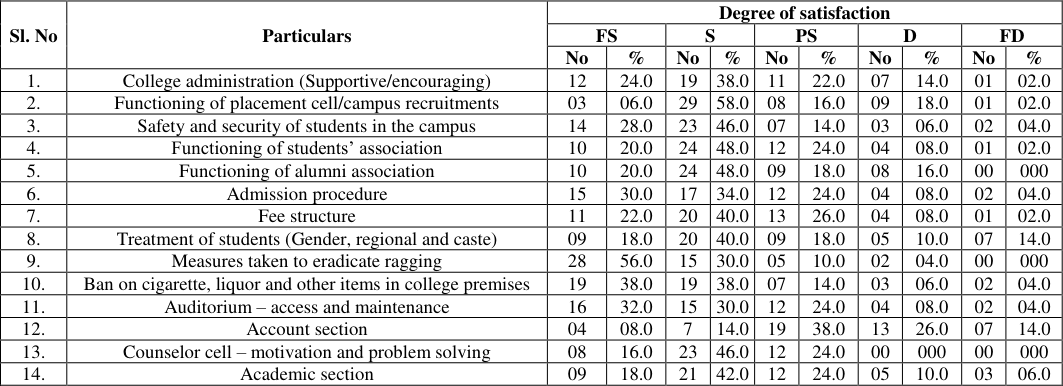 Table 5
Introduction
India is an agrarian country and the majority of the population lives in villages. The agriculture sector remains a major factor in contributing to the Indian economy. In India, agriculture plays an important role in national income (28.00%), source of food security, the supply of raw material for many agro-based industries and provides employment of 62% of rural people. Overall we can say that the agriculture sector contributes towards the overall development of the nation. The country has several achievements such as the green revolution, white revolution, blue revolution and many more. Apart from these agricultural developments, several agricultural universities were established to cater the educational needs in agricultural and allied sectors, accordingly, several agricultural colleges were also established to provide the agricultural education in various subjects such as agriculture, horticulture, fisheries, animal sciences, etc. the degrees offered by these colleges are now professional degrees in India (Laxman, et al., 2020) [3] . Agricultural education system is expected to generate benefits to various segments of society in terms of expanding the frontiers of knowledge as well as contributing to the socio-economic development of nation. Education is an important thing in human life, which is one of the basic human needs that must be fulfilled so that humans can behave in accordance with the norms and rules that have been established with their own awareness without any element of compulsion. Whether or not the success of learning goals depends on how is the learning process. The teaching and learning process is basically a pattern of mutual support between teachers and students. In the learning process, the teacher is expected to be able to create learning conditions that can lead students to active learning situations, including active physical and mental activities, as well as individuals and groups (Slameto, 2010: 2) [4] . Students measure their teachers on their communication skills, the way of teaching and the contents of a subject. Research of (Etuk, et al., 2013) [1] shows that, students 'perceptions of their teacher's mathematical knowledge, communication skills, use of appropriate teaching strategies and teacher's ability to organize classes have a significant relationship with students' attitudes toward mathematics. Assessment of students' perceptions towards teachers in higher education is very important for both students and the university administration. The purpose of the study was to determine the perceptions of students at the Faculty of Agriculture at University of Agricultural Sciences, Raichur. There were no studies relating to the perceptions of students in the Faculties of Agriculture. That's why this study is www.extensionjournal.com extremely important. The results of this study will provide useful information for the university administration and academic staff.
Methodology
The study was conducted in the University of Agricultural Sciences, Raichur during the academic year 2016-2017. Fifty students of final B.Sc (Agri.) were selected by random sampling method. The data was collected from the students by using the well-constructed questionnaire. Questionnaire was prepared with the help of concerned experts and was pre-tested. The collected data then scored analyzed and interpreted. The personal and socioeconomic status of the students analyzed was by using frequency and percentages to get a meaningful understanding. Whereas, students' perception towards teaching facult and college administration was studied by using the Likert type scale in which the responses of students were calculated on a five point quantum scale as Excellent, Good, Average, Poor and Very Poor with the weightage of 5, 4, 3, 2 and 1 respectively.
Results and Discussion
The results are presented with various heads such as personal characteristics of the students, student's perception towards the teaching faculty, Student's perception towards the college administration and conclusion.
Personal characteristics of the students
Personal characteristics of the students such as gender, education, rural/urban background, parent's occupation and CGPA were studied and results were depicted in Table 1. The results depicted in Table1, indicated that around 56.00 per cent of the respondents were female and it implies that agricultural education is getting popular among girl students. It was observed from the rural/urban background of the respondents that the majority (66.00%) of the students were from rural areas followed by 44.00 percent of the respondents represented urban background. With respect to medium of study, up to10 th standard, 66 per cent of the students were studied in state language and 40.00 per cent of them studied in English language. Regarding parents' occupation majority (48.00%) of the fathers of respondents were engaged in farming followed by 28.00 per cent of fathers of the respondents are in government sector, whereas, the majority (58.00%) of mothers of respondents are homemakers followed by 34.00 per cent of mothers are working in the government sector. Regarding CGPA of UG students, 66.00 per cent of the students obtained a 'second class' followed by 32.00 per cent and achieved 'first class' and only 2.00 per cent have achieved 'distinction (Table 1). (Govindagowda, et al., 2012) [2] .
| Sl. No | Category | Frequency | Per cent |
|---|---|---|---|
| A | Gender | ||
| 1 | Male | 28 | 56.00 |
| 2 | Female | 23 | 46.00 |
| B | Rural/Urban background | ||
| 1 | Rural | 33 | 66.00 |
| 2 | Urban | 17 | 34.00 |
| C. | Medium of study up to SSLC | ||
| 1 | State language | 30 | 60.00 |
| 2 | English | 20 | 40.00 |
| D. | Parent Occupation | ||
| Mother | |||
| 1 | Home maker | 29 | 58.00 |
| 2 | Govt. Service | 17 | 34.00 |
| 3 | Business | 04 | 08.00 |
| Father | |||
| 1 | Govt. Service | 14 | 28.00 |
| 2 | Business | 07 | 14.00 |
| 3 | Pvt. jobs | 05 | 10.00 |
| 4 | Farming | 24 | 48.00 |
| E. | CGPA(Cumulative Grade Point Average) | ||
| 1 | Second class (6-7.99) | 33 | 66.00 |
| 2 | First class (8-8.99) | 16 | 32.00 |
| 3 | Distinction (9-10.00) | 01 | 02.00 |
Table text extracted from the original PDF; superscript letters are shown inline. The original table image is below.
View original table image
Perception of students towards teaching faculty
The data with regard to perception of students towards teaching faculty are presented in Table 3. It is noticed from Table 3 that, majority (62.00%) of the students perceived teaching faculty were excellent at conducting examination and evaluation, whereas, 30.00 per cent of the student perceived teaching faculty were excellent at "punctuality, "organization and completion of course (coverage of syllabus)", "use of their experience in teaching", "providing course materials and use of teaching aids" (30.00%) and 20.00 per cent perceived teachers were excellent at interaction with students and depth of subject knowledge equally (Table 3). Seventy two per cent of the students perceived teaching faculty were good at deep knowledge in the subject followed by sincerity (66.00%), teaching skills (62.00%), relevance of the assignment given to them (62.00%), organization and completion of course (coverage of syllabus) (54.00%), practical knowledge of teachers and relevance of the courses taught to them, time management and motivation and carrier guidance to them (50.00%). This is mainly due to the fact that majority of teachers were doctorate holders having experience of working in other scientific research and extension departments. They are highly specialized, qualified and skill oriented and situates their efforts in giving updated knowledge to students. Similarly, 42.00 per cent of the student's perceived teaching faculty was average at using innovations in teaching followed by use of ICT tools for teaching (42.00%), interaction with students & summarization at the end of class (34.00%) and acquiring & updating the new development in agriculture sector (32.00%) (Table 3). Further, 40.00 per cent of them perceived teaching faculty were poor at addressing students problems followed by summarization at the end of class (18.00%), motivation and carrier guidance and use of ICT tools for teaching (12.00%) (Table 3).
| Sl. No | Indicators | Scoring pattern | — | — | — | — | — | — | — | — | — |
|---|---|---|---|---|---|---|---|---|---|---|---|
| Excellent | Good | Average | Poor | Very poor | |||||||
| F | % | F | % | F. | % | F | % | F | % | ||
| 1 | Depth of subject Knowledge | 10 | 20.00 | 36 | 72.00 | 04 | 8.000 | 00 | 00.00 | 00 | 00.00 |
| 2 | Updating & acquiring the new development in agriculture sector | 07 | 14.00 | 25 | 50.00 | 16 | 32.00 | 02 | 04.00 | 00 | 00.00 |
| 3 | Teaching skills | 09 | 18.00 | 31 | 62.00 | 07 | 14.00 | 03 | 06.00 | 00 | 00.00 |
| 4 | Organization and completion of course (Coverage of syllabus) | 15 | 30.00 | 27 | 54.00 | 07 | 14.00 | 01 | 02.00 | 00 | 00.00 |
| 5 | Punctuality | 15 | 30.00 | 24 | 48.00 | 10 | 20.00 | 01 | 02.00 | 00 | 00.00 |
| 6 | Interaction with students | 10 | 20.00 | 20 | 40.00 | 17 | 34.00 | 01 | 02.00 | 01 | 02.00 |
| 7 | Innovations in teaching | 06 | 12.00 | 22 | 44.00 | 21 | 42.00 | 01 | 02.00 | 01 | 02.00 |
| 8 | Conducting examination and Evaluation | 31 | 62.00 | 12 | 24.00 | 05 | 10.00 | 01 | 02.00 | 01 | 02.00 |
| 9 | Practical knowledge and relevance | 10 | 20.00 | 26 | 52.00 | 11 | 22.00 | 01 | 02.00 | 02 | 02.00 |
| 10 | Motivation and career guidance | 06 | 12.00 | 26 | 52.00 | 08 | 16.00 | 08 | 16.00 | 02 | 04.00 |
| 11 | Sincerity of teaching faculty | 09 | 18.00 | 33 | 66.00 | 05 | 10.00 | 02 | 04.00 | 01 | 02.00 |
| 12 | Assignment and its relevance | 07 | 14.00 | 27 | 54.00 | 15 | 30.00 | 00 | 00.00 | 01 | 02.00 |
| 13 | Use of their experience in teaching | 15 | 30.00 | 19 | 38.00 | 12 | 24.00 | 03 | 06.00 | 01 | 02.00 |
| 14 | Summarization at the end of class | 05 | 10.00 | 18 | 36.000 | 17 | 34.00 | 09 | 18.00 | 01 | 02.00 |
| 15 | Providing course materials and use of teaching aids | 11 | 22.00 | 22 | 44.00 | 10 | 20.0 | 03 | 06.00 | 04 | 08.00 |
| 16 | Time management | 06 | 12.00 | 26 | 52.00 | 15 | 30.00 | 01 | 02.00 | 02 | 04.0 |
| 17 | Addressing students problem | 00 | 00.00 | 13 | 26.00 | 07 | 14.00 | 20 | 40.00 | 20 | 20.00 |
| 18 | Use of ICT tools for teaching | 03 | 06.00 | 18 | 36.00 | 20 | 40.00 | 06 | 12.00 | 02 | 04.00 |
Table text extracted from the original PDF; superscript letters are shown inline. The original table image is below.
View original table image
Overall perception of student about college administration
As per Table 4, fifty four per cent of the students opined that functioning of college administration was average and 16 and 14 per cent of them opined as poor and good respectively.
| Sl. No | Category | Frequency | Per cent |
|---|---|---|---|
| 1. | Poor (<40.12) | 08 | 16.00 |
| 2. | Average (40.12-55.74) | 35 | 70.00 |
| 3. | Good (>55.74) | 07 | 14.00 |
| Mean = 48.62 | SD = 7.12 |
Table text extracted from the original PDF; superscript letters are shown inline. The original table image is below.
View original table image
Student perception about college administration
With respect to student's perception about college administration (Table 5) indicated that 56.00% of the student were fully satisfied with the measures taken to eradicate ragging followed by ban on cigarette, liquor and other items in college premises (38%), auditoriumaccess and maintenance (32%) and admission procedure (30%). Similarly, 58 per cent of them were just satisfied with the functioning of placement cell/campus recruitments followed by functioning of students association and alumni association (48%), counselor cellmotivation and problem solving and safety and security of students in the campus (46%). Further, 38.00 per cent of them were partially dissatisfied with respect to academic section followed by fee structure (26%) and admission procedure (24%). www.extensionjournal.com
| Sl. No | Particulars | Degree of satisfaction | — | — | — | — | — | — | — | — | — |
|---|---|---|---|---|---|---|---|---|---|---|---|
| FS | S | PS | D | FD | |||||||
| No | % | No | % | No | % | No | % | No | % | ||
| 1. | College administration (Supportive/encouraging) | 12 | 24.0 | 19 | 38.0 | 11 | 22.0 | 07 | 14.0 | 01 | 02.0 |
| 2. | Functioning of placement cell/campus recruitments | 03 | 06.0 | 29 | 58.0 | 08 | 16.0 | 09 | 18.0 | 01 | 02.0 |
| 3. | Safety and security of students in the campus | 14 | 28.0 | 23 | 46.0 | 07 | 14.0 | 03 | 06.0 | 02 | 04.0 |
| 4. | Functioning of students’ association | 10 | 20.0 | 24 | 48.0 | 12 | 24.0 | 04 | 08.0 | 01 | 02.0 |
| 5. | Functioning of alumni association | 10 | 20.0 | 24 | 48.0 | 09 | 18.0 | 08 | 16.0 | 00 | 000 |
| 6. | Admission procedure | 15 | 30.0 | 17 | 34.0 | 12 | 24.0 | 04 | 08.0 | 02 | 04.0 |
| 7. | Fee structure | 11 | 22.0 | 20 | 40.0 | 13 | 26.0 | 04 | 08.0 | 01 | 02.0 |
| 8. | Treatment of students (Gender, regional and caste) | 09 | 18.0 | 20 | 40.0 | 09 | 18.0 | 05 | 10.0 | 07 | 14.0 |
| 9. | Measures taken to eradicate ragging | 28 | 56.0 | 15 | 30.0 | 05 | 10.0 | 02 | 04.0 | 00 | 000 |
| 10. | Ban on cigarette, liquor and other items in college premises | 19 | 38.0 | 19 | 38.0 | 07 | 14.0 | 03 | 06.0 | 02 | 04.0 |
| 11. | Auditorium – access and maintenance | 16 | 32.0 | 15 | 30.0 | 12 | 24.0 | 04 | 08.0 | 02 | 04.0 |
| 12. | Account section | 04 | 08.0 | 7 | 14.0 | 19 | 38.0 | 13 | 26.0 | 07 | 14.0 |
| 13. | Counselor cell – motivation and problem solving | 08 | 16.0 | 23 | 46.0 | 12 | 24.0 | 00 | 000 | 00 | 000 |
| 14. | Academic section | 09 | 18.0 | 21 | 42.0 | 12 | 24.0 | 05 | 10.0 | 03 | 06.0 |
Table text extracted from the original PDF; superscript letters are shown inline. The original table image is below.
View original table image
Conclusion
The perception of students towards teaching faculty indicated that the teachers in colleges were good at different teaching qualities, skills and behavior. The teachers are well qualified and have the updated knowledge of the subject and got sufficient experience which is a good sign for the institutions to contribute effectively in education for the benefit of students. It is also good for the students to get trained under the able guidance expert teachers. For providing better quality education, positive students' perception about their teachers' is required. Students' perception not only depends on teachers' internal characteristics but also influence other factors. Teachers are playing very crucial rule in our society for making skill full and capable students. For better education our education system need teachers and students collaboration. Not only University of Agricultural Sciences, Raichur but other educational institutions must focus on providing quality teaching. When teachers'-students' relationship will be positive then both parties will feel happy in the education process.
Figures and tables from the paper
| Sl. No | Category | Frequency | Per cent |
|---|---|---|---|
| 1. | Poor (<56.87) | 10 | 20.00 |
| 2. | Average (56.87– 77.45) | 08 | 16.00 |
| 3. | Good (>77.45) | 32 | 64.00 |
| Mean = 67.16 | SD = 10.29 |
Table text extracted from the original PDF; superscript letters are shown inline. The original table image is below.
View original table image
References
4 in the original paper- Etuk EN, Afangideh ME, Dan Uya AO. Students 'Perception of Teachers Characteristics and Their Attitude towards Mathematics in Oron Education Zone. Nigeria. International education Studies. 2013;6(2):197204.
- Govindagowda V, Thimmegowda MN, Doddamani A. Attitude of students towards agricultural education and their perceived organizational atmosphere. Advance Research Journal of Social Science. 2012;3(1):77-80.
- Laxman MA, Sontakki BS, Venkatesa P, Basith MA. 'Students attitude on agricultural education and perception towards institutional issues'. Multilogic in Science. 2020;46:2277-7601.
- Mempengaruhinya. Jakarta: Rineka Cipta. Sugiyono. 2012. Metode Penelitian Kuantitatif, Kualitatif, dan R&D. Bandung: Remaja Rosdakarya; c2010.