
Research article · 2024 · Full text
International Journal of Agriculture Extension and Social DevelopmentA study on students perception towards various institutional facilities: The case study of university of agriculture sciences, Raichur, Karnataka
Volume 7(1) · Pages 176–179 · DOI: 10.33545/26180723.2024.v7.i1c.204 ↗
Research areasDiverse Scientific Research StudiesInnovations in Educational MethodsInnovations and Analysis in Business and Education
Abstract
Author-writtenThe study was aimed to find out the perception of agriculture students towards various facilities available in the University of Agricultural Sciences, Raichur. This study aims at finding out what is the student’s perception about the available facilities and what suggestions they have for improving the same. Their feedback is important since students are the main resource in the campus and they are the largest group that study and live on campus. The findings of the study revealed that, 64.00 per cent of the students perceived the physical facilities available at university were average, 52.00 per cent of them opined instructional farms/ fields were excellent followed College building (40.00%) and laboratory facilities (34.00%). Regarding library facilities, 56.00 per cent of the student opined quality of various library facilities were average, 62.00% of them highly satisfied with regard to accessibility to books and journals. Regarding sports and cultural facilities, 54.00 per cent of the students perceived sports and cultural facilities were average. While, 54.00 per cent of them opined quality of the various hostel facilities were average, 46.00 per cent were highly satisfied with food provided in the hostel, 56.00 per cent perceived laundry facility at their university was ‘very poor.
Summary
Source-checkedPlain-language reading of the full paper, prepared with AI and checked against the text. Each point links to the authors' own words.
Why it matters
- The academic and social environment of higher education institutions is critical because it can either support or hinder a student's academic success. View evidence ↗
- Educational institutions need to regularly assess the quality of services like libraries, classrooms, sports, and laboratories from the students' perspective to ensure continuous improvement. View evidence ↗
- Agricultural education is intended to benefit society by expanding knowledge and contributing to the nation's socio-economic development. View evidence ↗
The question
- The study aimed to understand how agriculture students at the College of Agriculture, Raichur, perceive the efficiency of university facilities and identify areas for improvement. View evidence ↗
What they did
- Data was gathered using a pre-tested questionnaire developed with the assistance of experts. View evidence ↗
- Student perceptions were measured using a five-point Likert scale ranging from 'Excellent' (5) to 'Very Poor' (1). View evidence ↗
What they found
- Regarding overall physical facilities, 64.00% of students rated them as average, 24% as good, and 12% as poor. View evidence ↗
- Instructional farms and fields were the highest-rated specific facility, with 52.00% of students rating them as excellent, followed by classroom size/strength (42.00%), college buildings (40.00%), and laboratory facilities (34.00%). View evidence ↗
- For library facilities, 56.00% of students perceived the quality as average, 24.00% as good, and 20.00% as poor. View evidence ↗
- Within the library, the highest satisfaction was for accessibility to books and journals (62.00%), followed by the relevance of materials (54.00%) and the arrangement of materials (50.00%). View evidence ↗
- Sports and cultural facilities were rated as average by 54.00% of students, poor by 26.00%, and good by 20.00%. View evidence ↗
- Yoga and meditation facilities were poorly perceived, with 38.00% rating them as poor, 26.00% as average, 18.00% as very poor, and only 12.00% as good. View evidence ↗
- Hostel facilities were rated as average by 54.00% of students, poor by 30.00%, and good by 16.00%. View evidence ↗
- The laundry facility was the most negatively perceived hostel service, with 56.00% of students rating it as 'very poor'. View evidence ↗
- Hostel food quality was rated as good by 46.00% of students, average by 26.00%, and excellent by 10.00%. View evidence ↗
What it means
- The authors concluded that students were generally satisfied with most facilities, especially instructional farms/fields, sports grounds, the general library environment, and classroom arrangements. View evidence ↗
Visual summary
3 visualsIllustrations explain the paper; charts are replotted from the paper's own table values.
Overview of Student Perception Categories
AI-generated conceptual illustration (University campus facilities including a lecture hall, a library, a sports field, and a dormitory building). It explains the idea and does not show study data.
View source evidence ↗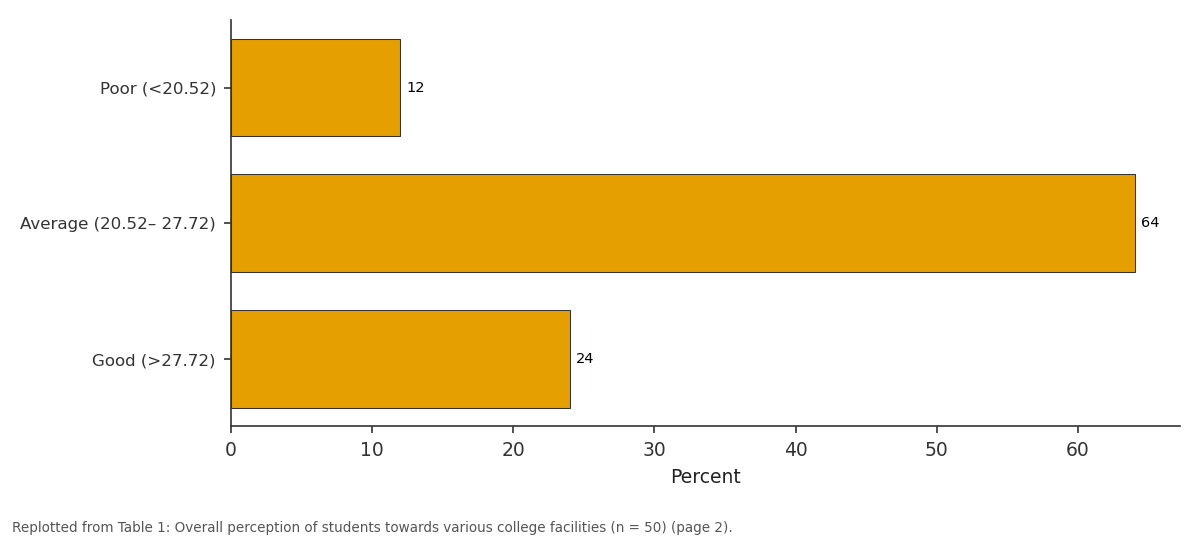
Percent: Poor (<20.52) vs Average (20.52– 27.72) vs Good (>27.72)
Replotted from Table 1 (page 2) of the original paper. Every bar is the paper's own table value.
View source evidence ↗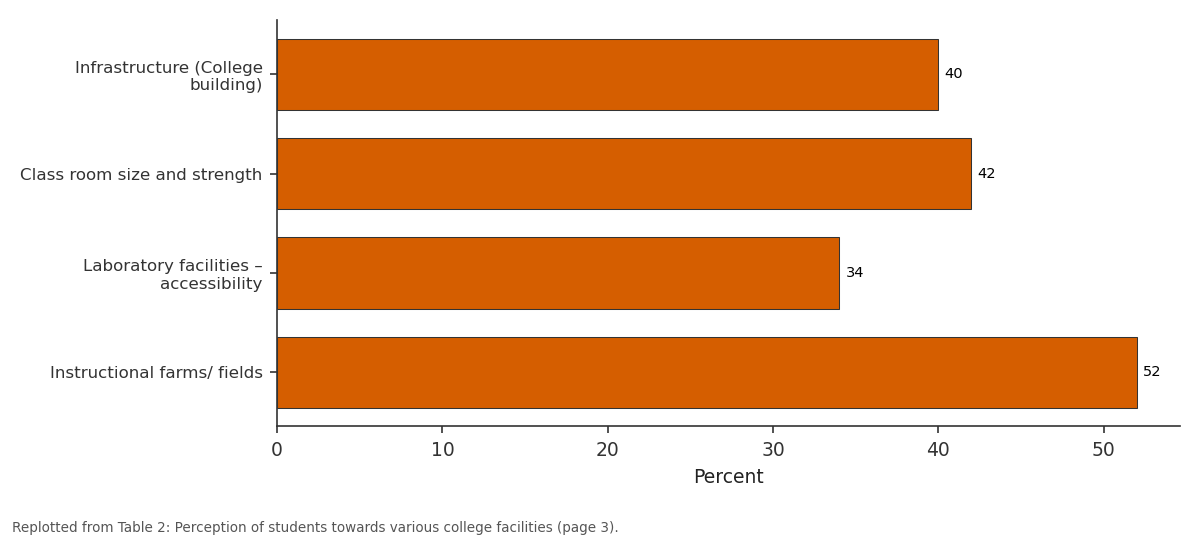
%: Infrastructure (College... vs Class room size and... vs Laboratory facilities –... vs Instructional farms/...
Replotted from Table 2 (page 3) of the original paper. Every bar is the paper's own table value.
View source evidence ↗Figures & tables
From the original paper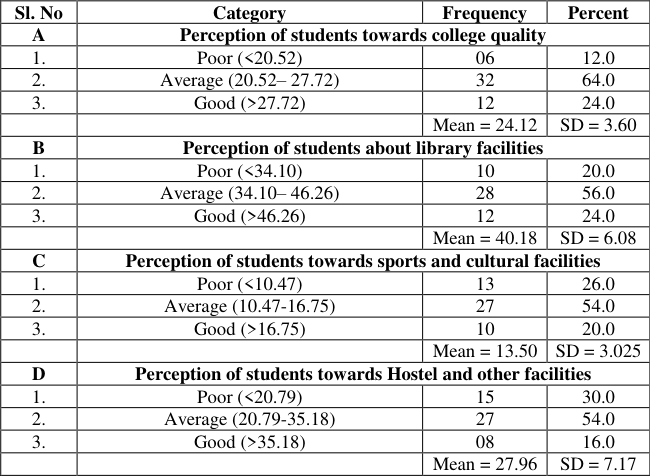 Table 1
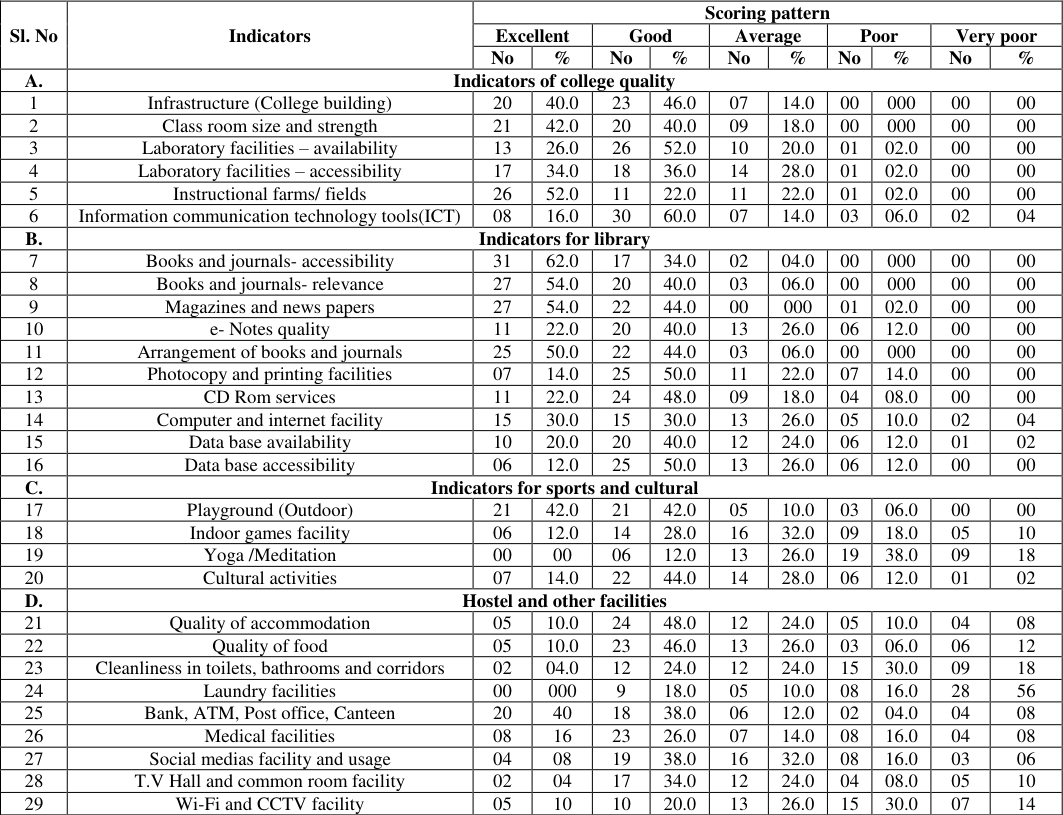 Table 2
Introduction
Institutional policies and practices must be oriented toward developing a climate in which students' responsibility for, and active participation in, their own collegiate experience are promoted. Policies that stress the importance of student achievement in-class and co-curricular activities are essential for student growth. The academic and social climate in higher education institutions can support or hinder positive academic outcomes of students. In higher education research, the campus climate has been defined as the current perceptions, attitudes, and expectations that define the institution and its members (Peterson and Spencer 1990) [4] . There is a need for education institutions to consistently measure the performance of educational facilities' service quality -particularly library, classroom, sports, and laboratory services -for continuous improvement from the students' perspective. This is because students are directly involved in the education process hence it is essential to obtain their views on the quality of services as well as the quality of education. The outcome of such study help the service provider to make judgments about the level of the quality of facilities provided in the educational institutions (Hill, Lomas and MacGregor, 2003, Jusoh, Omain, Majid, Md Som and Shamsuddin, 2004) [2] . Agricultural education system is expected to generate benefits to various segments of society in terms of expanding the frontiers of knowledge as well as contributing to the socio-economic development of nation. To accomplish this there is need for an effective monitoring and evaluation of agricultural education system that can track the education results and communicate such results to the various stakeholders like academic community, policy makers, industry players etc. in an appropriate manner that will ensure uptake of such agricultural education system results, in terms of guiding during decision-making or application of the knowledge in Agriculture industry. Hence the purpose of this study was to understand the perception of agriculture students towards various facilities in College of Agriculture, Raichur. It is to understand whether the facilities provided inside university are efficient and to know whether the facilities can be improved.
Methodology
The purpose of study was to understand the perception of agriculture students towards various facilities in UAS, www.extensionjournal.com Raichur. The study was conducted in the University of Agricultural Sciences, Raichur during the academic year 2017-2018. Fifty students of final B.Sc (Agri.) were selected by random sampling method. The data was collected from the students by using the well-constructed questionnaire. Questionnaire was prepared with the help of concerned experts and was pre-tested. The collected data then scored analyzed and interpreted. Students' perception towards institutional facilities was studied by using the Likert type scale in which the responses of students were calculated on a five point quantum scale as Excellent, Good, Average, Poor and Very Poor with the weightage of 5, 4, 3, 2 and 1 respectively.
Results and Discussion
The results are presented with various heads such as overall perception of the students towards various college facilities, student's perception towards the college facilities and conclusion.
Overall perception of students towards various college facilities: Pertaining to overall perception of students towards various college facilities, the data presented in Table 1. Indicates that, 64.00 percent of the students perceived the physical facilities available at university were average followed by good and poor in the order of 24 and 12 percent respectively (Table 1A). Regarding library facilities, 56.00 percent of the student opined quality of various library facilities were average followed by good and poor in the order of 24.00 and 20.00 percent respectively (Table 1B). With regard to sports and cultural facilities, 54.00 percent of the students perceived sports and cultural facilities were average. Further, 26.00 and 20.00 percent of them were perceived as poor and good respectively (Table 1C). Regarding hostel facilities, 54.00 percent of them opined quality of the various hostel facilities were average followed by 30.00 and 16.00 percent of them perceived as poor and good respectively (Table1D).
| Sl. No | Category | Frequency | Percent |
|---|---|---|---|
| A | Perception of students towards college quality | ||
| 1. | Poor (<20.52) | 06 | 12.0 |
| 2. | Average (20.52– 27.72) | 32 | 64.0 |
| 3. | Good (>27.72) | 12 | 24.0 |
| Mean = 24.12 | SD = 3.60 | ||
| B | Perception of students about library facilities | ||
| 1. | Poor (<34.10) | 10 | 20.0 |
| 2. | Average (34.10– 46.26) | 28 | 56.0 |
| 3. | Good (>46.26) | 12 | 24.0 |
| Mean = 40.18 | SD = 6.08 | ||
| C | Perception of students towards sports and cultural facilities | ||
| 1. | Poor (<10.47) | 13 | 26.0 |
| 2. | Average (10.47-16.75) | 27 | 54.0 |
| 3. | Good (>16.75) | 10 | 20.0 |
| Mean = 13.50 | SD = 3.025 | ||
| D | Perception of students towards Hostel and other facilities | ||
| 1. | Poor (<20.79) | 15 | 30.0 |
| 2. | Average (20.79-35.18) | 27 | 54.0 |
| 3. | Good (>35.18) | 08 | 16.0 |
| Mean = 27.96 | SD = 7.17 |
Table text extracted from the original PDF; superscript letters are shown inline. The original table image is below.
View original table image
Perception of students towards various college facilities
The data with regard to perception of students towards various college facilities is presented in Table 2.
| Sl. No | Indicators | Scoring pattern | — | — | — | — | — | — | — | — | — |
|---|---|---|---|---|---|---|---|---|---|---|---|
| Excellent | Good | Average | Poor | Very poor | |||||||
| No | % | No | % | No | % | No | % | No | % | ||
| A. | Indicators of college quality | ||||||||||
| 1 | Infrastructure (College building) | 20 | 40.0 | 23 | 46.0 | 07 | 14.0 | 00 | 000 | 00 | 00 |
| 2 | Class room size and strength | 21 | 42.0 | 20 | 40.0 | 09 | 18.0 | 00 | 000 | 00 | 00 |
| 3 | Laboratory facilities – availability | 13 | 26.0 | 26 | 52.0 | 10 | 20.0 | 01 | 02.0 | 00 | 00 |
| 4 | Laboratory facilities – accessibility | 17 | 34.0 | 18 | 36.0 | 14 | 28.0 | 01 | 02.0 | 00 | 00 |
| 5 | Instructional farms/ fields | 26 | 52.0 | 11 | 22.0 | 11 | 22.0 | 01 | 02.0 | 00 | 00 |
| 6 | Information communication technology tools(ICT) | 08 | 16.0 | 30 | 60.0 | 07 | 14.0 | 03 | 06.0 | 02 | 04 |
| B. | Indicators for library | ||||||||||
| 7 | Books and journals- accessibility | 31 | 62.0 | 17 | 34.0 | 02 | 04.0 | 00 | 000 | 00 | 00 |
| 8 | Books and journals- relevance | 27 | 54.0 | 20 | 40.0 | 03 | 06.0 | 00 | 000 | 00 | 00 |
| 9 | Magazines and news papers | 27 | 54.0 | 22 | 44.0 | 00 | 000 | 01 | 02.0 | 00 | 00 |
| 10 | e- Notes quality | 11 | 22.0 | 20 | 40.0 | 13 | 26.0 | 06 | 12.0 | 00 | 00 |
| 11 | Arrangement of books and journals | 25 | 50.0 | 22 | 44.0 | 03 | 06.0 | 00 | 000 | 00 | 00 |
| 12 | Photocopy and printing facilities | 07 | 14.0 | 25 | 50.0 | 11 | 22.0 | 07 | 14.0 | 00 | 00 |
| 13 | CD Rom services | 11 | 22.0 | 24 | 48.0 | 09 | 18.0 | 04 | 08.0 | 00 | 00 |
| 14 | Computer and internet facility | 15 | 30.0 | 15 | 30.0 | 13 | 26.0 | 05 | 10.0 | 02 | 04 |
| 15 | Data base availability | 10 | 20.0 | 20 | 40.0 | 12 | 24.0 | 06 | 12.0 | 01 | 02 |
| 16 | Data base accessibility | 06 | 12.0 | 25 | 50.0 | 13 | 26.0 | 06 | 12.0 | 00 | 00 |
| C. | Indicators for sports and cultural | ||||||||||
| 17 | Playground (Outdoor) | 21 | 42.0 | 21 | 42.0 | 05 | 10.0 | 03 | 06.0 | 00 | 00 |
| 18 | Indoor games facility | 06 | 12.0 | 14 | 28.0 | 16 | 32.0 | 09 | 18.0 | 05 | 10 |
| 19 | Yoga /Meditation | 00 | 00 | 06 | 12.0 | 13 | 26.0 | 19 | 38.0 | 09 | 18 |
| 20 | Cultural activities | 07 | 14.0 | 22 | 44.0 | 14 | 28.0 | 06 | 12.0 | 01 | 02 |
| D. | Hostel and other facilities | ||||||||||
| 21 | Quality of accommodation | 05 | 10.0 | 24 | 48.0 | 12 | 24.0 | 05 | 10.0 | 04 | 08 |
| 22 | Quality of food | 05 | 10.0 | 23 | 46.0 | 13 | 26.0 | 03 | 06.0 | 06 | 12 |
| 23 | Cleanliness in toilets, bathrooms and corridors | 02 | 04.0 | 12 | 24.0 | 12 | 24.0 | 15 | 30.0 | 09 | 18 |
| 24 | Laundry facilities | 00 | 000 | 9 | 18.0 | 05 | 10.0 | 08 | 16.0 | 28 | 56 |
| 25 | Bank, ATM, Post office, Canteen | 20 | 40 | 18 | 38.0 | 06 | 12.0 | 02 | 04.0 | 04 | 08 |
| 26 | Medical facilities | 08 | 16 | 23 | 26.0 | 07 | 14.0 | 08 | 16.0 | 04 | 08 |
| 27 | Social medias facility and usage | 04 | 08 | 19 | 38.0 | 16 | 32.0 | 08 | 16.0 | 03 | 06 |
| 28 | T.V Hall and common room facility | 02 | 04 | 17 | 34.0 | 12 | 24.0 | 04 | 08.0 | 05 | 10 |
| 29 | Wi-Fi and CCTV facility | 05 | 10 | 10 | 20.0 | 13 | 26.0 | 15 | 30.0 | 07 | 14 |
Table text extracted from the original PDF; superscript letters are shown inline. The original table image is below.
View original table image
A. Indicators of college quality
It is noticed from Table 2A that, 52.00 percent of the students opined instructional farms/fields were excellent followed by class room size and strength (42.00%), infrastructure (College building) (40.00%) and laboratory facilities (34.00%). Whereas, 60.00 percent of the students perceived information communication technology tools (ICT) at college were good followed by availability of laboratory facilities (52.00%), college building (46.00%), class room size and strength (40.00%). Twenty eight percent of them opined that accessibility to laboratory facilities were average followed by instructional farms/ fields (22.00%), availability of laboratory facilities (20.00%) and class room size and strength (18.00%). (Hari Prakash et al., 2018) [1] .
B. Indicators for library facilities
With respect to perception of students towards library facilities indicated that (Table 2B), 62.00 percent of the students highly satisfied with regard to accessibility to books and journals followed by relevance of the books, journals, magazines & newspapers (54.00%) and arrangement of books and journals in the library (50.00%). Whereas, 62.00 percent of the student's perceived photocopy and printing facilities were good at library followed by CD Rom services (48.00%), data base accessibility (50.00%), arrangement of books & journals, magazines & newspapers available in library (44.00%). Twenty six percent of them perceived that e-notes quality, data base accessibility and computer and internet facilities were average followed by photocopy and printing facilities (22%) and CD Rom services (18%). (Laxman, et al., 2020) [3] . www.extensionjournal.com
C. Indicators for sports and cultural facilities
Pertaining to perception of students towards sports and cultural facilities (Table 2C), 41.00 percent of the students perceived the playground (outdoor) was on excellent and good equally followed by 10.00 and 6.00 percent opined average and poor respectively. Majority of the students perceived the indoor games facilities at their university were 'average' and good in the order of 32.00 and 28.00 percent respectively. Similarly students perceived the yoga and meditation facilities were 'poor' and 'average' in the order of 38.00 and 26.00 percent respectively. Further, 18.00 percent of the student opined as very poor and only 12.00 percent opined as good. Regarding cultural activities, student's expressed that facilities provided for cultural activities were 'good' and 'average' in the order of 44.00 and 28.00 percent respectively and only 12.00 percent of the student opined excellent D. Hostel and other facilities: With regard to hostel and other facilities (Table 2D), 56.00 percent of the students perceived laundry facility at their university was 'very poor. Student's opined that quality of food provided in the hostel was good and average in the order of 46.00 and 26.00 percent respectively and only 10.00% of them opined as excellent. Similarly 30.00 and 24.00 percent of student's perceived "cleanliness maintained in toilets, bathrooms and corridors was poor and average respectively and only 24 percent of the students opined as excellent. Further, it was observed that 30.00 and 26.00 percent of the student's perceived Wi-Fi and CCTV facility at the hostel was poor and average respectively, whereas, only 10.00 percent of the student viewed as excellent. With regard to T.V hall and common room facility in the hostel, 24.00 and 34.00 percent of the student opined good and average respectively and only 4.00% opined as excellent. Regarding medical facilities available at the university, 26.00 and 16.00 percent of the student opined good and excellent respectively. (Hari Prakash et al., 2018) [1] .
Conclusion
Based on the findings of this study, it was concluded that the students were generally satisfied with most of facilities particularly the classroom arrangements, the general library environment, sports ground, Instructional farms/ fields etc.
However, various facilities provided by university like enotes quality, data base accessibility, computer and internet facilities, photo copying facility, ICT tools, laboratories, library, sports, cultural and hostel facilities were average. Hence, to enhance their level of satisfaction, there is need to
Acknowledgement
www.extensionjournal.com improve/ upgrade the facilities in their respective establishments with modern technologies / infrastructure facilities.
References
4 in the original paper- Hari Prakash N, Deepa M, Ramakrishna G. A study on students' perception towards various facilities in Kumaraguru College of Technology -Coimbatore. Int. J Pure Appl Math. 2018;119(17):2675-2685.
- Hill Y, Lomas L, MacGregor J. Students' perceptions of quality in higher education. Qual Assur Educ. 2003;11(1):15-20. http://dx.doi.org/10.1108/09684880310462047.
- Laxman MA, Sontakki BS, Venkatesa P, Basith MA. Students' attitude on agricultural education and perception towards institutional issues. Multilogic Sci. 2020;10(34):2277-7601.
- Peterson MW, Spencer MG. Understanding academic culture and climate. New Dir Inst Res. 1990;17(4):3-18.