
Research article · 2022 · Full text
International Journal of Advanced Chemistry ResearchStudy of the impact of Diwali on the air quality of Dehradun
Volume 4(2) · Pages 351–354 · DOI: 10.33545/26646781.2022.v4.i2e.160 ↗
Research areasCOVID-19 impact on air qualityAir Quality Monitoring and ForecastingAir Quality and Health Impacts
Abstract
Author-writtenThe study focused on analyzing the levels of air quality parameters across 2 areas of Dehradun – Clock Tower & Nehru Colony, both pre and post Diwali 2021. The data analyzed showed higher concentrations across all parameters during the 5-day period around Diwali. While the concentrations of SOx & NOx were within National Ambient Air Quality Standards of the Central Pollution Control Board, PM10 & PM2.5 concentrations exceeded the standards. It was also noted that the levels almost reached back to pre-Diwali levels within a week post-Diwali. These could impact both plants and animals with devastating effects, causing severe respiratory problems.
Summary
Source-checkedPlain-language reading of the full paper, prepared with AI and checked against the text. Each point links to the authors' own words.
Why it matters
- The use of fireworks and firecrackers during Diwali celebrations can negatively impact air quality, particularly in densely populated areas. View evidence ↗
- The metals used to create the colors and sounds of fireworks contribute to the amount of suspended particulate matter in the air. View evidence ↗
- Dehradun's geography, characterized by surrounding hills, can worsen air pollution by trapping pollutants and preventing them from dispersing. View evidence ↗
The question
- The study aims to evaluate air pollution risks in Dehradun by analyzing air quality parameters over a 15-day period spanning before, during, and after Diwali. View evidence ↗
What they did
- Air quality parameters were analyzed in two specific areas of Dehradun: Clock Tower and Nehru Colony, during the 2021 Diwali period. View evidence ↗
- Particulate matter was measured using high-volume air sampling with a flow rate between 0.9 and 1.4 cubic meters per minute. View evidence ↗
- Gaseous pollutants were captured using absorbing reagents and then analyzed via spectrophotometry. View evidence ↗
What they found
- Concentrations of SOx and NOx nearly doubled during the Diwali period compared to their levels before the festival. View evidence ↗
- Despite the increase, SOx and NOx levels remained within the daily limits set by the Ambient Air Quality Standards. View evidence ↗
- Particulate matter levels increased by 2 to 2.5 times their normal values, exceeding the ambient air quality standards. View evidence ↗
- The Air Quality Index (AQI) for Dehradun was 'moderate' before Diwali and dropped to 'poor' during days 3 to 5 of the festival in both study areas. View evidence ↗
- The Clock Tower area, located in the central business district, showed worse air quality measurements across all parameters than the Nehru Colony area. View evidence ↗
- Air quality levels nearly returned to their pre-Diwali state within one week after the festival. View evidence ↗
What it means
- The authors conclude that the elevated levels of PM10 and PM2.5 during Diwali pose severe health risks, including cardiovascular and respiratory diseases. View evidence ↗
- The authors suggest that future research should identify the specific chemical components of different particulate matter size fractions to better understand their carcinogenic properties. View evidence ↗
Visual summary
3 visualsIllustrations explain the paper; charts are replotted from the paper's own table values.
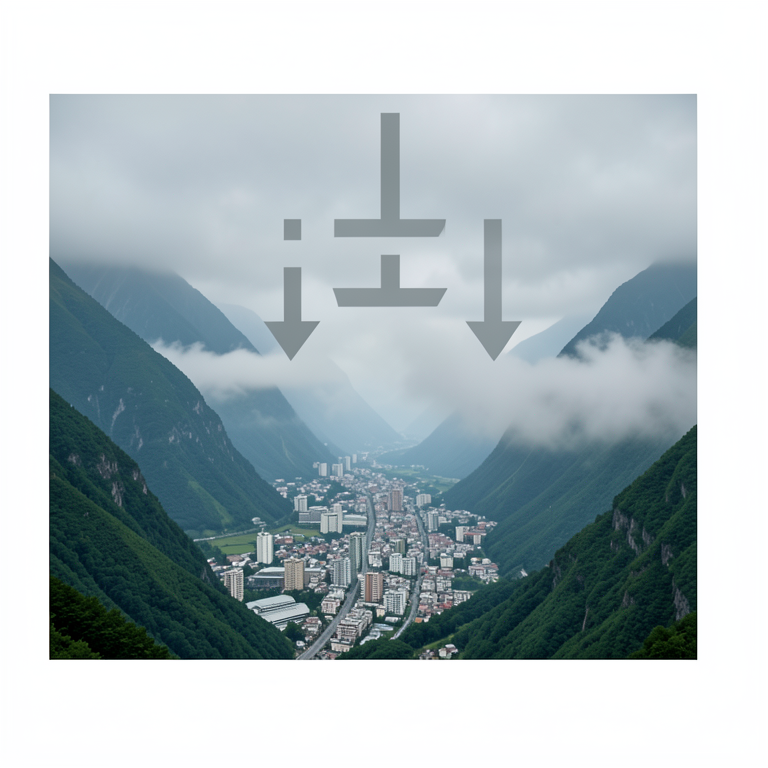
Topographic Trapping of Pollutants
AI-generated conceptual illustration (The city of Dehradun situated in a valley surrounded by the Himalayan foothills). It explains the idea and does not show study data.
View source evidence ↗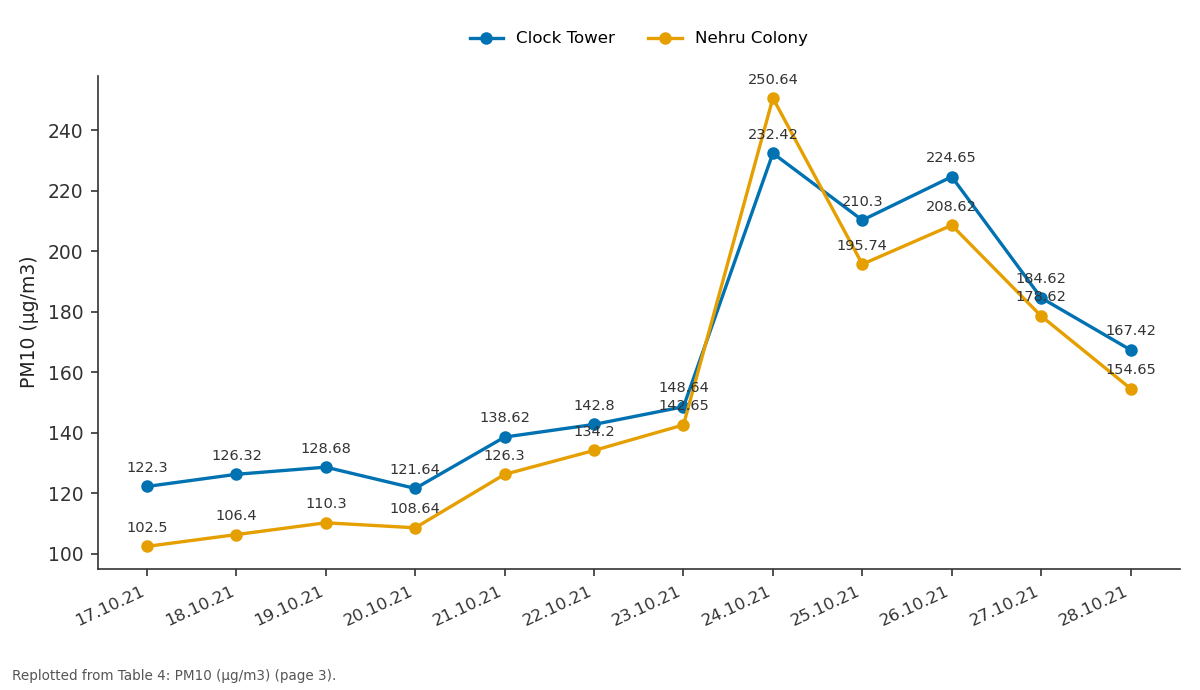
Clock Tower and Nehru Colony: 17.10.21 vs 18.10.21 vs 19.10.21 vs 20.10.21 vs 21.10.21
Replotted from Table 4 (page 3) of the original paper. Every bar is the paper's own table value.
View source evidence ↗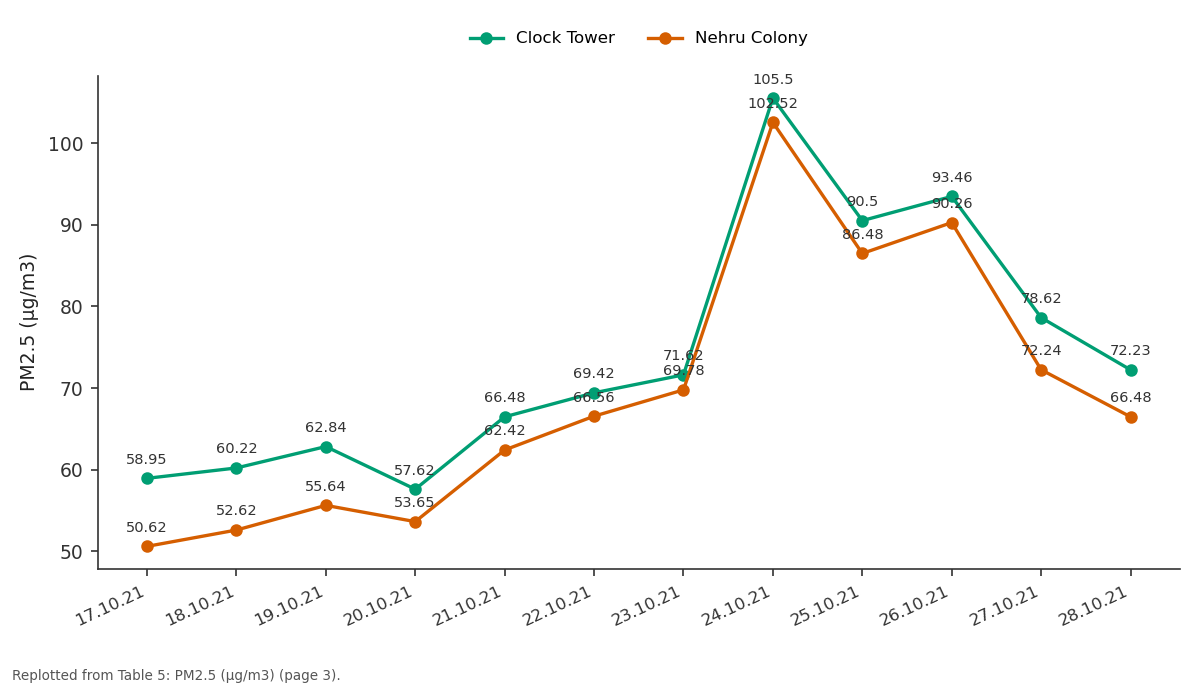
Clock Tower and Nehru Colony: 17.10.21 vs 18.10.21 vs 19.10.21 vs 20.10.21 vs 21.10.21
Replotted from Table 5 (page 3) of the original paper. Every bar is the paper's own table value.
View source evidence ↗Figures & tables
From the original paper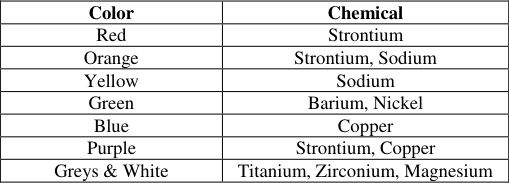 Table 1
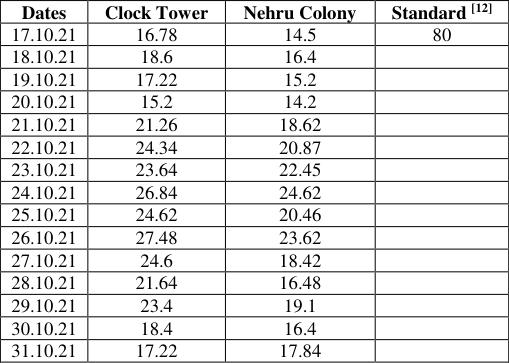 Table 2
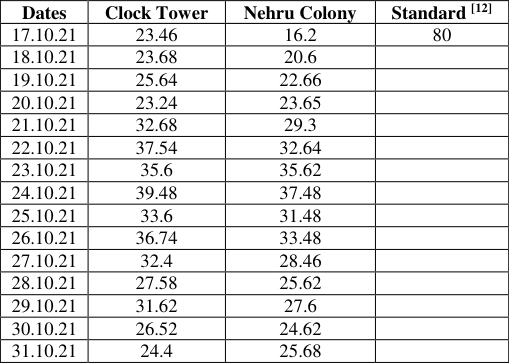 Table 3
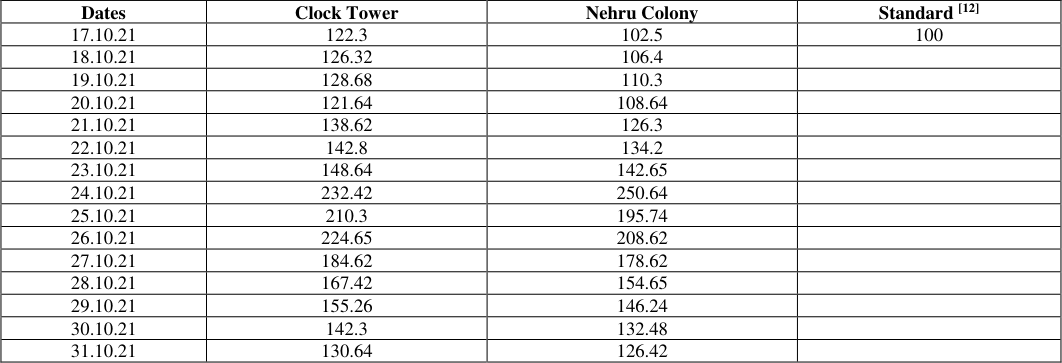 Table 4
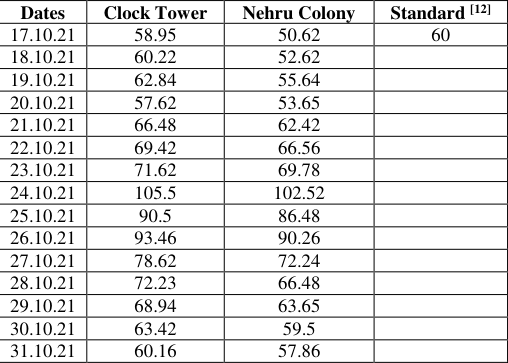 Table 5
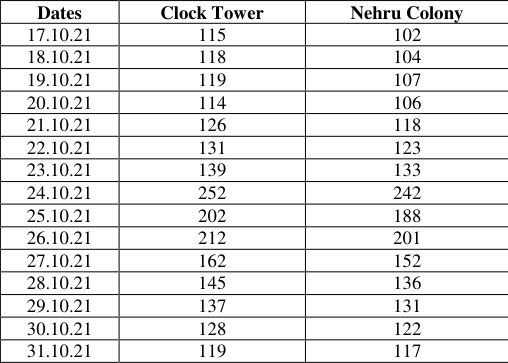 Table 6
 Table 7
Introduction
Deepavali, also known as Diwali, is a traditional festival often referred to as the "festival of illuminations." This significant five-day celebration typically takes place between mid-October to mid-November and holds varying significance across India. For Hindus, Diwali is a momentous occasion, marked by the observance of traditional rituals within their homes. The specific customs and traditions may vary across regions and communities, but some common elements characterize the celebration of Diwali throughout India. Lighting oil lamps (diyas) and candles is a central part of Diwali. The illumination signifies the victory of light over darkness and the triumph of good over evil. Fireworks and firecrackers also form a major part of Diwali celebrations. People burst fireworks to symbolize the victory of light and the dispelling of darkness, and it is this practice that has the potential to impact air quality especially in population centers. The colors, light, and sound of fireworks are all achieved using various metals (Table 1) which then impact the suspended particulate content of the air. Although the Supreme court of India banned the use of certain chemicals [1] to minimize the usage of the most hazardous compounds, a lot of small, unregulated manufacturers might still be using these chemicals.
| Color | Chemical |
|---|---|
| Red | Strontium |
| Orange | Strontium, Sodium |
| Yellow | Sodium |
| Green | Barium, Nickel |
| Blue | Copper |
| Purple | Strontium, Copper |
| Greys & White | Titanium, Zirconium, Magnesium |
Table text extracted from the original PDF; superscript letters are shown inline. The original table image is below.
View original table image
Rapid urbanization, vehicular emissions, industrial activities, and unchecked construction have collectively contributed to a discernible decline in air quality over recent years. Studies conducted on Dehradun's air quality have revealed elevated levels of particulate matter (PM10 and PM2.5), nitrogen dioxide (NO2), and sulfur dioxide (SO2). The region's topography, with its surrounding hills, can exacerbate pollution concerns by trapping pollutants and hindering proper dispersion.
Materials and Methodology
The criteria used to assess air quality consist of two main categories of air pollutants: Total Suspended Particulate Matter (TSPM) or Suspended Particulate Matter (SPM), and gaseous pollutants.
Sampling
High-volume air sampling is conducted using a specialized air sampler suitable for monitoring air quality both in a workspace environment and in the ambient air outdoors. Particulate matter is measured by directing air at a high flow rate of 0.9 to 1.4 cubic meters per minute through a highefficiency filter media that captures the particles. The standard AC electrical blower from Rally Wolf tools, with a free flow of 1.4 to 1.8 cubic meters per minute, is typically employed to generate the required suction pressure.
Particulates
Once the sampled air volume is known over a period, the gravimetric determination of collected particulates is established by measuring the increase in the weight of the filter paper due to sampling. Gaseous pollutants are absorbed using a suitable absorbing reagent and analyzed spectrophotometrically [5] .
NOx
For the determination of nitrogen dioxide in the atmosphere (Jacob and Hochheiser's method), 10 ml of the sampled absorbing medium are placed in a 50 ml volumetric flask. One ml of H2O2 solution, 10 ml sulfanilamide solution, and 1.4 ml NEDA solution are added to the volumetric flask. A control absorbing medium with these chemicals is used for comparison. The volumetric flask is shaken and left to stand for 20 minutes to allow color development. Transmittance is measured at 540 mm [6] .
SOx
To determine sulfur dioxide in the atmosphere (Weast and Geake method), 10 ml of the sampled absorbent sodium tetrachloromercurate solution is placed in a volumetric flask. Subsequently, 1 ml of sulphamic acid, 2 ml of formaldehyde solution, and 5 ml of roaniline are added one by one. The solution is gently shaken, and after 30 minutes, transmittance is determined at 550 mm using a spectrophotometer. In the control (blank), the sampled absorbing medium is replaced. The concentration of SO2 is determined by incorporating the transmittance (%) value into the calibrated standard curve [7][8][9][10] .
Air Quality Index (AQI) Air Quality Index (AQI) is a common measure of air pollution used globally. It can be calculated using the following equation:
Results and Discussion
The concentration of key parameters (in µg/m 3 of sampled air) across the 2 sites, and their variation across the different time periods are compared with ambient air quality standards in Tables 234567. [11] Color The study revealed that both SOx and NOx values during the Diwali period increased to almost twice their value before Diwali. The values did subsequently fall post-Diwali but did not return to their pre-Diwali levels during the current study's 5-day period. The overall pollution levels of Dehradun being comparatively lower in terms of industrial air pollutants, these values still remained within the daily prescribed limits as per Ambient Air Quality Standards and are therefore not as alarming.
Table 1: Minerals Used in Fireworks
The particulates, on the other hand, increased 2-2.5x their normal values and exceeded the ambient air quality standards. These values also did not return back to their pre-Diwali levels but their decrease was more rapid compared to SOx and NOx levels.
The AQI measures paint an even more grim picture. The overall categorization of Dehradun even during pre-Diwali period is in the moderate range. On the days 3-5, this falls to poor across both the regions under the study. Relatively speaking, the clock tower area, which falls in the central business and commercial district of the city, recorded worse measurements across all the parameters. This was anyways expected due to the higher vehicular traffic as well as population density in the area. Elevated levels of PM10 and PM2.5 pose severe environmental and health risks. These fine particulate matter fractions contribute to respiratory diseases, cardiovascular problems, and overall compromised air quality. Mitigating their impact is imperative for safeguarding public health and fostering a sustainable environment.
Moving forward, research endeavors should focus on determining the chemical components linked to different size fractions of particulate matter (PM). This approach will enhance our comprehension of the carcinogenic properties inherent in these particles. Additionally, it is crucial to conduct epidemiological studies aimed at identifying the distinct health effects associated with fireworks.
Figures and tables from the paper
| Dates | Clock Tower | Nehru Colony | Standard [12] |
|---|---|---|---|
| 17.10.21 | 16.78 | 14.5 | 80 |
| 18.10.21 | 18.6 | 16.4 | |
| 19.10.21 | 17.22 | 15.2 | |
| 20.10.21 | 15.2 | 14.2 | |
| 21.10.21 | 21.26 | 18.62 | |
| 22.10.21 | 24.34 | 20.87 | |
| 23.10.21 | 23.64 | 22.45 | |
| 24.10.21 | 26.84 | 24.62 | |
| 25.10.21 | 24.62 | 20.46 | |
| 26.10.21 | 27.48 | 23.62 | |
| 27.10.21 | 24.6 | 18.42 | |
| 28.10.21 | 21.64 | 16.48 | |
| 29.10.21 | 23.4 | 19.1 | |
| 30.10.21 | 18.4 | 16.4 | |
| 31.10.21 | 17.22 | 17.84 |
Table text extracted from the original PDF; superscript letters are shown inline. The original table image is below.
View original table image
| Dates | Clock Tower | Nehru Colony | Standard [12] |
|---|---|---|---|
| 17.10.21 | 23.46 | 16.2 | 80 |
| 18.10.21 | 23.68 | 20.6 | |
| 19.10.21 | 25.64 | 22.66 | |
| 20.10.21 | 23.24 | 23.65 | |
| 21.10.21 | 32.68 | 29.3 | |
| 22.10.21 | 37.54 | 32.64 | |
| 23.10.21 | 35.6 | 35.62 | |
| 24.10.21 | 39.48 | 37.48 | |
| 25.10.21 | 33.6 | 31.48 | |
| 26.10.21 | 36.74 | 33.48 | |
| 27.10.21 | 32.4 | 28.46 | |
| 28.10.21 | 27.58 | 25.62 | |
| 29.10.21 | 31.62 | 27.6 | |
| 30.10.21 | 26.52 | 24.62 | |
| 31.10.21 | 24.4 | 25.68 |
Table text extracted from the original PDF; superscript letters are shown inline. The original table image is below.
View original table image
| Dates | Clock Tower | Nehru Colony | Standard [12] |
|---|---|---|---|
| 17.10.21 | 122.3 | 102.5 | 100 |
| 18.10.21 | 126.32 | 106.4 | |
| 19.10.21 | 128.68 | 110.3 | |
| 20.10.21 | 121.64 | 108.64 | |
| 21.10.21 | 138.62 | 126.3 | |
| 22.10.21 | 142.8 | 134.2 | |
| 23.10.21 | 148.64 | 142.65 | |
| 24.10.21 | 232.42 | 250.64 | |
| 25.10.21 | 210.3 | 195.74 | |
| 26.10.21 | 224.65 | 208.62 | |
| 27.10.21 | 184.62 | 178.62 | |
| 28.10.21 | 167.42 | 154.65 | |
| 29.10.21 | 155.26 | 146.24 | |
| 30.10.21 | 142.3 | 132.48 | |
| 31.10.21 | 130.64 | 126.42 |
Table text extracted from the original PDF; superscript letters are shown inline. The original table image is below.
View original table image
| Dates | Clock Tower | Nehru Colony | Standard [12] |
|---|---|---|---|
| 17.10.21 | 58.95 | 50.62 | 60 |
| 18.10.21 | 60.22 | 52.62 | |
| 19.10.21 | 62.84 | 55.64 | |
| 20.10.21 | 57.62 | 53.65 | |
| 21.10.21 | 66.48 | 62.42 | |
| 22.10.21 | 69.42 | 66.56 | |
| 23.10.21 | 71.62 | 69.78 | |
| 24.10.21 | 105.5 | 102.52 | |
| 25.10.21 | 90.5 | 86.48 | |
| 26.10.21 | 93.46 | 90.26 | |
| 27.10.21 | 78.62 | 72.24 | |
| 28.10.21 | 72.23 | 66.48 | |
| 29.10.21 | 68.94 | 63.65 | |
| 30.10.21 | 63.42 | 59.5 | |
| 31.10.21 | 60.16 | 57.86 |
Table text extracted from the original PDF; superscript letters are shown inline. The original table image is below.
View original table image
| Dates | Clock Tower | Nehru Colony |
|---|---|---|
| 17.10.21 | 115 | 102 |
| 18.10.21 | 118 | 104 |
| 19.10.21 | 119 | 107 |
| 20.10.21 | 114 | 106 |
| 21.10.21 | 126 | 118 |
| 22.10.21 | 131 | 123 |
| 23.10.21 | 139 | 133 |
| 24.10.21 | 252 | 242 |
| 25.10.21 | 202 | 188 |
| 26.10.21 | 212 | 201 |
| 27.10.21 | 162 | 152 |
| 28.10.21 | 145 | 136 |
| 29.10.21 | 137 | 131 |
| 30.10.21 | 128 | 122 |
| 31.10.21 | 119 | 117 |
Table text extracted from the original PDF; superscript letters are shown inline. The original table image is below.
View original table image
| Range | Category | Implications |
|---|---|---|
| 0-50 | Good | Minimal Impact |
| 50-100 | Satisfactory | Minor breathing discomfort to sensitive people |
| 100-200 | Moderate | Breathing discomfort to the people with lungs, asthma and heart diseases |
| 200-300 | Poor | Breathing discomfort to most people on prolonged exposure |
| 300-400 | Very Poor | Affects healthy people and seriously impacts those with existing diseases |
| 400+ | Severe | Respiratory illness on prolonged exposure |
Table text extracted from the original PDF; superscript letters are shown inline. The original table image is below.
View original table image
References
8 in the original paper- Chatterjee C, Sarkar A, Adak U, Mukherjee SK, Ghosh Raha A. Ambient air quality during Diwali festival over Kolkata: A Mega-City in India. Aerosol and Air Quality Research. 2013;13(13):1133-1144.
- Thakur B, Chakraborty S, Debsarkar A, Chakrabarty S, Srivastava RC. Air pollution from fireworks during festival of lights (Deepawali) in Howrah, India: A case study. Atmosfera, 2010, 23(4).
- Dhananjayan T, Nithul Lal KP, Karthikeyan K. A study on air quality status during Diwali festival at Bhuj city, Kachchh district, Gujarat, Western India. Asian Journal of Science and Technology. 2015;6(6):1482-1486.
- Woodruff TJ, Grillo J, Schoendorf KC. The relationship between selected causes of postneonatal infant mortality and particulate air pollution in the United States. Environmental Health Perspectives, 1997, 105.
- Gordian ME, Ozkaynak H, Xue J, Morris SS, Spengler JD. Particulate air pollution and respiratory diseases in Anchorage, Alaska. Environmental Health Perspectives, 1996, 103.
- Zaiidudin A, Siddiqui NA. AIR quality index (AQI): A tool to determine ambient air quality. Poll Res. 2006;25(4): 885-887.
- Singh G. An index to measure depreciation in air quality in some coal mining areas of Kobra industrial belt of Chattisgarh, India. Jr. of Environ. Science and Engg. 2009;49(1):77-86.
- Gazette of India. National Ambient Air Quality Standards. Central Pollution Control Board Notification. 2009;3(4):3-4.