
Research article · 2024 · Full text
International Journal of Agriculture Extension and Social DevelopmentImpact of value addition of agricultural products training programmes
Volume 7(1) · Pages 105–112 · DOI: 10.33545/26180723.2024.v7.i1b.193 ↗
Research areasAgricultural Economics and PracticesSocial and Economic Development in IndiaLivestock Management and Performance Improvement
Abstract
Author-writtenThe details of the value addition technologies developed at CSC & RI, Madurai was collected and segregated depending upon the different food groups, types of value added products developed, mode of trainings which includes on campus, off campus, vocational, entrepreneurial development training. Moringa products, Mushroom products, Milk products, Bakery products, Ready to use products, Spices mixers, Value addition of vegetables, Pickles, Value addition of pulse based foods, Functional foods, Packaging of fresh products, Extruder products and Technologies for production of germinated foods .An interview schedule was prepared in such a way to collect the detailed information on general particulars of the entrepreneurs before and after establishing food related commercial venture. The interview schedule was used to collect data on effectiveness of value addition technologies, type of training programmes conducted and reach of training programmes etc., for the last 10 years in different departments at CSC & RI, Madurai and in KVK's of various districts. Identification of successful trainings/ demand based trainings programmes and identification of trainees involved in entrepreneurial activities were also collected. Apart from this participatory rural appraisal techniques were also used for collecting the data on impact and constrains faced by the trainees. The relevant data obtained for this study were statistically analyzed interpreted and meaningful impact was gathered.
Summary
Source-checkedPlain-language reading of the full paper, prepared with AI and checked against the text. Each point links to the authors' own words.
Why it matters
- Agriculture is a critical sector in India, with approximately 80% of the population depending on it either directly or indirectly. View evidence ↗
- Agricultural processing is primarily intended to lower post-harvest losses and ensure that growers receive more profitable prices for their products. View evidence ↗
- Value-added agriculture is driven by the market and requires a skilled workforce to meet the demands of rapidly evolving markets. View evidence ↗
The question
- The study aimed to evaluate the effectiveness, types, and reach of value addition training programs conducted over the last 10 years at CSC & RI, Madurai and various KVKs. View evidence ↗
What they did
- The research was conducted across 11 purposively selected districts in the state of Tamil Nadu. View evidence ↗
- The study focused on a sample size of 32 entrepreneurs. View evidence ↗
- Attitude was assessed via a schedule of 14 statements (7 positive, 7 negative) with responses categorized as agree, undecided, or disagree. View evidence ↗
What they found
- The majority of the entrepreneurs (59.40%) were in the middle age group, followed by young (37.5%) and old (27.50%) groups. View evidence ↗
- All entrepreneurs were educated, with 56.25% having collegiate education and 43.75% having secondary education. View evidence ↗
- 100% of the entrepreneurs in the study were categorized as having a high annual income. View evidence ↗
- Regarding training frequency, 43.76% of entrepreneurs attended one training, 31.25% attended two, and 25.00% attended three. View evidence ↗
- Age had a significant negative relationship with the knowledge level of beneficiaries regarding value addition training. View evidence ↗
- The selected variables explained 68.00% of the variation in the knowledge level of the participants. View evidence ↗
What it means
- The authors conclude that the training programs successfully improved the knowledge levels and fostered a favorable attitude toward value addition technologies among the majority of beneficiaries. View evidence ↗
- The authors recommend that future training programs should incorporate packaging technologies, cost-benefit analysis, and loan project preparation. View evidence ↗
Visual summary
2 visualsIllustrations explain the paper; charts are replotted from the paper's own table values.
Per cent: Young (up to 35 years) vs Middle (36 to 68 years) vs Old (more than 68 years)
Replotted from Table 4 (page 4) of the original paper. Every bar is the paper's own table value.
View source evidence ↗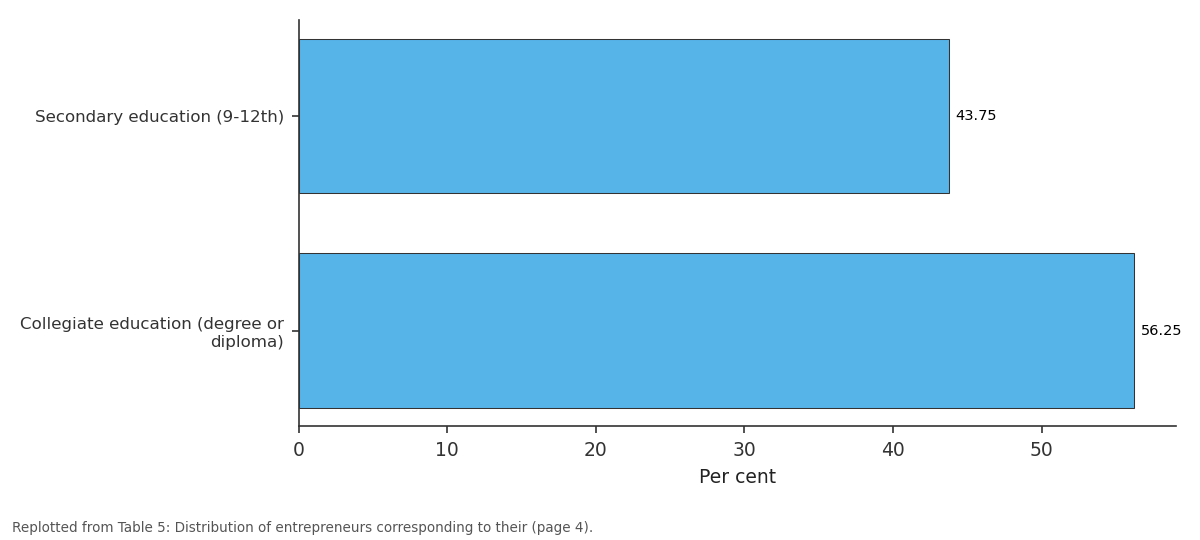
Per cent / -: Secondary education... vs Collegiate education...
Replotted from Table 5 (page 4) of the original paper. Every bar is the paper's own table value.
View source evidence ↗Figures & tables
From the original paper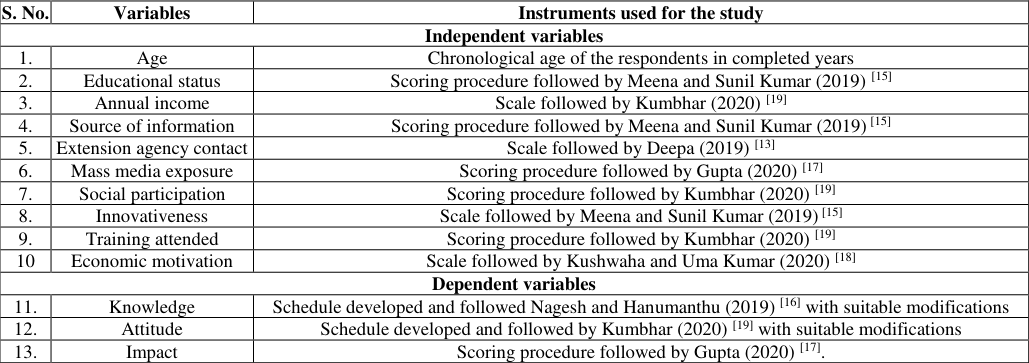 Table 1
 Table 2
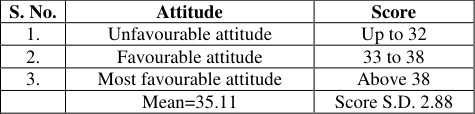 Table 3
 Table 4
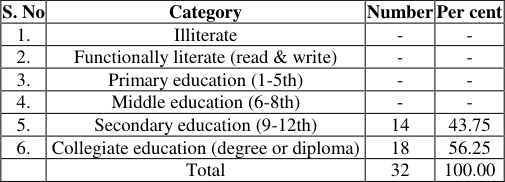 Table 5
 Table 6
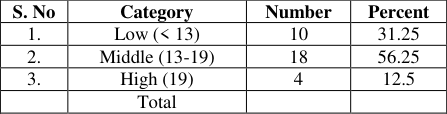 Table 9
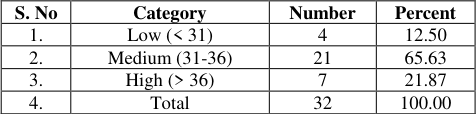 Table 7
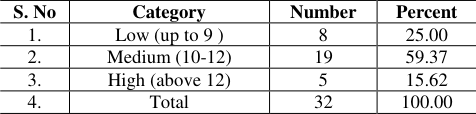 Table 8
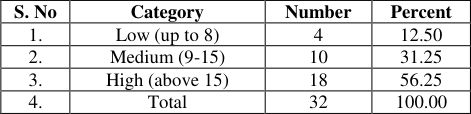 Table 10
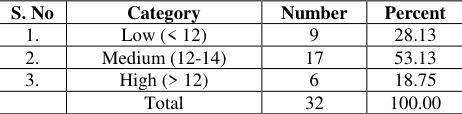 Table 11
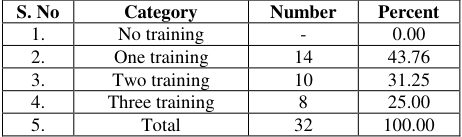 Table 12
Introduction
India is an agriculture based country, as about 80 per cent of the Indian population depend on agriculture directly or indirectly. After Independence India has given a proper attention to uplift the agriculture activity by adopting various technologies related to agriculture. As a part of attention several state and central level agriculture universities, laboratories etc were established under the observation of ICAR. This developments brought several revolutions like green Revolution, White Revolution, Blue Revolution etc and given more strength to Indian food security. (Rao, 2007) [4] . As per recommendation of the second Education commission (1964-66) headed by Dr. D.S. Kothari, an institution name as "Agricultural polytechnics" was set to provide technical agriculture education to a large number of boys and girls coming from rural areas. Same type of step was considered essential to produce skilled workers, artisans and technicians in agriculture field for supporting services needed by the farmers, extension organizations and primary agro-industries. Thus, the primary objectives of processing are aimed at reducing the postharvest losses and to provide remunerative prices to growers. The national agriculture policy identifies food processing as a major segment and set an objective of increasing the food processing from existing 2% to 10% and value addition from 7% to 35% by 2013. According to USDA6, a change in the physical state or form of the product such as milling wheat into flour or making strawberries into jam that enhances its value, which should have unique attribution that goes beyond what is generally found in the conventional market 3. The fortified products will improve palatability, food processing value and shelf life of the raw materials. It should form a part of the community development programme.
Value-added agriculture is fundamentally market-driven. It needs trained and skilled manpower to cope up with the demand of rapidly changing markets.Amanor-Boadu1 reported that value-added business tend to be closer to the consumers, playing in highly competitive markets where speed and accuracy are imperative, which requires the government support through building institutions, market information, skilled manpower, capital formation and technology. Keeping the importance of value added products, vocational training programme was conducted for the rural women to know the extent of knowledge gained by the rural women in relation to food processing and value addition of food grains, fruits and vegetables.
Review of Literature 2.1. Review of the training impact
Training provides whatever additional specific items of knowledge, skill or attitude they need to perform up to that standard. Training is conducted whenever an individual engages in an activity that results in the ability to exercise a skill that he does not previously have. Training means to educate a person so as to be fitted, qualified and proficient in doing some job. It is a process which includes a sequence of experiences, a series of opportunities to learn, in which trainee is exposed in some more or less systematic way to certain materials or events. Basically training is intended to help individuals to learn and to bring a desired standard of efficiency, condition and behaviour (Meena et al., 2012) [2] . Rural women in our country share abundant responsibilities and perform a wide spectrum of duties in running the family. Prepare food and feed all the family members to fulfill their nutritional requirement is one of the important job they perform. Besides this they also earn wedges and honoured to be partner in their family income by utilizing their spare time. Government of India started Krishi Vigyan Kendra at district / taluka level to provide training in agriculture, animal science, home science, fishers etc. to cater the above said need. It is also necessary to evaluate the knowledge of the participants in order to know the effectiveness of the training and update future trainings on that basis. Krishi Vigyan Kendra, Navsari Agricultural University, Navsari conducted four days on campus training in area of food processing. Value addition in papaya was one of the topic. The present study was therefore undertaken to evaluate the gain in knowledge of the participants on the specific aspect (Sai, 2008) [1] . Khushvir Singh et al., (2020) [22] conducted a study to determine the effectiveness of fish farming vocational training programs on knowledge gain by rural youth, farmers and farm women. The results clearly indicated that vocational training on fish farming was effective in enhancing the knowledge of trainees. Kalsariya et.al (2015) [9] reported that Training is critical input for the farmers for quick transfer of technology and a way to improve their agriculture and uplift their socioeconomic condition. Thus, the importance of training as an indispensable instrument for human resource development at any level cannot be ignored. Manoj Sharma et al., (2014) [3] reported that the average herd size with dairy farmers increased from 7.68 to 9.21 after the training. Knowledge level of trainees in breed characteristics, disease management, feed management etc. also increased. Number of trainees having knowledge about feed preparation technology increased from 6.67 to 100.00 per cent. Average knowledge score of the trainees increased from 3.64 to 6.39. The acquired knowledge farmers actually applied at their farms, which resulted in enhancement of their daily income. Pradeep manyam et al., (2020) [21] reported that a study was undertaken, aimed at the impact of capacity building programmes, adoption rate of mushroom cultivation and constraints faced in running small scale mushroom cultivation. A total of 250 randomly selected respondents over five years (2015-16 to 2019-20) of implementing capacity building programmes and demonstrations by Krishi Vigyan Kendra, Nellore district were evaluated. Irrespective of caste, urban (46.80%) and rural (53.2%) participants showed equal interest in attending training programmes. The average change in perception level of respondents on major aspects of mushroom cultivation before and after trainings and demonstration was observed to be 72.24%.
Majority of the respondents (63.6%) expressed to establish mushroom enterprise as the reason for attending training programme, though the average adoption rate was very less (22.63%). Mahesh Kadagi et al., (2020) [20] reported that a study was undertaken with an objective to assess the impact of skill up gradation training on knowledge gain and adoption of technologies in Sheep and Goat rearing. Six trainings were organized by Krishi Vigyan Kendra, Bagalkote during the year 2018-19 and 2019-20. The participants were farmers, farm women and youths who have interest in sheep and goat rearing as self-employment. The impact of the training was assessed by pre and post evaluation testing in terms of improvement in knowledge for different parameters. It was observed that 53.65, 51.74, 49.13 and 61.66 per cent of the trainees gained knowledge on types of different breeds of sheep and goats, sheep and goat shelter, Feed and fodder and Animal Health maintenance after training. Sixty-three per cent (109 trainees) of them have adopted the technologies learnt in the training by newly starting sheep and goat enterprises or expanding the existing unit and in that 47.4 percent started with ram fattening.
Materials and Research methods
Materials and Research methods
Research design of the study
A research design is the set of methods and procedures used in collecting and analyzing measures of the variables specified in the research problem research.
Andrew B Kirumbi
The current study was constricted to "ex-post facto" design as independent variables are operated earlier in the study area.
Locale of the research
Locale of the research gives a complete idea regarding the situation in which the study has been carried out. Tamil Nadu state was purposely selected for the study because the trainees and the entrepreneurs belongs to the same state. The procedure and reasons for selecting area of the study and sampling methods were given in sampling procedure.
Sampling procedure 3.2.1. Selection of district
The current study was carried out in 11 districts of Tamil Nadu state was selected purposively looking to the entrepreneurs.
Selection of the respondents
The trainees who attended training programmes at CSC & RI, Madurai and taken up the successful food related business in 11 districts of Tamil Nadu state was selected.
Location
Namakkal, Chennai, Madurai, Ramnad, Salem, Karur Coimbatore, Cuddalore, Pollachi, Thirunelveli and Erode were selected.
Selection, operationalization and measurement of variables 3.3.1. Selection of variables
The variables were selected by the opinion of the judges. The operational definition and measurement procedure followed for the variables are presented below in Table 1. www.extensionjournal.com Educational status Scoring procedure followed by Meena and Sunil Kumar (2019) [15] 3.
| S. No. | Variables | Instruments used for the study |
|---|---|---|
| Independent variables | ||
| 1. | Age | Chronological age of the respondents in completed years |
| 2. | Educational status | Scoring procedure followed by Meena and Sunil Kumar (2019) [15] |
| 3. | Annual income | Scale followed by Kumbhar (2020) [19] |
| 4. | Source of information | Scoring procedure followed by Meena and Sunil Kumar (2019) [15] |
| 5. | Extension agency contact | Scale followed by Deepa (2019) [13] |
| 6. | Mass media exposure | Scoring procedure followed by Gupta (2020) [17] |
| 7. | Social participation | Scoring procedure followed by Kumbhar (2020) [19] |
| 8. | Innovativeness | Scale followed by Meena and Sunil Kumar (2019) [15] |
| 9. | Training attended | Scoring procedure followed by Kumbhar (2020) [19] |
| 10 | Economic motivation | Scale followed by Kushwaha and Uma Kumar (2020) [18] |
| Dependent variables | ||
| 11. | Knowledge | Schedule developed and followed Nagesh and Hanumanthu (2019) [16] with suitable modifications |
| 12. | Attitude | Schedule developed and followed by Kumbhar (2020) [19] with suitable modifications |
| 13. | Impact | Scoring procedure followed by Gupta (2020) [17]. |
Table text extracted from the original PDF; superscript letters are shown inline. The original table image is below.
View original table image
Annual income Scale followed by Kumbhar (2020) [19] 4.
Source of information Scoring procedure followed by Meena and Sunil Kumar (2019) [15] 5. Extension agency contact Scale followed by Deepa (2019) [13] 6.
Mass media exposure Scoring procedure followed by Gupta (2020) [17] 7.
Social participation Scoring procedure followed by Kumbhar (2020) [19] 8.
Innovativeness Scale followed by Meena and Sunil Kumar (2019) [15] 9.
Training attended Scoring procedure followed by Kumbhar (2020) [19] 10 Economic motivation Scale followed by Kushwaha and Uma Kumar (2020) [18] Dependent variables 11. Knowledge Schedule developed and followed Nagesh and Hanumanthu (2019) [16] with suitable modifications 12.
Attitude Schedule developed and followed by Kumbhar (2020) [19] with suitable modifications 13.
Impact Scoring procedure followed by Gupta (2020) [17] .
Operationalization and measurement of dependent variables
Assessing the knowledge and attitude of the entrepreneurs 3.4.1. Knowledge Twenty-five questions were used to assess knowledge of entrepreneurs. The questions were objective in nature such as fill-in-the-blanks, multiple choice and yes/no statements, with a score of one for correct answers and zero for incorrect answers. Each overall knowledge score was obtained by adding the number of items properly answered by each individual respondent. There was a maximum score of 25 and a minimum score of 0. Based on the mean and standard deviation, the entrepreneurs were divided into three groups. High level knowledge > Mean + S.D
Attitude
To realize the attitude of entrepreneurs in value addition technologies, schedule was developed. Schedule consists 14 statements, includes 07 positive and 07 negative. The response of the entrepreneurs was noted as 'agree', 'undecided' and 'disagree'. The positive statements were given score 3 for agree, 2 for undecided and 1 for disagree and reverse in case of negative statements. Considered the total score, entrepreneurs were grouped on the basis of Mean ± Standard deviation into three categories such as unfavourable attitude, favourable attitude and most favourable attitude as given below.
Assessment of the Direct and Indirect impact of the training interventions
The consequences as the changes that occur within a social system as a result of adoption or rejection of an innovation. They also defined the direct consequences as the changes that occur in immediate response to an innovations and indirect consequences are the changes that occur, siya result of direct continuities.
Rogers and shoemakers
The impact was investigated in terms of direct and indirect consequences. The entrepreneurs were asked to complete a set of 31 statements. Agree/disagree was utilized as a dichotomous scoring system. The entire score for each item was added together and a percentage analysis was carried out.
Devices used for data collection 3.5.1. Interview Schedule
The study required details on variables from entrepreneurs. Hence, an interview schedule was viewed as most suitable tool for collection of data. The interview schedule was prepared with the study's objectives in mind.
Schedule construction
A complete, systematic interview schedule covering all elements was prepared based on the objectives and variables under the study. This includes the most relevant, straight forward, and practical questions that were appropriate for all entrepreneurs while eliminating irrelevant ones. There were five parts in the interview schedule. a) Comprises information about the entrepreneurs' general characteristics as well as other relevant information about the independent variables. b) Contains knowledge gained by the entrepreneurs regarding value addition trainings. c) Had a attitude of entrepreneurs towards value addition trainings. d) Consists of Impact of value addition trainings. e) Covered the problems encountered by the entrepreneurs and their suggestions.
Pre-testing
The interview schedule was pre-tested in a non-sampling region before being finalised. Following pre-testing, any irregularities discovered were corrected and the interview schedule was finalized. www.extensionjournal.com
Data Collection
The information was gathered by personally interviewing the entrepreneurs.
Preparation of report
The data was coded, tabulated, analyzed and presented in the form of tables once it was completed, in order to make the findings relevant. The findings occurred from the analysis were correctly interrupted and conclusions were drawn accordingly.
Statistical procedures 3.6.1. Frequency and percentage
For making elementary comparisons, frequency and percentage are used. The frequency of the specific category was multiply by hundred and divide by number of total entrepreneurs to get percentage.
Arithmetic mean (x)
Arithmetic mean is the summation of a group of numbers divided by the count of numbers in the group. The formula is given below,
Where, X = Arithmetic mean Exi=Total number of scores obtained by beneficiarie N=Total number of entrepreneurs
Standard deviation
The square root of mean of the sum of squares of the deviation taken from the mean of the distribution.
Correlation coefficient
Correlation coefficient was used to find out the relationship between two variables (viz. independent and dependent). Following formula was used for computation of 'r' value.
The formula is as follows,
Where, Exy Ex² Ey² Σ(x-x) (y -y) √Σ(x-x)²Σ(y -y)² R = Correlation coefficient. X = Independent variables. Y Dependent variable. Old (more than 68 years) 1 3.13 32 100.00
Profile of the beneficiaries 3.7.1. Age
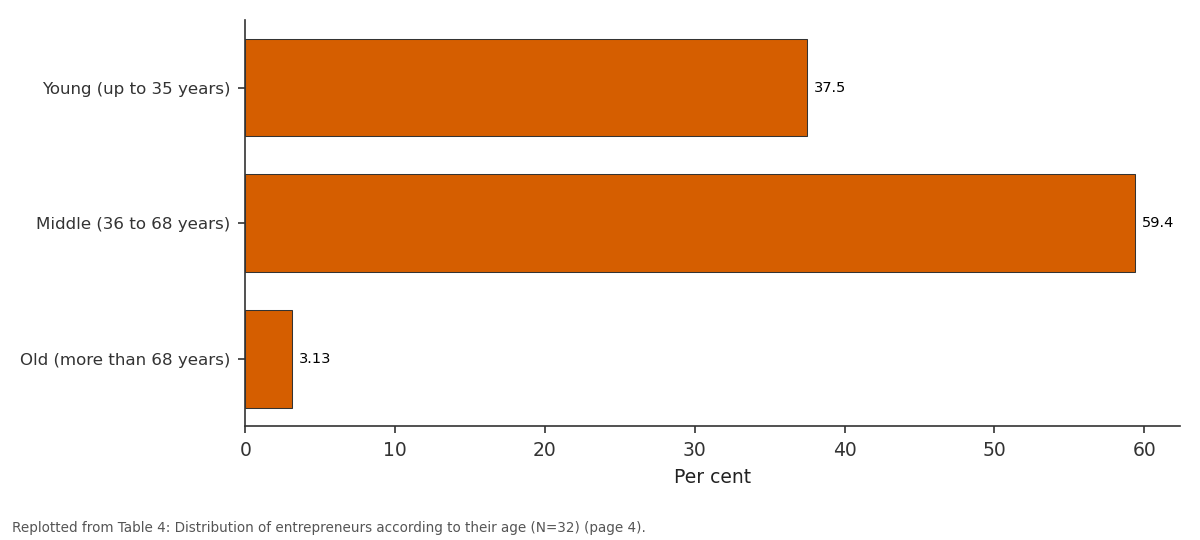
Table 4 shows that more than half (59.40 per cent) of the entrepreneurs comes under middle age group followed by young (37.5 per cent) and old (27.50 per cent) aged groups.
| S. No | Category | Number | Per cent |
|---|---|---|---|
| 1. | Young (up to 35 years) | 12 | 37.5 |
| 2. | Middle (36 to 68 years) | 19 | 59.40 |
| 3. | Old (more than 68 years) | 1 | 3.13 |
| 32 | 100.00 |
Table text extracted from the original PDF; superscript letters are shown inline. The original table image is below.
View original table image
From the above table, it could be concluded that it was rather usual for middle-aged entrepreneurs to be actively involved in farm activities and these entrepreneurs had a free hand in financial concerns allowing them to make their own decisions and put their ideas into action. Entrepreneurs in their age of forties and fifties were passionate, had some business experience and worked more efficiently. Also, middle-aged people have more physical energy and a greater sense of responsibility for their families than other age groups. The younger generation is more drawn to career chances in adjacent cities as a result of their education. These findings matched those of Thirumoorthy, and Geetha (2018) [12] .
Educational Status
Education is widely regarded to have a positive impact on a person's mental horizon, preparing or predisposing him to be receptive to new ideas. Teaching, training, conversation and focused study are all examples of educational practices. The explanation for this could be that the all the entrepreneurs (100 per cent) are educated due to the proximity of schools and universities nearby places. These findings matched those of Thirumoorthy and Geetha (2018) [12] and Swain and Mamata (2015) [10] . www.extensionjournal.com [8] and Kotwal and Manisha Eknath (2009) [4] .
Annual income
Annual income
Source of information
Information sources are crucial in the transfer of a scheme from the government to farmers. The more a farmer is exposed to the media, the more knowledge and information will receive. Anything that might informs a person about something on provide knowledge to somebody. Information sources may be observations, people speeches, documents, pictures, organizations etc. Farmers generally rely upon other farmers and sources for information sharing and receiving.
The information seeking behaviour of the farmers has been measured in terms of various localized sources, institutional sources and banks. The data depicted in table 7 revealed that more than twothird (65.63per cent) of the entrepreneurs had medium level of source of information followed by low (12.50 per cent) and high (21.87per cent) respectively.
| S. No | Category | Number | Percent |
|---|---|---|---|
| 1. | Low (< 31) | 4 | 12.50 |
| 2. | Medium (31-36) | 21 | 65.63 |
| 3. | High (> 36) | 7 | 21.87 |
| 4. | Total | 32 | 100.00 |
Table text extracted from the original PDF; superscript letters are shown inline. The original table image is below.
View original table image
Extension agency contact
The degree to which farmers used to keep touch with extension agencies is referred to as extension agency contact. Farmers may benefit from contact with extension agencies in order to get knowledge and motivation for adoption. From the table 8 observed that more than two-fifth (59.37 per cent) of the entrepreneurs comes under medium level of extension agency contact followed by those belonged to low (25.00 per cent) and high (15.62 percent) of extension agency contact. Low and medium levels of extension contact were likely due to a combination of factors including a medium level of literacy, awareness of extension agents. The findings of Jayathilaka and Abeynayake (2013) [7] was similar the current.
| S. No | Category | Number | Percent |
|---|---|---|---|
| 1. | Low (up to 9 ) | 8 | 25.00 |
| 2. | Medium (10-12) | 19 | 59.37 |
| 3. | High (above 12) | 5 | 15.62 |
| 4. | Total | 32 | 100.00 |
Table text extracted from the original PDF; superscript letters are shown inline. The original table image is below.
View original table image
Mass media exposure
Accuracy, consistency, efficiency, security, usability, reliability, accessibility, objectivity, understand ability, timeliness, completeness, conciseness, usefulness, reputation, and value-added were all recognised by mass media exposure.
It is evident from the table 9 that more than half of the entrepreneurs (56.25 per cent) of the had medium level of mass medium exposure followed by 31.25 per cent had low level of mass media exposure and 12.5 per cent had high level of mass media exposure. The majority of entrepreneurs had a medium level of mass media exposure indicating that they were reliant on it not only as a source of news and information, but also as a source of amusement and leisure. Low and medium use of mass media, which is frequently referred to as media bias. It may be linked to a lack of interest, time, awkward timings and irrelevant information of the programme. This study's findings support Kangale et al., (2016) [11] conclusions.
| S. No | Category | Number | Percent |
|---|---|---|---|
| 1. | Low (< 13) | 10 | 31.25 |
| 2. | Middle (13-19) | 18 | 56.25 |
| 3. | High (19) | 4 | 12.5 |
| Total |
Table text extracted from the original PDF; superscript letters are shown inline. The original table image is below.
View original table image
Innovativeness
The readiness of an individual to learn about new things, concepts and facts linked to scheme as well as the extent to which he will implement these things in agriculture is a significant aspect in scheme adoption. People that are more innovative are able to do tasks more quickly and precisely than others. Another factor could be that the majority of entrepreneurs have a medium annual income. This plainly demonstrates that farmers have a decent level of living. All of these things could have played a role in their medium level of innovativeness.
Training attended
Training is the process of teaching or developing skills, knowledge, or fitness is oneself or others that are related to specific valuable competencies. The purpose of training is to increase one's capability, capacity, productivity and performance. From table 12 revealed that more than forty per cent (43.76 per cent) of the entrepreneurs had undergone one training followed by 31.25 per cent had undergone two trainings and 25.00 percent of those undergone three trainings. This could be due to the agriculture colleges, KVKs and agriculture department's ability to recruit and train trainees. The above findings were in line with the findings with the Goudappa et al., (2012) [5] .
| S. No | Category | Number | Percent |
|---|---|---|---|
| 1. | No training | - | 0.00 |
| 2. | One training | 14 | 43.76 |
| 3. | Two training | 10 | 31.25 |
| 4. | Three training | 8 | 25.00 |
| 5. | Total | 32 | 100.00 |
Table text extracted from the original PDF; superscript letters are shown inline. The original table image is below.
View original table image
Relationship between selected profile with their level of knowledge and attitude 3.8.1. Relationship between beneficiary profile and their knowledge level.
Out of ten independent variables studied educational status, extension agency contact, source of information, innovativeness, training attended, economic motivation and mass media exposure had a positively significant relationship at one per cent level of probability, Social participation and annual income had positively significant relationship at five per cent level of probability. Age was negative and significant relationship at one per cent level of probability with the beneficiaries' knowledge level about value addition training programmes.
The R² value was 0.680, which intimated that 68.00 per cent variation in the knowledge level was explained by the fifteen variables selected for this study.
Relationship between beneficiary profile and their attitude level
Out of ten independent variables studied educational status, extension agency contact, source of information, training attended, economic motivation and mass media exposure had a positively significant relationship at one per cent level of probability. Innovativeness and income had positively significant relationship at five per cent level of probability. Age was negative and significant relationship at one per cent level of probability with the beneficiaries' attitude level about value addition training progrmmes. The R² value was 0.622, which intimated that 62.20 per cent variation in the attitude level was explained by the ten variables selected for this study,
Summary
The majority of the beneficiaries had improved their existing knowledge on value addition training programmes and switched to diversified product preparation. They even went out and bought more equipments for value added product preparation. The beneficiaries focused on purchasing of raw material and advancement of packaging items. It's also worth noting that the majority of them paid off their prior loans and put their extra money into for expanding their food industry development. Majority of the entrepreneurs re-modelled their previous equipments to the recent advanced equipments. The majority of the recipients earned social prestige and opinion leadership, which has enhanced their engagement in social functions and other organizational activities.
Conclusion and Recommendations
Conclusion and Recommendations
Acknowledgement
My deepest gratitude goes to the Dean, Professor and Head of various departments of Community Science College and Research Institute, KVKs of TNAUs for their support in providing necessary documents and reports during the review process, insightful comments and supports. Next, the author would also like to express his heartfelt gratitude to Tamil Nadu Agricultural University, Coimbatore for the valuable assistance for successfully complete the research works.
Declaration
I, hereby declare that this article entitled on Impact of value addition of agricultural products training programmes is my own original work and has not been published by/in any other local or international publishers, and that all sources of materials used for the study have been fully acknowledged.
Figures and tables from the paper
| SL. No | Category | Scores |
|---|---|---|
| 1. | Low level of knowledge | < Mean -S.D |
| 2. | Medium level knowledge | Mean ± S.D |
| 3. | High level knowledge | > Mean + S.D |
Table text extracted from the original PDF; superscript letters are shown inline. The original table image is below.
View original table image
| S. No. | Attitude | Score |
|---|---|---|
| 1. | Unfavourable attitude | Up to 32 |
| 2. | Favourable attitude | 33 to 38 |
| 3. | Most favourable attitude | Above 38 |
| Mean=35.11 | Score S.D. 2.88 |
Table text extracted from the original PDF; superscript letters are shown inline. The original table image is below.
View original table image
| S. No | Category | Number | Per cent |
|---|---|---|---|
| 1. | Illiterate | - | - |
| 2. | Functionally literate (read & write) | - | - |
| 3. | Primary education (1-5th) | - | - |
| 4. | Middle education (6-8th) | - | - |
| 5. | Secondary education (9-12th) | 14 | 43.75 |
| 6. | Collegiate education (degree or diploma) | 18 | 56.25 |
| Total | 32 | 100.00 |
Table text extracted from the original PDF; superscript letters are shown inline. The original table image is below.
View original table image
| S. No | Category | Number | Per cent |
|---|---|---|---|
| 1. | Low (up to Rs.50,000) | - | - |
| 2. | Medium (Rs.50,001 - Rs.1,00,000) | - | - |
| 3. | High (Rs.1,00,000 and above) | 32 | 100.00 |
| 4. | Total | 32 | 100.00 |
Table text extracted from the original PDF; superscript letters are shown inline. The original table image is below.
View original table image
| S. No | Category | Number | Percent |
|---|---|---|---|
| 1. | Low (< 12) | 9 | 28.13 |
| 2. | Medium (12-14) | 17 | 53.13 |
| 3. | High (> 12) | 6 | 18.75 |
| Total | 32 | 100.00 |
Table text extracted from the original PDF; superscript letters are shown inline. The original table image is below.
View original table image
References
13 in the original paper- Meena MS, Rajbir S, Meena HR, Meena BK. Impact Assessment of Training on Food Processing and Preservation. Indian Journal of Social Research 2012;53(2):117-122.
- Sharma M, Singh G, Keshava. Impact Evaluation of training programmes on dairy farming in Punjab State. Indian Res. J Ext. Edu, 2014, 14(1).
- Goudappa SB, Reddy BS, Chandrashekhar SM. Farmers perception and awareness about crop insurance in Karnataka. Indian Research Journal of Extension Education. 2012;12(2):218-222.
- Sundar J, Ramakrishnan L. A study on farmers' awareness, perception and willing to join and pay for crop insurance. International Journal of Business and Management Invention. 2013;2(1):48-54.
- Uvaneswaran SM, Mohanapriya T. Farmer's perception and awareness about Crop insurance in Tamil Nadu-A descriptive analysis. Intercontinental Journal of Marketing Research Review. 2014;2(3):15-22.
- Kalsariya BN, Bharad ND, Jadeja MK. Impact of Training Programme in Terms of Gain in Knowledge for Sustainable Agriculture. Guj. J Ext. Edu 2015;26(2).
- Swain, Mamata. Performance of crop yield and rainfall insurance schemes in Odisha: Some empirical findings. Agricultural Economics Research Review. 2015;28(4):201-211.
- Kangale PKD, Deshmukh AN, Deshmukh SA. Farmers perception towards crop insurance scheme. International Research of Agricultural Economics and Statistics. 2016;7(2):248-250.
- Geetha T. Awareness of farmers towards crop insurance in Erode and Namakkal districts in Tamil Nadu. International Journal of Interdisciplinary Research in Arts and Humanities (IJIRAH). 2018;3(1):3.
- Deepa N. A study on awareness and extent of utilization of crop insurance scheme in chitradurga district of Karnataka. International Journal of Agricultural Policy and Research. 2019;4(2):17-21.
- Kadagi M, Kammar MR, Arjun RS, Ashoka P. Impact of sheep and goat rearing skill training on knowledge gain and adoption of technologies. International Journal of Current Microbiology and Applied Sciences, 2020, 9(4).
- Manyam P, Jyothi SGL, Swamy NG, Lakshim TT. Mushroom cultivation understanding of knowledge gain and enterprise adoption through trainings and demonstrations. International Journal of Botany and Research (IJBR), 2020, 10(2).
- Singh K, Tanwar PS, Sohi HS. Assessment of knowledge gain by participants through vocational trainings on fish farming J Krishi Vigyan. 2020, (Special Issue):15-20.
Social participation
Emotional support, humour and levity are all provided by social participation. Participating in social events makes farmers feel as a valuable member of a society. The data presented in the table 10 revealed that majority (56.25 percent) of the entrepreneurs had high level of social www.extensionjournal.com participation, the medium level of participation had (31.25) and remaining 12.50 per cent of the entrepreneurs had low level social participation. The reasons for high social participation were interest of the member farmer to enrol themselves in organizations mainly because of motivation, social interaction, economic factors, social mobility and self-confidence which have made them to isolate themselves with high participation in formal organizations.
Table text extracted from the original PDF; superscript letters are shown inline. The original table image is below.
View original table image
Above findings matched those of Jain and Nishi (2019) [14] and Sundar and Ramakrishnan (2013) [6] .