
Research article · 2024 · Full text
International Journal of Agriculture Extension and Social DevelopmentExport performance and direction of trade of organic products from India
Volume 7(1) · Pages 113–116 · DOI: 10.33545/26180723.2024.v7.i1b.194 ↗
Research areasAgricultural Economics and PracticesGlobal Trade and Competitiveness
Abstract
Author-writtenOrganic products are produced using an ecologically and socially conscious agricultural system that does not utilise chemical pesticides or fertilisers. India produced around 2.9 million metric tonnes (MT) of certified organic products between 2022 and 2023. The volume produced included various types of food items, such as tea, coffee, oil seeds, fibre, sugar cane, cereals and millets, cotton, pulses, aromatic and medicinal plants, dry fruits, vegetables, processed meals, and so on. The goal of the current study was to determine the patterns of organic product export and trade direction in India between 2012-13 and 2021-22. Secondary data regarding export of organic products and data on country wise exports was obtained from APEDA. The Compound Annual Growth Rate model is used to predict the export trend. During the first sexennial period, organic product exports had a higher CAGR of 18.67%, whereas during the second sexennial period, exports decreased and the CAGR was around 0.99%. For the overall period, it was reported to be 16.68 per cent. Cuddy & Della Valle's instability index was used to measure the export of organic products instability index. The CDVI for the whole period of record was 20.76 percent, indicating somewhat unstable exports throughout that period of time. The dynamic nature of trade pattern of the organic products was analysed by employing first order Markov process. By TPM it was noticed that most loyal country which imports organic products was USA and Canada.
Summary
Source-checkedPlain-language reading of the full paper, prepared with AI and checked against the text. Each point links to the authors' own words.
Why it matters
- Conventional farming's heavy use of chemicals has raised sustainability concerns, making organic farming essential for addressing economic, social, and environmental issues. View evidence ↗
- India holds a significant global position in organic agriculture, ranking first in the total number of producers and sixth in organic agricultural land as of 2021. View evidence ↗
The question
- The study aimed to analyze the patterns of organic product exports and the direction of trade for India from 2012-13 to 2021-22. View evidence ↗
What they did
- The researchers used secondary data on total and country-wise organic product exports from India (2012-13 to 2021-22) sourced from the APEDA agri exchange portal. View evidence ↗
- An exponential function was used to estimate the Compound Annual Growth Rate (CAGR) of export volumes over the ten-year period and within specific sub-periods. View evidence ↗
- The Cuddy-Della Valle Instability index (CDVI) was employed to measure the stability of organic product exports by accounting for trends in the time series data. View evidence ↗
- A first-order Markov chain model was used to analyze the dynamic nature of trade patterns and structural changes in the direction of exports. View evidence ↗
What they found
- The overall export stability was categorized as 'medium unstable,' with a CDVI of 20.76% for the full period. View evidence ↗
- Analysis of the Transitional Probability Matrix showed that the USA was the most loyal importer, retaining 51.73% of its share, followed by Canada at 10.36%. View evidence ↗
- Trade direction shifted significantly, with China and Singapore losing 100% of their share to Canada, and the European Union losing 29.11% to Canada. View evidence ↗
What it means
- The authors recommend promoting exports to a wider variety of markets to reduce over-reliance on a few loyal importing countries. View evidence ↗
- To address declining production growth, the authors suggest providing farmers with training on good agricultural practices for organic cultivation. View evidence ↗
Visual summary
3 visualsIllustrations explain the paper; charts are replotted from the paper's own table values.
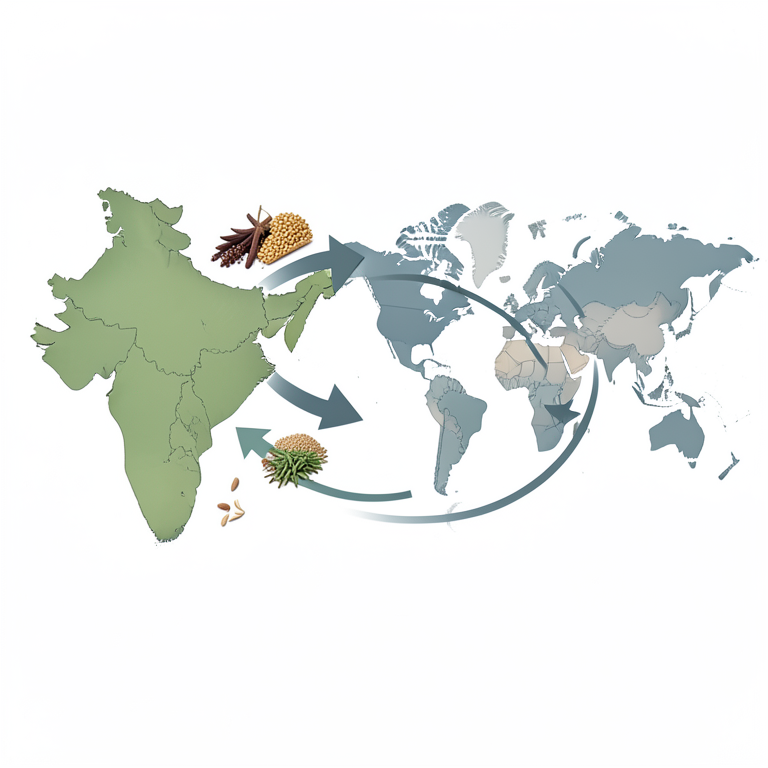
Trade Direction Shift
AI-generated conceptual illustration (Organic agricultural products from India). It explains the idea and does not show study data.
View source evidence ↗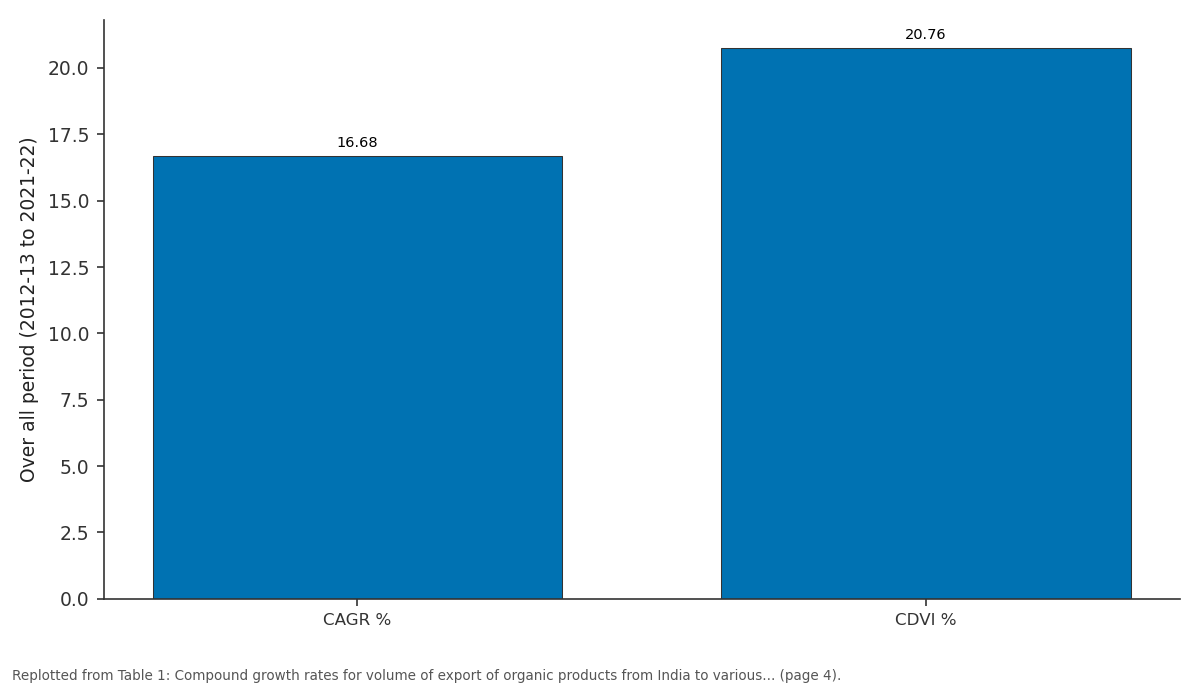
Over all period (2012-13 to 2021-22): CAGR % vs CDVI %
Replotted from Table 1 (page 4) of the original paper. Every bar is the paper's own table value.
View source evidence ↗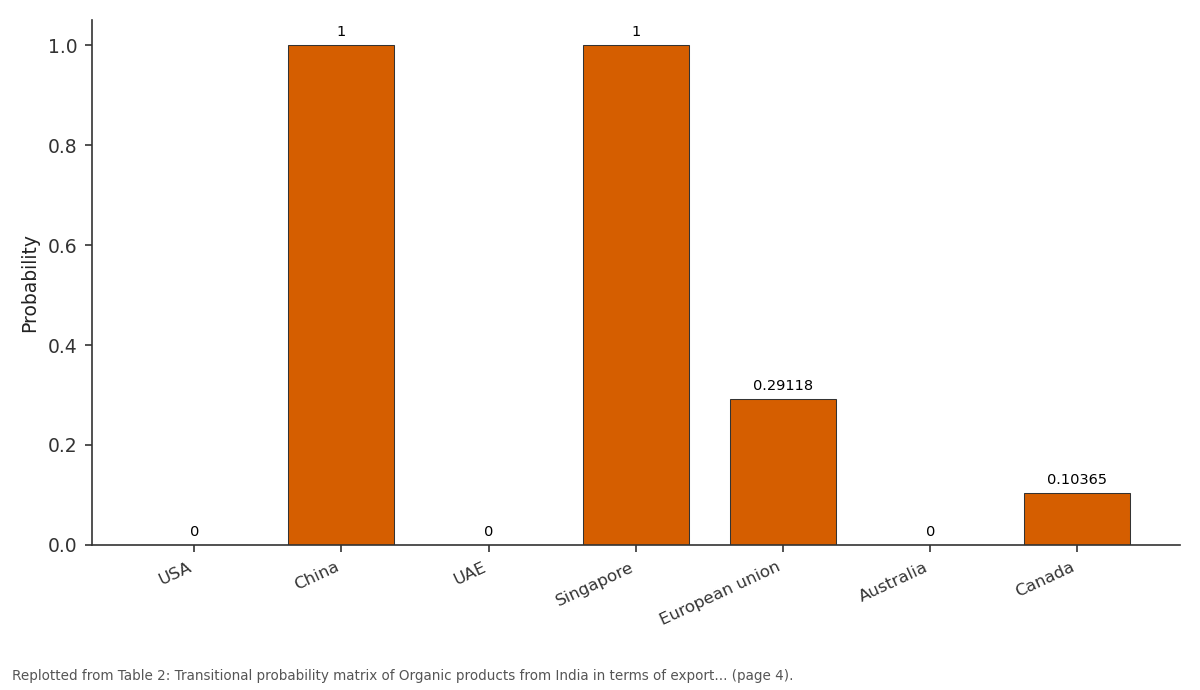
Canada: USA vs China vs UAE vs Singapore vs European union
Replotted from Table 2 (page 4) of the original paper. Every bar is the paper's own table value.
View source evidence ↗Figures & tables
From the original paper Table 1
 Table 2
Introduction
Agriculture has been the major source of revenue, predominantly in the rural areas which constitute about 55% of total population in India. Agriculture significantly contributes to our Indian economy in terms of export, the source of raw material and to mitigate needs of industries in various forms. The term Green Revolution has been the milestone of India's agricultural growth, renovated our country from food deficit to self-reliance by using fertilizers and pesticides. Excessive use of chemical for agricultural production by means of conventional farming during this period has put forward a question mark on future of sustainability in agriculture. Therefore, the role of organic farming plays a vital position in addressing the social, environmental and economic issues. With the increase in awareness of health and concern about the environment, more importance is increasingly given on quality of food products. Extensive consideration is being remunerated towards organic farming. Organic farming is one of the several approaches found to meet the objectives of sustainable agriculture. Organic agriculture offers trade opportunities for farmers in the developing and developed countries. This market of organic products is expected to grow globally in the coming years and high growth rates over the medium term (From 10-15 to 25-30%) are expected (Yussefi and Willer, 2002) [7] . Organic products are attained by a process that is ecofriendly, by a farming method that considers both the attributes of the final product and the production methods. Therefore, it is always that for this type of food demand will increase in future. The history of Organic Farming is arguable and was considered by a few as an inefficient move for production of food products. But in today's market demand for the organically cultivated produce and beverages is increasing. The performance of organic farming in comparison with conventional farming is done on basis of four key parameters: productivity, impact on the environment, economic feasibility and social well-being. India is bestowed with lot of potential to produce all varieties of organic products due to its various agro climatic conditions. In several parts of the country, the inherited tradition of organic farming is an added advantage. These holds promise for the organic producers to tap the market which is growing steadily in the domestic and export sector. As per the available statistics, India's rank 6th in terms of World's Organic Agricultural land and 1st in terms of total number of producers as per 2021 data (Source: FIBL & IFOAM Year Book, 2023). As on 31st March 2023 total area under organic certification process (registered under National Programme for Organic Production) is 10.17 m ha (2022-23). This includes 5391792.97 ha cultivable area and another 4780130.56 ha for wild harvest collection. Among all the states, Madhya Pradesh has covered largest area under organic certification followed by, Maharashtra, Gujarat, Rajasthan, Odisha, Karnataka, Uttarakhand, Sikkim, Chhattisgarh, Uttar Pradesh and Jharkhand. India produced around 2.9 million MT (2022-23) of certified organic products which includes all varieties of food products namely Oil Seeds, fibre, Sugar cane, Cereals & Millets, Cotton, Pulses, Aromatic & Medicinal Plants, Tea, Coffee, Fruits, Spices, Dry Fruits, Vegetables, Processed foods etc. The production is not limited to the edible sector but also produces organic cotton fiber, functional food products etc. The total volume of export during 2022-23 was 312800.51 MT. The organic food export realization was around INR 5525.18 Crore (708.33 million USD). Organic products are exported to USA, European Union, Canada, Great Britain, Switzerland, Turkey, Australia, Ecuador, Korea Republic, Vietnam, Japan, etc.
Methodology 2.1 Source of data
The secondary data related to the details of information pertaining to total export of organic products from India to other countries for the period 2012-13 to 2021-22 and secondary data on country -wise export of organic products from India for the period 2012-13 to 2021-22 were obtained from agri exchange portal of APEDA. The Data is divided in to two sexennial years for analysis purpose.
Growth model
To examine the compound growth rate of exports in terms of volume for the period of ten years from 2012 to 2022 and also for quinquennial period from India. Compound growth rates were estimated with the help of exponential function. The compound growth rate was tested for their significance by using the following formula:
Cuddy-Della Valle index
Cuddy Della Valle Instability index (Cuddy and Della Valle 1978) is a modification of coefficient of variation to accommodate trend present in the data, which is commonly present in economic time series data. This method is superior over the scale dependent measures such as standard deviation. The Cuddy Della Valle index (CDVI) is calculated as follows:
Where, CV is coefficient of variation, and R 2 is adjusted coefficient of determination.
The ranges of CDVI (Rakesh Sihmar, 2014) [10] are given as follows: Low instability = between 0 and 15 Medium instability = greater than 15 and lower than 30 High instability = greater than 30
Markov Chain Analysis
Markov chain analysis was employed to analyse the structural change in any system whose progress through time can be measured in terms of single outcome variable. In the present study, the dynamic nature of trade patterns of organic products from India studied using the Markov chain model. Markov chain analysis involving developing a transitional probability matrix 'P', whose elements, Pij indicate the probability of exports switching from country 'i' to country 'J' over time. The diagonal element Pij where i=j, measure the probability of a country retaining its market share or in other words, the loyalty of an importing country to a particular country's exports. In the context of current application, structural change was treated as a random process with seven importing countries for organic products. The assumption was that the average export of organic products from a country amongst importing countries in any period depends only on the export in the previous period and this dependence is same for all the periods. This was algebraically expressed as Where, Ejt = Exports from India to the jth country in the year T. Eit-1 = Exports of ith country during the year T-1. Pij = Probability that exports will shift from ith country to jth Country ejt = The error term which is statistically independent of Eit-1. n = the number of importing countries. The transitional probabilities Pij, which can be arranged in a (C × R) matrix, have the following properties. O < Pij < 1 =1 for all i Thus, the expected share of each importing country during period 't' is obtained by multiplying the exports of organic products to these countries in the previous period (t-1) with the transitional probability matrix. The probability matrices were estimated for the period from 2012-13 to 2021-22. Thus, transitional probability matrix (T) was estimated using linear programming (LP) frame work by a method referred to as minimizing of Mean Absolute Deviation (MAD).
Min, O P* + I e Subject to X P* + V = Y GP* = 1 P*>0 Where P* is a vector of the probabilities Pij O is the vector of zeros I is an appropriately dimensional vectors of areas E is the vector of absolute errors Y is the proportion of exports to each country X is a block diagonal matrix of lagged values of Y V is the vector of errors G is a grouping matrix to add the row elements of P arranged in P* to unity.
The values in the transition probability matrix will have different interpretations. The value of diagonal elements indicates the probability of retention of the previous year's share, while values in the columns reveal probability of gain by a particular country from other countries, values in rows reveal probability that a country might lose to other countries in respect of a specific commodity exports.
Results and Discussion
Results and Discussion
Trends in export of organic products
The results of Table 1 reveal the trends and instability index in export of organic products from India during the year 2012-13 to 2021-22. It could be observed from the table that the positive compound annual growth rate of around 18.67 percent had been observed during the sexennial period I. The probable reason might be the greater demand for Indian organic products at international markets. During the same period the CDVI was 0.13 percent, which inferred that the exports were slightly stable. Which was due to regular export activity. During the sexennial period II the observed CAGR was around 0.99 percent. The declined growth rate might be because of lesser production of organic products in India. The CDVI during the same period was 19.83 percent which was inferred that the exports were medium instable. It may be due to the lesser export to other countries. The CAGR during the overall period was recorded 16.68 percent. The CDVI during overall period recorded was 20.76 percent which was medium instable exports in the period. The main reason was during the recent years the exports were increasing and there was medium instability on the export of organic products. The Cuddy & Della Valle instability index was used to compute the degree of variation around the trend. The Cuddy & Della Valle instability index was calculated for both area and production of organic products for the period 2012-13 to 2021-22. With respect to Cuddy & Della Valle instability index the area of organic products during the period I, it was medium instable with 15.52 per cent, in period II it was medium instable with 15.13 per cent of instability index. In the overall period area of organic products was medium instable with 15.7 per cent during the study period. Similarly, Cuddy & Della Valle instability index of the production of organic products during the period I, it was low instable with 9.1 per cent, in period II it was high instable with 62 percent of index value. The total organic products were high instable in production with index value of 54 per cent during the same period. The result of this index showed that the area as well as production of the organic products was fluctuated variably. It's may be due to transition challenges, market dynamics, limited infrastructure, and geographical constraints affecting yield.
| S. No | Growth in different sexennial period | CAGR % | R2 | CDVI % |
|---|---|---|---|---|
| 1 | Sexennial period-I (2012-13 to 2016-17) | 18.67 | 0.78 | 0.13 |
| 2 | Sexennial period-I (2017-18 to 2021-22) | 0.99 | -0.32 | 19.83 |
| 3 | Over all period (2012-13 to 2021-22) | 16.68 | 0.80 | 20.76 |
Table text extracted from the original PDF; superscript letters are shown inline. The original table image is below.
View original table image
To study the direction of export of organic products from India
Change in direction of trade is studied with the help of Markov chain analysis for the period of 2012-13 to 2021-22, where Transitional Probability Matrix (TPM) is estimated for studying the direction of trade. As in transitional probability matrix diagonal elements provide information about an importing country's loyalty towards our export that is probability of retention of their trade with us. While the row elements show probability of loss of share of export of a country to their competing countries, elements in column shows the probability of gain of share of export of a particular country over their competing countries. By analysing the TPM table we can analyse the direction in which our export is moving or should move to undertake appropriate policy frame work in order to help exporters to help exporting their products with minimum uncertainty in export.
Organic products
The dynamics in the direction of organic products export from India were computed using transitional probability matrix and presented in table 2. The major importing countries are USA, China, UAE, Singapore, European Union, Australia and Canada. USA retained 51.73 per cent of its original share followed by Canada 10.36 per cent. China and Singapore lost 100 per cent of its share to Canada, European Union lost 29.11 per cent to Canada. Canada lost 28.32 per cent to European Union. The results reveal that for export of organic products from India the most reliable markets are USA and Canada. The countries like USA and Canada are most loyal countries in importing organic products from India and there is a huge scope for exploring many new markets other than these countries. www.extensionjournal.com
| Country | USA | China | UAE | Singapore | European Union | Australia | Canada |
|---|---|---|---|---|---|---|---|
| USA | 0.51738 | 0.00038 | 0.00193 | 0.00056 | 0.47463 | 0.00512 | 0.00000 |
| China | 0.00000 | 0.00000 | 0.00000 | 0.00000 | 0.00000 | 0.00000 | 1.00000 |
| UAE | 1.00000 | 0.00000 | 0.00000 | 0.00000 | 0.00000 | 0.00000 | 0.00000 |
| Singapore | 0.00000 | 0.00000 | 0.00000 | 0.00000 | 0.00000 | 0.00000 | 1.00000 |
| European union | 0.70882 | 0.00000 | 0.00000 | 0.00000 | 0.00000 | 0.00000 | 0.29118 |
| Australia | 1.00000 | 0.00000 | 0.00000 | 0.00000 | 0.00000 | 0.00000 | 0.00000 |
| Canada | 0.60683 | 0.00070 | 0.00119 | 0.00060 | 0.28322 | 0.00380 | 0.10365 |
Table text extracted from the original PDF; superscript letters are shown inline. The original table image is below.
View original table image
Conclusion
There was declined growth in production of organic products in India. Hence, farmers need to be educated by imparting training for gain of knowledge on good agricultural practices in cultivation of organic products. The organic products need to be popularized among the consumers regarding their nutrition values which creates demand in the market. There is huge demand for organic products along the globe. India being as exporter of organic products, USA and Canada are the loyal importers for organic products. Efforts should be taken to promote export of organic products from India to explore and exploit potential of other markets and to avoid overdependency on few countries.
References
7 in the original paper- Navya B, Soumya C, Gummagolmath KC. Export potential of agricultural commodities of Telangana. The Pharma Innovation Journal. 2022;11(4):694-699.
- Agarwal K. Export of Organic Food from India with Special reference to Pigeon Pea. Elementary Education Online. 2021;20(1):2570-2580.
- Zuma-Netshiukhwi G. The significance of disadvantaged crop species to improve food systems and security in the changing climate: Learning from Motheo District, South Africa. Int. J Agric. Nutr. 2022;4(1):44-52. DOI: 10.33545/26646064.2022.v4.i1a.53
- Vidanapathirana R, Wijesooriya N. Export market for organic food, present states, constraints and future scope. Indian Journal of Agricultural Marketing; 2014.
- Ummyiah HM. Narayan S, Kumar P. Export of organic products: opportunities and challenges. Journal of Pharmacognosy and Phytochemistry. 2017;6(6):10841088.
- Yussefi M, Willer H. Organic Agriculture World Wide 2002, Statistics and Future Prospects. Stiftung Ökologie and Landbau. Bad Dürkheim, Germany; c2002.
- Sihmar R. Growth and instability in agricultural production in Haryana: A district level analysis. International Journal of Scientific and Research Publications. 2014 Jul;4(7):1-2.
Cited by 2
From OpenAlex, OpenCitations and reference lists read by Scinovex
- The Organic Growth Story: How Indigenous Organic Practices are Driving Global Sustainability ↗
Apurva Sweeten Bandodcar, Filipe Rodrigues e Melo · Emerald Group Publishing Limited eBooks · 2026
The era of industrialization heralded a boom in the production of goods to meet the demands of consumers. This change, driven on the back of technological innovations, enabled the suppliers of products to capitalize on the economies of scale, thereby reducing the marginal cost of production and widening their profit margins. In the Indian context, for instance, the indigenous farming…
❝ 0 - Direction of trade and changing export pattern of sugar from India
Kunal V Bhivate, Jayshri B Tawale, RD Shelke, SH Kamble, Ranjeetsingh R Jadhav · International Journal of Agriculture Extension and Social Development · 2026
Sugar holds a significant position in India's agricultural economy and global trade basket, contributing substantially to farm incomes, rural employment and foreign exchange earnings. The present study analyzed the direction of trade and changing export pattern of Indian sugar during the period 2004-05 to 2023-24. Export data were collected from the Directorate General of Commercial Intelligence and Statistics (DGCI&S), Kolkata, under HS code 170111. The first-order Markov chain approach, employing the Minimum Absolute Deviation (MAD) estimation method, was used to estimate transitional probab