
Research article · 2023 · Full text
International Journal of Statistics and Applied MathematicsCorrelates of stakeholders perception towards preference of gladiolus varieties
Volume 8(6S) · Pages 1107–1109 · DOI: 10.22271/maths.2023.v8.i6so.1509 ↗
Research areasFlowering Plant Growth and Cultivation
Abstract
Author-writtenGladiolus is one of the most important flower crops grown commercially in different parts of India. Production of gladiolus in India estimated to be 259.77 thousand tonnes in 2021-2022. About 0.34 thousand hectares of the area were under cultivation of gladiolus in Maharshtra. The present study was conducted in Department of Floriculture and Landscape Architecture, Dr. P. D. K. V. Akola, Maharashtra. 120 stakeholders were selected for study. Exploratory research design was used. Structured interview schedule was prepared in the light of objectives and data was collected. Frequencies, mean, standard deviation and coefficient of correlation were employed for interpreting the results.
Summary
Source-checkedPlain-language reading of the full paper, prepared with AI and checked against the text. Each point links to the authors' own words.
Why it matters
- Gladiolus is a significant commercial flower crop cultivated across various regions of India. View evidence ↗
- Among cut flowers, Gladiolus is noted for providing the highest returns. View evidence ↗
- India's gladiolus production was estimated at 259.77 thousand tonnes for the 2021-2022 period. View evidence ↗
The question
- The study aimed to identify the factors (correlates) that influence how different stakeholders perceive and prefer various gladiolus varieties. View evidence ↗
What they did
- The study involved 120 stakeholders, divided equally into four groups of 30: flower growers, shopkeepers, consumers, and university scientists. View evidence ↗
- Stakeholders who visited gladiolus demonstration trials were selected using a simple random sampling method. View evidence ↗
- The researchers used an exploratory design with structured interviews, analyzing the data via frequencies, means, standard deviations, and correlation coefficients. View evidence ↗
What they found
- For flower growers, annual income, innovativeness, risk preference, and economic motivation showed a positive and highly significant correlation with perception (p < 0.01). View evidence ↗
- Among flower growers, age, education, growing experience, training, land holding, and market orientation were positively and significantly correlated with perception (p < 0.05). View evidence ↗
- For shopkeepers, market orientation was the only factor found to be positively and highly significantly correlated with perception (p < 0.01). View evidence ↗
- Shopkeepers' perception was positively and significantly correlated (p < 0.05) with education, family size, marketing experience, annual income, marketing income, and economic motivation. View evidence ↗
- Consumer perception was positively and significantly correlated (p < 0.05) with education, annual income, occupation, social participation, and market orientation. View evidence ↗
- Among university scientists, service experience, social participation, and coordinating ability were positively and highly significantly correlated with perception (p < 0.01). View evidence ↗
- University scientists' perception was positively and significantly correlated (p < 0.05) with age, education, communication, self-confidence, managerial ability, decision-making, and scientific orientation. View evidence ↗
What it means
- The authors conclude that different stakeholder groups have distinct primary drivers for their perception of gladiolus varieties, ranging from economic motivation for growers to service experience for scientists. View evidence ↗
Visual summary
2 visualsIllustrations explain the paper; charts are replotted from the paper's own table values.
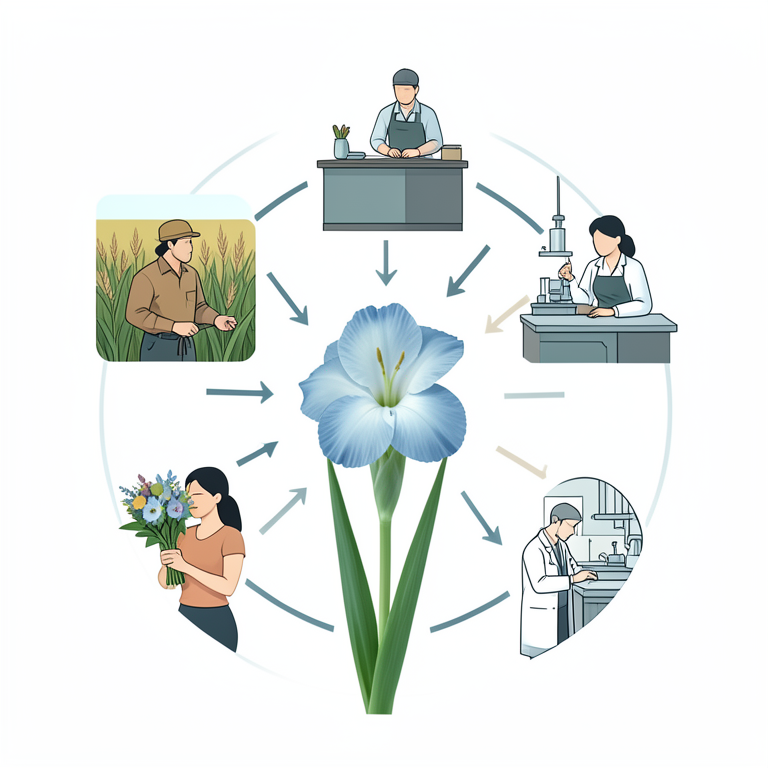
Stakeholder Group Analysis
AI-generated conceptual illustration (gladiolus flowers and diverse stakeholders). It explains the idea and does not show study data.
View source evidence ↗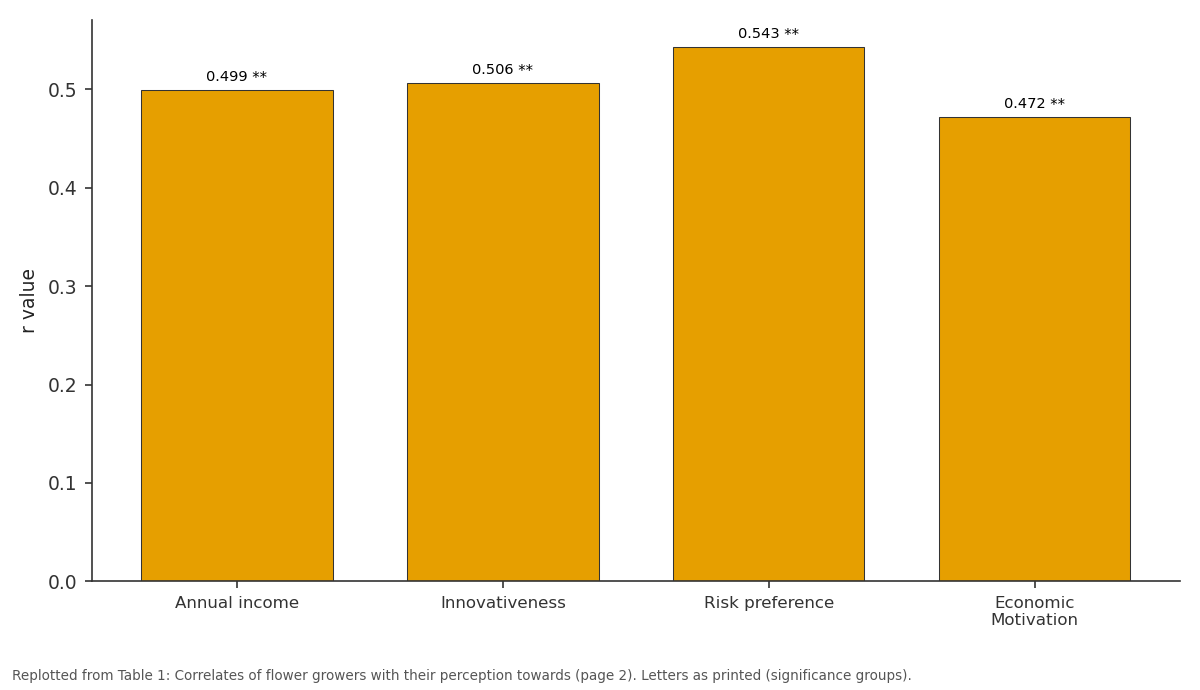
r value: Annual income vs Innovativeness vs Risk preference vs Economic Motivation
Replotted from Table 1 (page 2) of the original paper. Every bar is the paper's own table value.
View source evidence ↗Figures & tables
From the original paper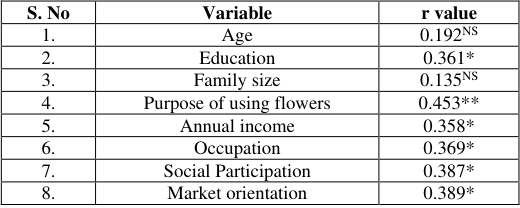 Table 3
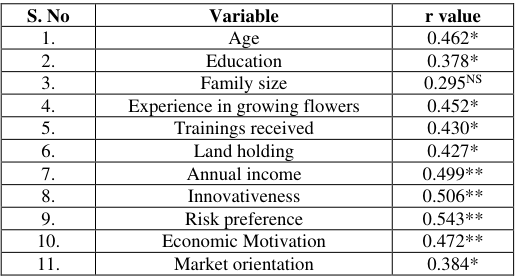 Table 1
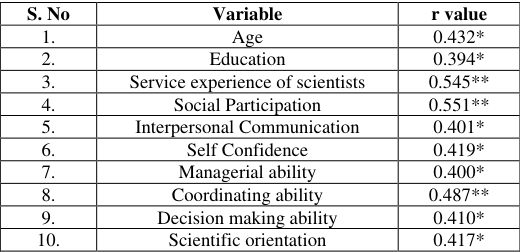 Table 4
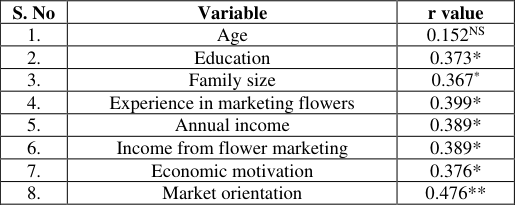 Table 2
Introduction
Gladiolus is one of the most important flower crops grown commercially in different parts of India such as Madhya Pradesh, Karnataka, Gujarat, Andhra Pradesh, Haryana, West Bengal, Maharashtra, Tamil Nadu and Sikkim etc. Compared to other cut flowers, Gladiolus ranks first in terms of returns. Floriculture is being increasingly popular not only as an essential part of good living but also as commercial enterprise with huge potential for export. In India, about 283 thousand hectares of the area were under cultivation of floriculture. Production of flowers is estimated to be 2295.07 thousand tonnes of loose flowers and 833.16 thousand tonnes of cut flowers in 2021-22 (3 rd advance estimate, APEDA 2022).Production of gladiolus in India estimated to be 259.77 thousand tonnes of total flowers and loose flowers production is 10.46 thousand tonnes and 249.31 thousand tonnes of cut flowers production in 2021-2022. (1 st advance estimates, NHB 2021).About 0.34 thousand hectares of the area were under cultivation of gladiolus in Maharashtra. Production of flowers is estimated to be 158.41 thousand tonnes of cut flowers in 2017-18. (India stat agri.) Source: Ministry of Agriculture and Farmers welfare, Govt. of India. The present study was performed in the Department of Floriculture and Landscape Architecture, College of Horticulture, Dr. Panjabrao Deshmukh Krishi Vidyapeeth, Akola, Maharashtra. Department of Floriculture and Landscape Architecture has a history of successful research in developing new varieties in flowers like Gladiolus, Chrysanthemum and Gaillardia which are suitable to cultivate in Vidarbha region of Maharashtra. In gladiolus crop varieties like P.D.K.V. Gold and P.D.K.V. Roshani were developed which are well known for its adaptability in Vidarbha region. In chrysanthemum crop varieties like P.D.K.V. Ragini and Bijali supers were developed both of them were high yielding varieties. In gaillardia P.D.K.V. Roshani was developed which is also a high yielding variety.
Methodology
Over a past few years many varieties of gladiolus were growing and trails are being conducted in the Department of Floriculture and Landscape Architecture. To make awareness of different varieties of Gladiolus department appealed all the stakeholders i.e. flower growers, shopkeepers, consumers, university scientists and university students to visit the gladiolus flower demonstration trails. Number of stakeholders visited to the gladiolus trail plots during flowering stage.
Accordingly the visiting stakeholders were contacted and are selected through simple random sampling method. Exploratory research design was used. Structured interview schedule was prepared in the light of objectives and data was collected. Frequencies, mean, standard deviation and coefficient of correlation were employed for interpreting the results. Total number of respondents were 120 consists of four groups of stakeholders. They were flowers growers, shopkeepers, consumers and university scientists are selected. Each group of stakeholders consists of 30 respondents. The data manifested in the Table 1, clearly indicated that annual income (0.499**), innovativeness (0.506**), risk preference (0.543**) and economic motivation (0.472**) were found positive and highly significant relation with perception at 0.01 level of probability. While age (0.462*), education (0.378*), experience in growing flowers (0.452*), trainings received (0.430*), land holding (0.427*), and market orientation (0.384*) were found positive and significantly relation with perception at 0.05 level of probability. Whereas, the family size (0.295NS) had non-significant relation with perception.
| S. No | Variable | r value |
|---|---|---|
| 1. | Age | 0.462* |
| 2. | Education | 0.378* |
| 3. | Family size | 0.295NS |
| 4. | Experience in growing flowers | 0.452* |
| 5. | Trainings received | 0.430* |
| 6. | Land holding | 0.427* |
| 7. | Annual income | 0.499** |
| 8. | Innovativeness | 0.506** |
| 9. | Risk preference | 0.543** |
| 10. | Economic Motivation | 0.472** |
| 11. | Market orientation | 0.384* |
Table text extracted from the original PDF; superscript letters are shown inline. The original table image is below.
View original table image
Results and Discussion
Results and Discussion
Conclusion
On the basis of findings of flower growers it can be concluded that annual income, innovativeness, risk preference and economic motivation were positively and highly significantly correlated, while age, education, experience in growing flowers, trainings received, land holding, and market orientation were positively and significantly correlated with perception. Whereas, the family size was non significantly correlated with perception. On the basis of findings of shopkeepers it can be concluded that market orientation was found to be positively and highly significantly correlated while education, family size, experience in marketing flowers, annual income, income from flower marketing and economic motivation were positively and significantly correlated with perception. Whereas, the age was none significantly correlated with perception. The findings of consumers concluded that purpose of using flowers was found to be positively and highly significantly correlated while education, annual income, occupation, social participation and market orientation were found to be positively and significantly correlated. Whereas, the age, family size were none significantly correlated with perception.
On the basis of findings of university scientists it is concluded that service experience, social participation, coordinating ability were found to be positively and highly significantly correlated while age, education, interpersonal communication, self-confidence, managerial ability, decision making ability and scientific orientation were found to be positively and significantly correlated with perception.
Figures and tables from the paper
| S. No | Variable | r value |
|---|---|---|
| 1. | Age | 0.192NS |
| 2. | Education | 0.361* |
| 3. | Family size | 0.135NS |
| 4. | Purpose of using flowers | 0.453** |
| 5. | Annual income | 0.358* |
| 6. | Occupation | 0.369* |
| 7. | Social Participation | 0.387* |
| 8. | Market orientation | 0.389* |
Table text extracted from the original PDF; superscript letters are shown inline. The original table image is below.
View original table image
| S. No | Variable | r value |
|---|---|---|
| 1. | Age | 0.432* |
| 2. | Education | 0.394* |
| 3. | Service experience of scientists | 0.545** |
| 4. | Social Participation | 0.551** |
| 5. | Interpersonal Communication | 0.401* |
| 6. | Self Confidence | 0.419* |
| 7. | Managerial ability | 0.400* |
| 8. | Coordinating ability | 0.487** |
| 9. | Decision making ability | 0.410* |
| 10. | Scientific orientation | 0.417* |
Table text extracted from the original PDF; superscript letters are shown inline. The original table image is below.
View original table image
| S. No | Variable | r value |
|---|---|---|
| 1. | Age | 0.152NS |
| 2. | Education | 0.373* |
| 3. | Family size | 0.367* |
| 4. | Experience in marketing flowers | 0.399* |
| 5. | Annual income | 0.389* |
| 6. | Income from flower marketing | 0.389* |
| 7. | Economic motivation | 0.376* |
| 8. | Market orientation | 0.476** |
Table text extracted from the original PDF; superscript letters are shown inline. The original table image is below.