
Research article · 2023 · Full text
International Journal of Statistics and Applied MathematicsGrowth rate of area, production and productivity of various crops in differences regions of Gujarat
Volume 8(6S) · Pages 995–1002 · DOI: 10.22271/maths.2023.v8.i6sm.1497 ↗
Research areasAgricultural Economics and PracticesRice Cultivation and Yield Improvement
Abstract
Author-writtenThe present study takes into consideration area, production and productivity of major food grain and non-food grain crops of Gujarat State and thus 12 major crops were selected. The overall period of study between 1982-83 to 2017-18 (over 36 years) divided into period I (pre-WTO 1982-83 to 1994-95) and period II (post-WTO 1995-96 to 2017-18). An economic analysis was conducted to compare the compound growth rates of key crops including cereals, pulses, oilseeds and commercial crops across four regions within the state: North Gujarat, Saurashtra, Central Gujarat, and South Gujarat. The results revealed that, the Compound growth rate analysis has shown that in Gujarat State area, production and yield under rice crop were significantly increased during over all period by 1.57, 3.77 and 2.17 per cent per annum respectively.In Gujarat state during overall period area under pearl millet crop declined significantly -2.92 per cent per annum, while productivity increased significantly 3.10 per cent per annum. Area, production and Productivity of Maize are significantly increasing at 1.21, 2.72 and 1.49 per cent per annum in Gujarat over last 36 years. Area, Production and Productivity in Gujarat shows positive growth in Wheat at 2.99, 4.29 and 1.25 per cent per annum respectively, its major staple cereal crop. The area, production and productivity of gram significantly increased in Gujarat at 2.57 per cent, 4.32 per cent and 1.70 per cent per annum and production and productivity of black gram increased significantly in Gujarat at 2.13 per cent,1.55 per cent. In groundnut crop area decline during overall period -0.37 per cent per annum while production and productivity increased significantly in Gujarat at 3.55 per cent, 3.95 per cent per annum. In Gujarat state during overall period area, production and productivity of castor crop increased significantly at 4.07 per cent, 5.83 per cent and 1.69 per cent per annum. In case of cotton crop area, production and productivity increased significantly during overall period at 2.99, 7.01 and 4.92 per cent per annum in Gujarat state. While in sugarcane crop area, production and productivity increased significantly during overall period at 2.44, 6.80 and 4.24 per cent per annum in Gujarat state. At state level significant soybean area expansion is observed at 5.58 per cent per annum production rise at 7.85 per cent per annum and productivity rise at 2.15 per cent per annum.
Summary
Source-checkedPlain-language reading of the full paper, prepared with AI and checked against the text. Each point links to the authors' own words.
Why it matters
- Gujarat is considered one of India's most progressive states in terms of agricultural development. View evidence ↗
- Historically, agricultural productivity in Gujarat has been hindered by climate, topography, rainfall patterns, and soil quality. View evidence ↗
- Agricultural development in India has been driven by the adoption of high-yielding seeds, irrigation, and chemical fertilizers. View evidence ↗
The question
- The study aims to estimate the growth rate and instability of crop area, production, and yield across different regions of Gujarat. View evidence ↗
What they did
- The research covered the entire state of Gujarat, specifically focusing on the Saurashtra, South Gujarat, Middle Gujarat, and North Gujarat regions. View evidence ↗
- The study analyzed a 36-year period from 1981-82 to 2017-18 to evaluate agricultural performance. View evidence ↗
- Twelve major crops were selected, including cereals (wheat, pearl millet, paddy, maize), pulses (gram, green gram, black gram), oilseeds (groundnut, castor, soybean), and cash crops (cotton, sugarcane). View evidence ↗
- Compound growth rates were used as the primary analytical technique to estimate changes in crop area, production, and yield. View evidence ↗
What they found
- Over the overall study period, rice in Gujarat showed significant annual growth in area (1.57%), production (3.77%), and yield (2.17%). View evidence ↗
- For pearl millet in Gujarat, the cultivated area declined by 2.92% per annum over the overall period, though productivity grew by 3.10% per annum. View evidence ↗
- Wheat, a major staple cereal, experienced positive annual growth in area (2.99%), production (4.29%), and productivity (1.25%) across Gujarat. View evidence ↗
- Groundnut area in Gujarat declined by 0.37% per annum, but production and productivity grew significantly by 3.55% and 3.95% per annum, respectively. View evidence ↗
- Cotton showed significant overall annual growth in area (2.99%), production (7.01%), and productivity (4.92%) in Gujarat. View evidence ↗
- Soybean experienced significant state-level annual growth in area (5.58%), production (7.85%), and productivity (2.15%). View evidence ↗
- The introduction of BT-cotton reduced bollworm infestation, leading to significant increases in cotton area, production, and yield during the post-WTO and overall periods. View evidence ↗
- In North Gujarat, sugarcane area, production, and yield decreased significantly during the post-WTO and overall periods due to reduced water availability. View evidence ↗
What it means
- The authors conclude that over the overall period, soybean had the highest growth rate in area (5.58%), while black gram had the lowest (0.56%). View evidence ↗
- Regarding overall yield growth in Gujarat, cotton showed the highest rate (4.92%), while green gram showed the lowest (1.66%). View evidence ↗
Visual summary
3 visualsIllustrations explain the paper; charts are replotted from the paper's own table values.
Study Framework
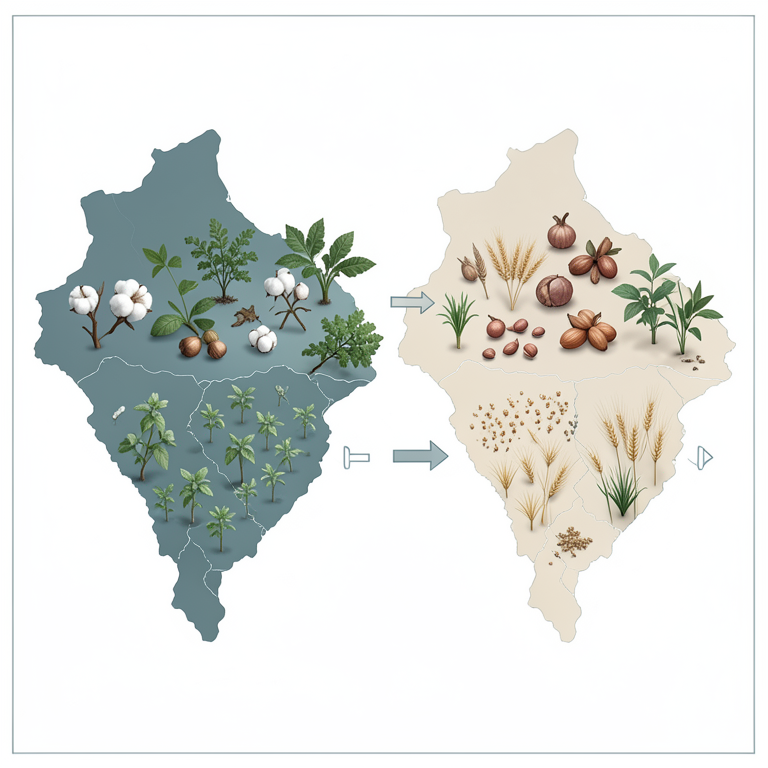
AI-generated conceptual illustration (Agricultural crops in the regions of Gujarat, India). It explains the idea and does not show study data.
View source evidence ↗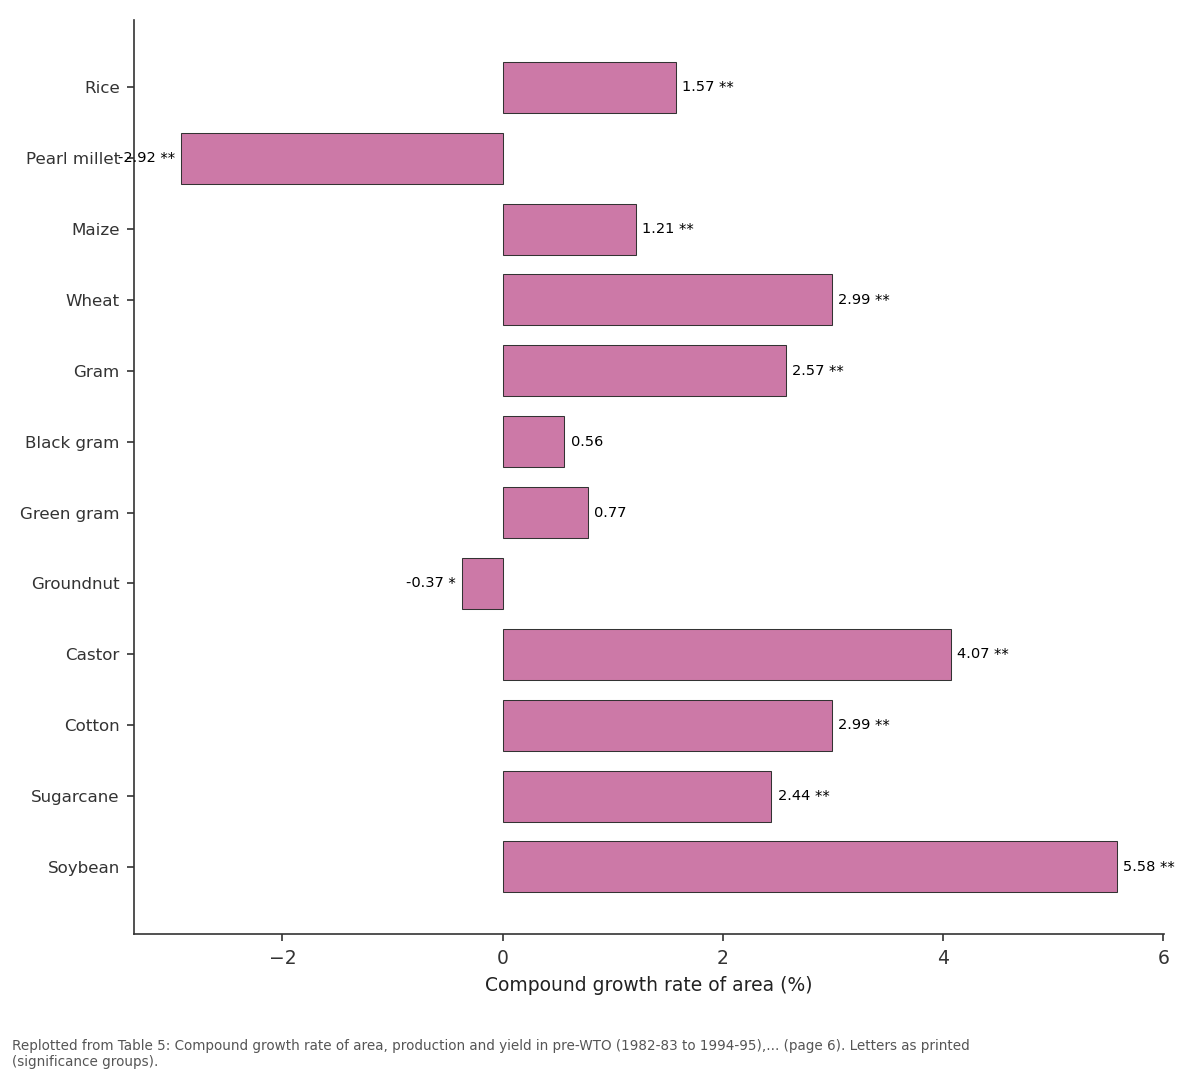
Overall (1982-83 to 2017-18) / Area: Rice vs Pearl millet vs Maize vs Wheat vs Gram
Replotted from Table 5 (page 6) of the original paper. Every bar is the paper's own table value.
View source evidence ↗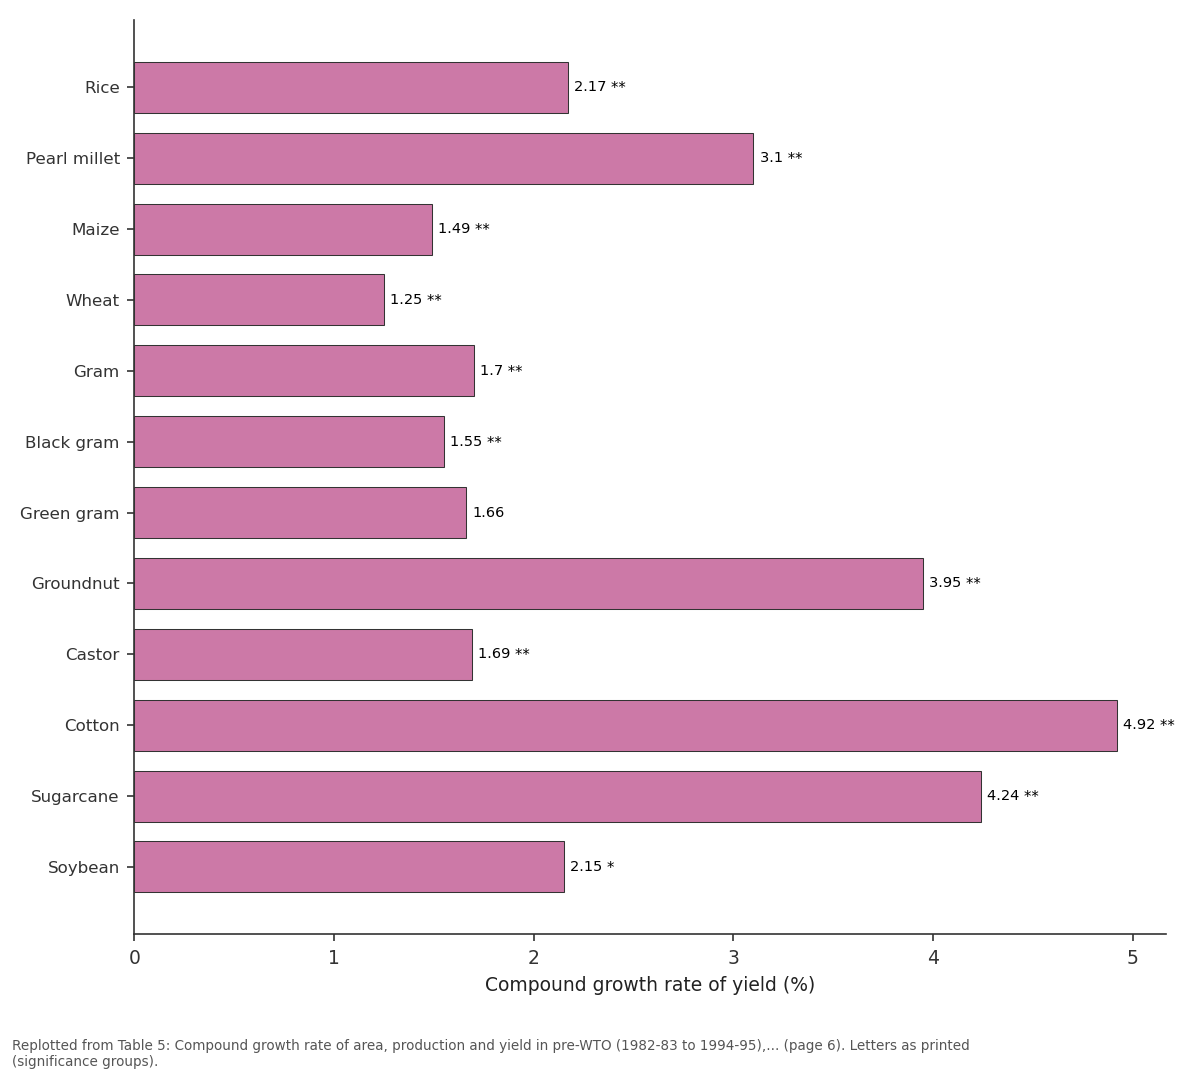
Yield: Rice vs Pearl millet vs Maize vs Wheat vs Gram
Replotted from Table 5 (page 6) of the original paper. Every bar is the paper's own table value.
View source evidence ↗Figures & tables
From the original paper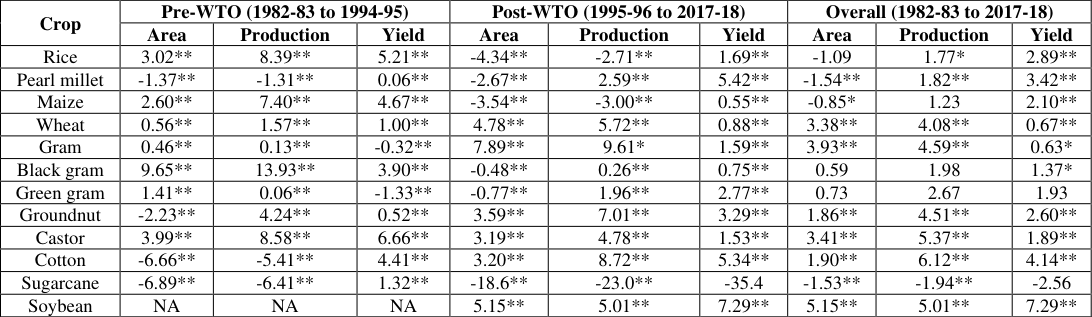 Table 1
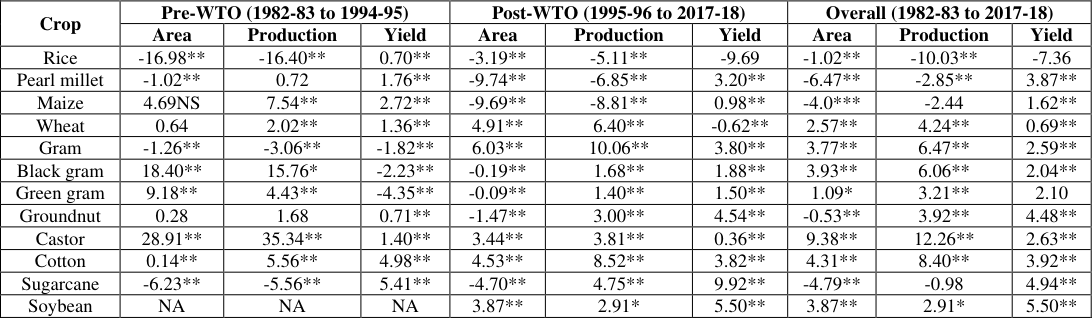 Table 2
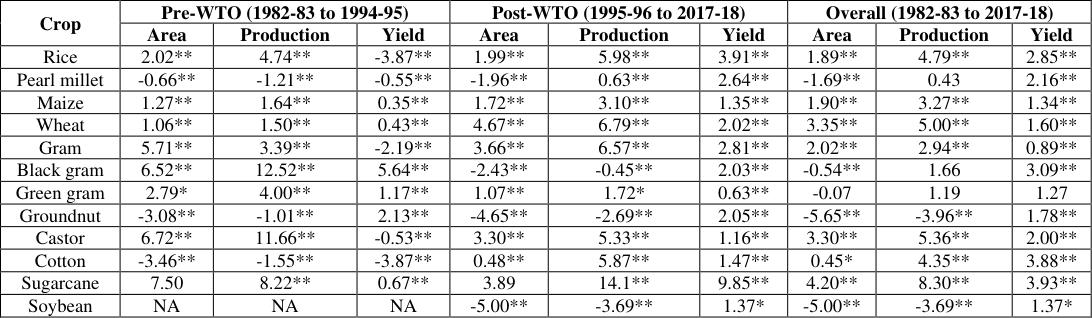 Table 3
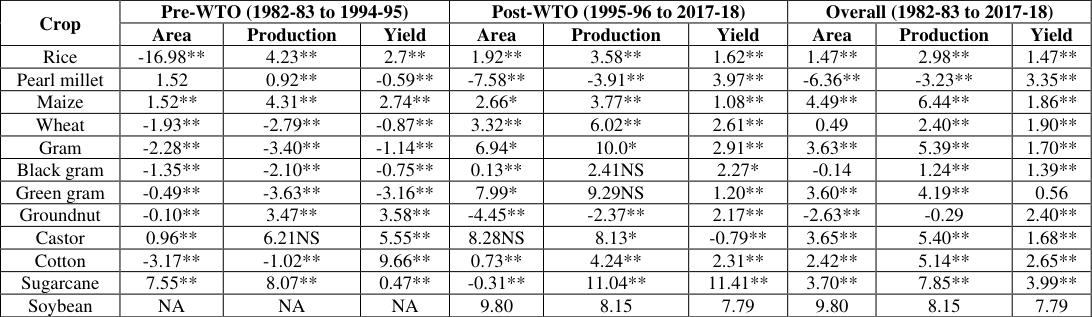 Table 4
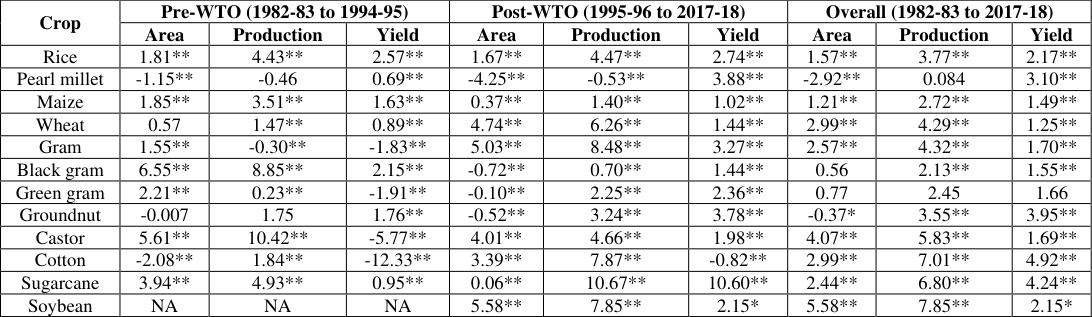 Table 5
Introduction
Gujarat holds a crucial position in India's agricultural development and is recognized as one of the progressive states in the nation. However, a long-standing assertion suggests that Gujarat faces a deficit in its primary economic activity, namely agriculture. The agricultural productivity in Gujarat has historically faced challenges due to factors like soil quality, rainfall patterns, topography, and climate. These conditions have often led to lower crop yields compared to other Indian states. Since its establishment in 1960-61, efforts have been made to address these issues through increased investments. These investments have been directed towards enhancing agriculture, including providing better access to fertilizers, improving irrigation facilities, and promoting the development of high-yielding crop varieties. The 1970s, on the other hand, present a more optimistic scenario with significant growth in production levels. Agricultural output in the state finally broke free from its stagnant state and experienced much-needed expansion.
However, it's worth noting that while average production levels might have risen during and after the seventies, this increase also introduced noticeable fluctuations in output, leading to instability in income and employment. Unfortunately, Gujarat's agricultural performance wasn't particularly impressive during this phase. The growth and productivity of the agricultural sector are significantly influenced by the allocation of resources and the mix of inputs used. In advanced countries, these inputs mix and resource allocation have evolved over time and will continue to do so in the future. Technological advancements have led to an upward and rightward shift in the production function, enabling farmers to leverage yield-enhancing inputs. In India, agricultural development has been accelerating due to the adoption of modern production techniques, notably the use of chemical fertilizers, irrigation, and high-yielding seeds. These elements are crucial components of the new production technology. As farming transitions from traditional to modern methods, the demand for these advanced inputs is expected to increase. To effectively formulate strategies for boosting agricultural output through the adoption of these technologies, it is imperative to have empirical evidence showcasing their growing utilization and impact on agricultural development. All these circumstances and actual evidences, the present research study entitled estimate growth rate and instability of area, production and yield of various crops in differences regions of Gujrat.
Methodology
Study Area: Present study entire Gujarat state was selected along with four regions (i.e., North Gujarat, Middle Gujarat, South Gujarat, Saurashtra regions) of state
Period of study:
The time period was divided as under. The overall period 1981-82 to 2017-18 was considered to understand the overall performance of agriculture over the long period of 36 years.
Crops covered
The state of Gujarat demonstrates a diverse crop pattern across its various regions, which is influenced by distinct agro-climatic conditions. As a result, the study focuses on key principal crops, in cereals viz., wheat, pearl millet, paddy, maize, in pulses viz., gram, green gram and black gram, in oilseeds viz., groundnut, castor, soybean and commercial (cash) crops viz., cotton and sugarcane were selected for the present study.
Nature of data and their sources
The current study utilized secondary time series data to achieve its objectives. This data was acquired from various secondary sources such as published records from state government, cooperative, and private institutions. The compound growth rates were calculated using time series data on crop area, production, and yield for all regions, including Gujarat as a whole, spanning 36 years from 1981-82 to 2016-17. These rates were determined to analyze the annual percentage changes in the specified parameters. The following exponential growth functions were used.
Analytical Techniques
Analytical Techniques
Results and Discussion
Results and Discussion
Compound growth rate
The calculation of growth rates is a vital aspect of the agricultural domain, as it signifies progress over time. Proficiency in computing growth rates not only aids in monitoring advancements, but also in strategizing, target establishment, and foreseeing outcomes or formulating agricultural policies.
Compound growth rate of area, production and yield in pre-WTO (1982-83 to 1994-95), post-WTO (1995-96 to 2017-18) and overall period (1982-83 to 2017-18) of North Gujarat It can be observed from Table 4.1 that the area, production and yield of rice increased significantly up to 3.02, 8.39 and 5.21 per cent respectively during pre-WTO period but there was significant decline up to -4.34 per cent in area, during post-WTO period because the rice is water loving crop and the water level in north Gujarat has been decreased in this period. Production also decreased by -2.71 per cent significantly during post-WTO period. Interestingly, The compound growth rate of rice yield exhibited significant growth rates of 1.69% and 2.89% during the post-WTO period and the overall period, respectively. This growth can be primarily attributed to the notable difference between the rate of decline in production compared to that of the cultivated area. Contrastingly, for Pearl millet, both the cultivated area and production witnessed substantial declines of -1.37% and -1.31% respectively, during the pre-WTO period. However, during the post-WTO period and the overall period, the area under Pearl millet cultivation decreased by -2.67% and -1.51% respectively. Remarkably, the production of Pearl millet increased significantly by 2.59% and 1.82% during the post-WTO period and overall period respectively. Yield showed significant increased during pre-WTO period as 0.06 per cent, post-WTO period 5.42 per cent and in overall period 3.42 per cent. Area, production and yield of maize increased up to 2.60, 7.40 and 4.67 per cent significantly during pre-WTO period respectively but there was significant decline in area up to -3.54, -0.85 per cent during post-WTO period as well as in overall period respectively. It might be due to the heavy infestation of the stem borer during this period and also the farmers might not get the sufficient price for crop produce as compared to other crop under cultivation. Production also decreased to -3.00 per cent significantly during post-WTO period. Yield showed increase up to 4.67, 0.55 and 0.10 per cent during pre-WTO period, post-WTO period and in overall period respectively. In case of wheat, area, production and yield increased up to 0.56, 1.57 and 1.00 per cent significantly during pre-WTO period, post-WTO period and in overall period respectively. As wheat requires comparatively less labours in its cultivation, the area of wheat has been increased during the post-WTO era. It might be also because of the introduction and implementation of the new technologies and machineries. During the post-WTO era, the consumption of wheat-based products has also been increased in market. Area and production of gram increased up to 0.46 and 0.13 per cent significantly during pre-WTO period but there was significant decline in yield by -0.32 per cent during this period. During post-WTO period and in overall period, area, production and yield of gram increased significantly because it requires less water for its cultivation. The government has also started giving higher MSP and the cost of cultivation is also very less. The infestation of pest and disease is low as compared to other crops. In case of black gram, area, production and yield increased up to 9.65, 13.93 and 3.90 per cent significantly during pre-WTO period respectively whereas area showed significant decline by -0.48 per cent and production and yield showed significant increase up to 0.26, 0.75 per cent during post-WTO period. yield showed significant increase up to 1.37 per cent in overall period. Area and production of green gram increased up to 1.41 and 0.06 per cent significantly during pre-WTO period but there was significant decline in yield by -1.33 per cent during this period. During post-WTO period, area showed significant decrease as -0.77 per cent while production and yield of green gram increased up to 1.96 and 2.77 per cent significantly. In case of groundnut, area showed significant decline as -2.23 per cent whereas production and yield increased up to 4.24 and 0.52 per cent significantly during pre-WTO period. Area, production and yield increased significantly during both post-WTO period and in overall period. Area, production and yield of castor increased significantly during pre-WTO period, post-WTO period and in overall period. In case of cotton, area and production declined up to -6.66 and -5.41 per cent significantly during pre-WTO period whereas yield showed significant increase by 4.41 per cent during the same period. Area, production and yield showed significant increase during post-WTO period and in overall period because of the introduction of BT-cotton due to which the infestation of ball warms has been reduced. Area and production of sugarcane decreased significantly -6.89 and -6.41 per cent during pre-WTO period but there was significant increase up to 1.32 per cent in yield during this period. During post-WTO period and in overall period, area, production and yield of sugarcane decreased significantly as this crop required higher amount of water for its cultivation but water availability has been reduced. In case of soybean, area, production and yield increased significantly up to 5.15, 5.01 and 7.29 per cent respectively during post-WTO period and in overall period. This result is similar to Goel and Agrawal (1979).
| Crop | Pre-WTO (1982-83 to 1994-95) | — | — | Post-WTO (1995-96 to 2017-18) | — | — | Overall (1982-83 to 2017-18) | — | — |
|---|---|---|---|---|---|---|---|---|---|
| Area | Production | Yield | Area | Production | Yield | Area | Production | Yield | |
| Rice | -16.98** | 4.23** | 2.7** | 1.92** | 3.58** | 1.62** | 1.47** | 2.98** | 1.47** |
| Pearl millet | 1.52 | 0.92** | -0.59** | -7.58** | -3.91** | 3.97** | -6.36** | -3.23** | 3.35** |
| Maize | 1.52** | 4.31** | 2.74** | 2.66* | 3.77** | 1.08** | 4.49** | 6.44** | 1.86** |
| Wheat | -1.93** | -2.79** | -0.87** | 3.32** | 6.02** | 2.61** | 0.49 | 2.40** | 1.90** |
| Gram | -2.28** | -3.40** | -1.14** | 6.94* | 10.0* | 2.91** | 3.63** | 5.39** | 1.70** |
| Black gram | -1.35** | -2.10** | -0.75** | 0.13** | 2.41NS | 2.27* | -0.14 | 1.24** | 1.39** |
| Green gram | -0.49** | -3.63** | -3.16** | 7.99* | 9.29NS | 1.20** | 3.60** | 4.19** | 0.56 |
| Groundnut | -0.10** | 3.47** | 3.58** | -4.45** | -2.37** | 2.17** | -2.63** | -0.29 | 2.40** |
| Castor | 0.96** | 6.21NS | 5.55** | 8.28NS | 8.13* | -0.79** | 3.65** | 5.40** | 1.68** |
| Cotton | -3.17** | -1.02** | 9.66** | 0.73** | 4.24** | 2.31** | 2.42** | 5.14** | 2.65** |
| Sugarcane | 7.55** | 8.07** | 0.47** | -0.31** | 11.04** | 11.41** | 3.70** | 7.85** | 3.99** |
| Soybean | NA | NA | NA | 9.80 | 8.15 | 7.79 | 9.80 | 8.15 | 7.79 |
Table text extracted from the original PDF; superscript letters are shown inline. The original table image is below.
View original table image
Compound growth rate of area, production and yield in pre-WTO (1982-83 to 1994-95), post-WTO (1995-96 to 2017-18) and overall Period (1982-83 to 2017-18) of Saurashtra It can be observed from Table 4.2 that the area and production of rice were decline significantly up to -16.98 and -16.40 per cent during pre-WTO period but there was significantly increased up to 0.70 per cent in yield during pre-WTO period. However, area, production and yield decline -3.19, -5.11 and -9.69 per cent significantly during post-WTO period as well as -1.02, -10.03 and -7.36 per cent in overall period. This could be attributed mainly to the fact that the rate of decline in production is much lesser than that of area. In case of pearl millet, area declined by -1.02 per cent significantly during pre-WTO period but yield increase up to 1.76 per cent significantly during pre-WTO period Whereas area and production showed decline by -9.74 and -6.85 per cent during post-WTO period and -6.47 and -2.85 per cent in overall period but yield increased up to 3.20 and 3.87 per cent significantly during both post-WTO period and overall period respectively. Production and yield of maize increased up to 7.54 and 2.72 per cent significantly during pre-WTO period but there was significant decline by -9.69 and -8.81 per cent in area and production during post-WTO period as well as -4.00 and -2.44 per cent in overall period that might be due to the farmers not getting the sufficient price for crop as compared to other crop under cultivation and due to the heavy infestation of the stem borer during this period, but Yield increase up to 0.98 and 1.62 per cent significantly during post-WTO period as well as in overall period respectively. In case of wheat, production and yield increased up to 2.02 and 1.36 per cent significantly during pre-WTO period however in post-WTO period area and production increased up to 4.91 and 6.40 per cent significantly but yield decline by 0.62 per cent significantly. Area, production and yield increased up to 2.57, 4.24 and 0.69 per cent significantly during overall period. Area, production and yield of gram decline by -1.26, -3.06 and -1.82 per cent significantly during pre-WTO period but there was significant increase up to 6.03, 10.06 and 3.80 per cent in yield during post-WTO period and 3.77, 6.47 and 2.59 per cent in overall period. The area of gram has been increased in post-WTO era as compared to pre-WTO era because it requires less water for its cultivation. It might be due the government has also started giving higher MSP and the cost of cultivation is also very less. The infestation of pest and disease is low as compared to other crops. In case of black gram, area and production increased up to 18.40 and 15.76 per cent significantly during pre-WTO period whereas yield showed significant decline by -2.23 per cent during pre-WTO period. In post WTO period area decline by -0.19 per cent significantly however production and yield increased up to 1.68 and 1.88 per cent significantly. Area, production and yield increased up to 3.93, 6.06 and 2.04 per cent significantly during overall period. Area and production of green gram increased significantly up to 9.18 and 4.43 per cent respectively during pre-WTO period but there was significant decline by -4.35 per cent in yield during this period. During post-WTO period, area showed significant decrease by -0.09 per cent while production and yield of green gram increased significantly up to 1.40 and 1.50 per cent respectively. However, area and production increased significantly up to 1.09 and 3.21 per cent respectively during overall period. In case of groundnut, yield significantly increased up to 0.71 per cent. Area showed significantly decline by -1.47 per cent during post WTO and -0.53 per cent in overall period. However, production and yield increased up to 3.00 and 4.54 per cent significantly during post WTO and 3.92 and 4.48 per cent in overall period. Area, production and yield of castor increased significantly during pre-WTO period, post-WTO period and in overall period but the area of castor has been decreased in post WTO era as compared to pre-WTO era, that might be due to the farmers didn't get the fair price, higher incidence of wilt because of heavy rainfall. The crop duration is also very long viz. 8 months. In case of cotton, area, production and yield increased significantly during pre-WTO period, post-WTO period and in overall period. Area and production of sugarcane decreased by -6.23 and -5.56 per cent significantly during pre-WTO period but there was significant increase up to 5.41 per cent in yield during this period. During post-WTO period area showed significantly decline by -4.70 per cent but production and yield increased up to 4.75 and 9.92 per cent significantly. However, area decline by -4.79 per cent during overall period but yield increased up to 4.94 per cent Significantly during overall period. In case of soybean, area, production and yield increased significantly during post-WTO period and in overall period. This result is similar to Mander and Sharma (1995) [6] .
Compound growth rate of area, production and yield in pre-WTO (1982-83 to 1994-95), post-WTO (1995-96 to 2017-18) and overall period (1982-83 to 2017-18) of Central Gujarat
It can be observed from Table 4.3 that the area and production of rice increased significantly up to 2.02 and 4.74 per cent respectively during pre-WTO period but there was significant decline by -3.87 per cent in yield during pre -WTO period. However, Area, production and yield of rice crop were significantly increased up to 1.99, 5.98 and 3.91 per cent respectively during post-WTO as well as 1.89, 4.79 and 2.85 per cent in overall period. In case of pearl millet, area, production and yield declined significantly by -0.66, -1.21 and -0.55 per cent respectively during pre-WTO period, whereas area showed decline as -1.96 per cent during both post-WTO period as well as -1.69 per cent in overall period but Production and yield increased significantly up to 0.63 and 2.64 during both post-WTO period respectively and 2.16 per cent in overall period. Area, production and yield of maize increased significantly up to 1.27, 1.64 and 0.35 per cent respectively during pre-WTO period, 1.72, 3.10 and 1.35 per cent in post-WTO period as well as 1.90, 3.27 and 1.34 per cent in overall period. In case of wheat, area, production and yield increased significantly during pre-WTO period, post-WTO period and in overall period. Area and production of gram increased significantly up to 5.71 and 3.39 per cent respectively during pre-WTO period but there was significant decline by -2.19 per cent in yield during this period. During post-WTO period and in overall period, area, production and yield of gram increased significantly. In case of black gram, area, production and yield increased significantly up to 6.52, 12.52 and 5.64 per cent respectively during pre-WTO period whereas area and production showed significant decline by -2.43 and -0.45 per cent and yield showed significant increase up to 2.03 per cent during post-WTO period. Area declines by -0.54 per cent during overall period but yield showed significant increase up to 3.09 per cent in overall period. Area, production and yield of green gram increased significantly during pre-WTO period as well as post-WTO period. However, there was significant decline by -0.07 per cent in area during overall period. In case of groundnut, area and production showed significant decline whereas yield increased significantly during pre-WTO period, post-WTO period and in overall period. Area and production of castor were significantly increased during pre-WTO period but there was significantly decline in yield during this period. However, Area, production and yield of castor increased up to 3.30, 5.33 and 1.16 per cent significantly during post-WTO period as well as 3.30, 5.36, and 2.00 per cent in overall period. In case of cotton, area, production and yield declined significantly by -3.46, -1.55 and -3.87 per cent respectively during pre-WTO period. However, area, production and yield showed significant increase during post-WTO period as well as in overall period because of the introduction of BT-cotton due to which the infestation of ball warms has been reduced. Production and yield of sugarcane increased significantly up to 8.22 and 0.67 per cent respectively during pre-WTO period as well as 14.1 and 9.85 per cent in post-WTO period. However, area, production and yield were significantly increased in overall period. In case of soybean, area and production showed significantly decline during post -WTO period as well as overall period but yield increased significantly during post-WTO period and in overall period. This finding is similar to Singh and Chandra (2001).
Compound growth rate of area, production and yield in pre-WTO (1982-83 to 1994-95), post-WTO (1995-96 to 2017-18) and overall period (1982-83 to 2017-18) of South Gujarat It can be observed from Table 4.4 that the area of rice declines significantly by -16.98 per cent during pre-WTO period but production and yield showed significant increase up to 4.23 and 2.70 per cent respectively during this period. However, area, production and yield increased significantly during post-WTO period as well as in overall period. It might be because of the changes in pattern of rainfall in South Gujarat supporting its higher water holding capacity, introduction of dwarf varieties providing higher yield. In case of Pearl millet, production increased significantly up to 0.92 per cent but yield was decline by -0.59 per cent significantly during pre-WTO period. Whereas area and production decline significantly during both post-WTO period and in overall period, however yield increased significantly during both post-WTO period and in overall period. Area, production and yield of maize increased significantly during pre-WTO period, post-WTO period as well as in overall period. In case of wheat, area, production and yield were decline significantly by -1.93, -2.79 and -0.87 per cent respectively during pre-WTO period. However, Area, production and yield were increased significantly during post-WTO period as well as in overall period probably due to the introduction and implementation of the new technologies and machineries. The consumption of wheat-based products has also been increased in market. Area, production and yield of gram decline significantly by -2.28, -3.40 and -1.14 per cent respectively during pre-WTO period. However, area, production and yield of gram crop were increased significantly up to 6.94, 10.00 and 2.91 per cent respectively during post-WTO period and 3.63, 5.39 and 1.70 per cent in overall period might be due to the introduction of new resistant varieties incorporated with seed treatment which helps in preventing various diseases and pests and increased the yield. Area, production and yield of black gram decline significantly by -1.35, -2.10 and-0.75 per cent respectively during pre-WTO period but area and yield were increased significantly up to 0.13 and 2.27 per cent respectively during post-WTO period. However, in overall period production and yield were increased significantly up to 1.24 and 1.39 per cent respectively. Area, production and yield of green gram decline significantly by -0.49, -3.63 and -3.16 per cent respectively during pre-WTO period. During post-WTO period, area and yield showed significantly increased up to 7.99 and 1.20 per cent however in overall period area and production increased up to 3.60 and 4.19 per cent significantly. In case of groundnut, area showed significant decline by -0.10 per cent whereas production and yield increased up to 3.47 and 3.58 per cent significantly during pre-WTO period. Area and production decline significantly by -4.45 and -2.37 per cent respectively during post-WTO period but yield increased up to 2.17 per cent significantly during this period. However, in overall period Area decline significantly by -2.63 per cent but yield increased up to 2.40 per cent significantly. Area and yield of castor increased significantly up to 0.96 and 5.55 per cent respectively during pre-WTO period, however in post-WTO period production increased up to 8.13 per cent significantly but yield was decline by -0.79 per cent significantly, while Area, production and yield increased significantly during overall period. In case of cotton area and production decline significantly by -3.17 and -1.02 per cent but yield showed significant increase up to 9.66 per cent during pre-WTO period. However, area, production and yield increased significantly during post-WTO period as well as in overall period. Area, production and yield of sugarcane increased significantly during pre-WTO period. During post-WTO period area showed decline by -0.31 per cent significantly, but production and yield increased significantly up to 11.01 and 11.41 per cent main reason for reduced area of sugarcane is farmers are moving towards horticultural crop. However, in overall period area, production and yield of sugarcane increased significantly. This result is similar to Saraswati et al. (2012) [7] .
Compound growth rate of area, production and yield in pre-WTO (1982-83 to 1994-95), post-WTO (1995-96 to 2017-18) and overall period (1982-83 to 2017-18) of Gujarat State It can be observed from Table 4.5 that the area, production and yield of rice increased significantly up to 1.81, 4.43 and 2.57 per cent respectively during pre-WTO period, 1. 67, 4.47 and 2.74 per cent in post-WTO period as well as 1.57, 3.77 and 2.17 per cent in overall period. In case of Pearl millet, area declined by -1.15 per cent significantly during pre-WTO period whereas yield showed increased up to 0.69 per cent significantly during this period. However, in post-WTO period area and production decline significantly by -4.25 and -0.53 per cent respectively but yield showed increased up to 3.88 per cent significantly. Area, production and yield of maize increased significantly during pre-WTO, post-WTO period as well as in overall period. In case of wheat, area, production and yield increased significantly during pre-WTO period, post-WTO period and in overall period exclude area in pre-WTO period. Area of gram increased up to 1.55 per cent significantly during pre-WTO period but there was significant decline by -0.30 and -1.83 per cent in production and yield during this period. During post-WTO period and in overall period, area, production and yield of gram increased significantly. In case of black gram, area, production and yield increased significantly up to 6.55, 8.85 and 2.15 per cent respectively during pre-WTO period whereas area showed significant decline by -0.72 per cent and production and yield showed significant increase up to 0.70 and 1.44 per cent respectively during post-WTO period. Production and Yield showed significant increase up to 2.13 and 1.55 per cent respectively in overall period. Area and production of green gram increased significantly up to 2.21 and 0.23 per cent respectively during pre-WTO period but there was significant decline by -1.91 per cent in yield during this period. During post-WTO period, area showed significant decrease by -0.10 per cent while production and yield of green gram increased significantly up to 2.25 and 2.36 per cent. maize (6.44%) while lowest in black gram (1.24%). The compound growth rate of yield was observed highly significant in sugarcane (3.99%) followed by pearl millet (3.35%) while lowest in green gram (0.56%). In the pre-WTO era in Gujarat state, among the major crops, there was a notably significant compound growth rate of area for black gram (6.55%), followed by castor (5.61%), while wheat had the lowest rate (0.57%). In terms of production, castor demonstrated a highly significant growth rate (10.42%), succeeded by black gram (8.85%), with green gram having the lowest rate (0.23%). As for yield, rice exhibited a highly significant growth rate (2.57%), trailed by black gram (2.15%), while pearl millet had the lowest rate (0.69%). Transitioning to the post-WTO period, in Gujarat state, among the major crops, soybean showed a highly significant compound growth rate of area (5.58%), followed by gram (5.03%), while sugarcane had the lowest rate (0.06%). In terms of production, sugarcane displayed a highly significant growth rate (10.67%), followed by gram (8.48%), while black gram had the lowest rate (0.70%). As for yield, sugarcane demonstrated a highly significant growth rate (10.60%), followed by pearl millet (3.88%), while maize had the lowest rate (1.02%). Looking at the overall period in Gujarat state, among the major crops, soybean exhibited a highly significant compound growth rate of area (5.58%), followed by castor (4.07%), while black gram had the lowest rate (0.56%). In terms of production, soybean showcased a highly significant growth rate (7.85%), followed by sugarcane (6.80%), while pearl millet had the lowest rate (0.084%). As for yield, cotton displayed a highly significant growth rate (4.92%), followed by sugarcane (4.24%), while green gram had the lowest rate (1.66%).
Figures and tables from the paper
| Crop | Pre-WTO (1982-83 to 1994-95) | — | — | Post-WTO (1995-96 to 2017-18) | — | — | Overall (1982-83 to 2017-18) | — | — |
|---|---|---|---|---|---|---|---|---|---|
| Area | Production | Yield | Area | Production | Yield | Area | Production | Yield | |
| Rice | 3.02** | 8.39** | 5.21** | -4.34** | -2.71** | 1.69** | -1.09 | 1.77* | 2.89** |
| Pearl millet | -1.37** | -1.31** | 0.06** | -2.67** | 2.59** | 5.42** | -1.54** | 1.82** | 3.42** |
| Maize | 2.60** | 7.40** | 4.67** | -3.54** | -3.00** | 0.55** | -0.85* | 1.23 | 2.10** |
| Wheat | 0.56** | 1.57** | 1.00** | 4.78** | 5.72** | 0.88** | 3.38** | 4.08** | 0.67** |
| Gram | 0.46** | 0.13** | -0.32** | 7.89** | 9.61* | 1.59** | 3.93** | 4.59** | 0.63* |
| Black gram | 9.65** | 13.93** | 3.90** | -0.48** | 0.26** | 0.75** | 0.59 | 1.98 | 1.37* |
| Green gram | 1.41** | 0.06** | -1.33** | -0.77** | 1.96** | 2.77** | 0.73 | 2.67 | 1.93 |
| Groundnut | -2.23** | 4.24** | 0.52** | 3.59** | 7.01** | 3.29** | 1.86** | 4.51** | 2.60** |
| Castor | 3.99** | 8.58** | 6.66** | 3.19** | 4.78** | 1.53** | 3.41** | 5.37** | 1.89** |
| Cotton | -6.66** | -5.41** | 4.41** | 3.20** | 8.72** | 5.34** | 1.90** | 6.12** | 4.14** |
| Sugarcane | -6.89** | -6.41** | 1.32** | -18.6** | -23.0** | -35.4 | -1.53** | -1.94** | -2.56 |
| Soybean | NA | NA | NA | 5.15** | 5.01** | 7.29** | 5.15** | 5.01** | 7.29** |
Table text extracted from the original PDF; superscript letters are shown inline. The original table image is below.
View original table image
| Crop | Pre-WTO (1982-83 to 1994-95) | — | — | Post-WTO (1995-96 to 2017-18) | — | — | Overall (1982-83 to 2017-18) | — | — |
|---|---|---|---|---|---|---|---|---|---|
| Area | Production | Yield | Area | Production | Yield | Area | Production | Yield | |
| Rice | -16.98** | -16.40** | 0.70** | -3.19** | -5.11** | -9.69 | -1.02** | -10.03** | -7.36 |
| Pearl millet | -1.02** | 0.72 | 1.76** | -9.74** | -6.85** | 3.20** | -6.47** | -2.85** | 3.87** |
| Maize | 4.69NS | 7.54** | 2.72** | -9.69** | -8.81** | 0.98** | -4.0*** | -2.44 | 1.62** |
| Wheat | 0.64 | 2.02** | 1.36** | 4.91** | 6.40** | -0.62** | 2.57** | 4.24** | 0.69** |
| Gram | -1.26** | -3.06** | -1.82** | 6.03** | 10.06** | 3.80** | 3.77** | 6.47** | 2.59** |
| Black gram | 18.40** | 15.76* | -2.23** | -0.19** | 1.68** | 1.88** | 3.93** | 6.06** | 2.04** |
| Green gram | 9.18** | 4.43** | -4.35** | -0.09** | 1.40** | 1.50** | 1.09* | 3.21** | 2.10 |
| Groundnut | 0.28 | 1.68 | 0.71** | -1.47** | 3.00** | 4.54** | -0.53** | 3.92** | 4.48** |
| Castor | 28.91** | 35.34** | 1.40** | 3.44** | 3.81** | 0.36** | 9.38** | 12.26** | 2.63** |
| Cotton | 0.14** | 5.56** | 4.98** | 4.53** | 8.52** | 3.82** | 4.31** | 8.40** | 3.92** |
| Sugarcane | -6.23** | -5.56** | 5.41** | -4.70** | 4.75** | 9.92** | -4.79** | -0.98 | 4.94** |
| Soybean | NA | NA | NA | 3.87** | 2.91* | 5.50** | 3.87** | 2.91* | 5.50** |
Table text extracted from the original PDF; superscript letters are shown inline. The original table image is below.
View original table image
| Crop | Pre-WTO (1982-83 to 1994-95) | — | — | Post-WTO (1995-96 to 2017-18) | — | — | Overall (1982-83 to 2017-18) | — | — |
|---|---|---|---|---|---|---|---|---|---|
| Area | Production | Yield | Area | Production | Yield | Area | Production | Yield | |
| Rice | 2.02** | 4.74** | -3.87** | 1.99** | 5.98** | 3.91** | 1.89** | 4.79** | 2.85** |
| Pearl millet | -0.66** | -1.21** | -0.55** | -1.96** | 0.63** | 2.64** | -1.69** | 0.43 | 2.16** |
| Maize | 1.27** | 1.64** | 0.35** | 1.72** | 3.10** | 1.35** | 1.90** | 3.27** | 1.34** |
| Wheat | 1.06** | 1.50** | 0.43** | 4.67** | 6.79** | 2.02** | 3.35** | 5.00** | 1.60** |
| Gram | 5.71** | 3.39** | -2.19** | 3.66** | 6.57** | 2.81** | 2.02** | 2.94** | 0.89** |
| Black gram | 6.52** | 12.52** | 5.64** | -2.43** | -0.45** | 2.03** | -0.54** | 1.66 | 3.09** |
| Green gram | 2.79* | 4.00** | 1.17** | 1.07** | 1.72* | 0.63** | -0.07 | 1.19 | 1.27 |
| Groundnut | -3.08** | -1.01** | 2.13** | -4.65** | -2.69** | 2.05** | -5.65** | -3.96** | 1.78** |
| Castor | 6.72** | 11.66** | -0.53** | 3.30** | 5.33** | 1.16** | 3.30** | 5.36** | 2.00** |
| Cotton | -3.46** | -1.55** | -3.87** | 0.48** | 5.87** | 1.47** | 0.45* | 4.35** | 3.88** |
| Sugarcane | 7.50 | 8.22** | 0.67** | 3.89 | 14.1** | 9.85** | 4.20** | 8.30** | 3.93** |
| Soybean | NA | NA | NA | -5.00** | -3.69** | 1.37* | -5.00** | -3.69** | 1.37* |
Table text extracted from the original PDF; superscript letters are shown inline. The original table image is below.
View original table image
| Crop | Pre-WTO (1982-83 to 1994-95) | — | — | Post-WTO (1995-96 to 2017-18) | — | — | Overall (1982-83 to 2017-18) | — | — |
|---|---|---|---|---|---|---|---|---|---|
| Area | Production | Yield | Area | Production | Yield | Area | Production | Yield | |
| Rice | 1.81** | 4.43** | 2.57** | 1.67** | 4.47** | 2.74** | 1.57** | 3.77** | 2.17** |
| Pearl millet | -1.15** | -0.46 | 0.69** | -4.25** | -0.53** | 3.88** | -2.92** | 0.084 | 3.10** |
| Maize | 1.85** | 3.51** | 1.63** | 0.37** | 1.40** | 1.02** | 1.21** | 2.72** | 1.49** |
| Wheat | 0.57 | 1.47** | 0.89** | 4.74** | 6.26** | 1.44** | 2.99** | 4.29** | 1.25** |
| Gram | 1.55** | -0.30** | -1.83** | 5.03** | 8.48** | 3.27** | 2.57** | 4.32** | 1.70** |
| Black gram | 6.55** | 8.85** | 2.15** | -0.72** | 0.70** | 1.44** | 0.56 | 2.13** | 1.55** |
| Green gram | 2.21** | 0.23** | -1.91** | -0.10** | 2.25** | 2.36** | 0.77 | 2.45 | 1.66 |
| Groundnut | -0.007 | 1.75 | 1.76** | -0.52** | 3.24** | 3.78** | -0.37* | 3.55** | 3.95** |
| Castor | 5.61** | 10.42** | -5.77** | 4.01** | 4.66** | 1.98** | 4.07** | 5.83** | 1.69** |
| Cotton | -2.08** | 1.84** | -12.33** | 3.39** | 7.87** | -0.82** | 2.99** | 7.01** | 4.92** |
| Sugarcane | 3.94** | 4.93** | 0.95** | 0.06** | 10.67** | 10.60** | 2.44** | 6.80** | 4.24** |
| Soybean | NA | NA | NA | 5.58** | 7.85** | 2.15* | 5.58** | 7.85** | 2.15* |
Table text extracted from the original PDF; superscript letters are shown inline. The original table image is below.
View original table image
References
8 in the original paper- Table 5: Compound growth rate of area, production and yield in pre-WTO (1982-83 to 1994-95), post-WTO (1995-96 to 2017-18) and overall period (1982-83 to 2017-18) of Gujarat State Crop Pre-WTO (1982-83 to 1994-95)
- Anonymous. Agricultural development and distribution of gains: An inter-regional and intra-regional analysis in Uttar Pradesh. Agricultural Situation in India. 1993;68(2):95-97.
- Badole WP, Patil ER. Growth rates of major crops and fertilizer consumption of Nagpur region of Maharashtra. Int. J Appl. Agric. Hort. Sci. 2013, 4(6).
- Jadhav SK, Deshmukh KV. Agricultural development in Maharashtra State by estimating growth rates of area, production, and productivity of major crops grown and fertilizer consumption pattern. Econ. Aff. 2014;59(1):162.
- Sangeeta, Bala K. Estimate the trend scenario of selected inputs and outputs of the agricultural sector in Haryana, India. Res. J Agric. Forestry Sci. 2015;3(6):16-18.
- Srivastava SK, Kolady D. Agricultural biotechnology and crop productivity: Macro-level evidences on the contribution of Bt. cotton in India. Curr. Sci. 2016;110(3):1-9.
- Mander GS, Sharma JL. Production Performance of Cereal Crops in India-State-wise Analysis. Agricultural situation in India. 1995;50:57-62.
- Jalikatti V, Poddar RS. An economic analysis of changing cropping pattern in Almatti Command Area of Karnataka, India. Int. J Curr. Microbiol. Appl. Sci. 2019;8(10):1052-9.
Cited by 1
From OpenAlex, OpenCitations and reference lists read by Scinovex
- Growth and instability of major food grain crops in Andhra Pradesh
PR Kolhe, RR Nirgude, RB Hile, PP Jagtap, SJ Shinde · International Journal of Agriculture Extension and Social Development · 2026
Food grains are important for ensuring food and nutritional security and supporting rural livelihoods. This study analyzed the growth and instability in the area, production and productivity of major food grain crops in Andhra Pradesh during 2004-05 to 2023-24. The study covered rice, jowar, ragi, gram, maize, bajra, tur and urad, with the study period divided into Period I (2004-05 to 2013-14), Period II (2014-15 to 2023-24) and the overall period. Compound Annual Growth Rate (CAGR) was used to estimate growth, while the Cuddy-Della Valle Instability Index (CDVI) was employed to measure insta