
Research article · 2023 · Full text
International Journal of Statistics and Applied MathematicsAnalysis of senescent and non-senescent mortality
Volume 8(6S) · Pages 962–968 · DOI: 10.22271/maths.2023.v8.i6sm.1491 ↗
Research areasChild Nutrition and Water AccessInsurance, Mortality, Demography, Risk Management
Abstract
Author-writtenIn the present paper, we calculated the cause-specific deaths and then carried out the analysis for senescent and non-senescent mortality. We observe that the new borns will eventually die from causes combined due to senescent are more as compared to causes combined due to non-senescent mortality. We see the proportion of male/female who survives to age x that will die from cause senescent is more as compared to cause non-senescent. We observe change in the distribution of deaths in non-senescent and senescent by age for male and female populations of India. The deaths in senescent are more compared to non-senescent for both male and female populations.
Summary
Source-checkedPlain-language reading of the full paper, prepared with AI and checked against the text. Each point links to the authors' own words.
Why it matters
- Research into human mortality focuses on understanding how the aging process and specific causes of death influence changes in life expectancy over time. View evidence ↗
- Mortality is generally distinguished between intrinsic causes, such as non-senescent biological factors, and extrinsic causes, such as aging or senescent factors. View evidence ↗
- Senescent mortality results from biological aging and is inevitable, though it can be postponed, while non-senescent deaths are unrelated to aging and can potentially be avoided. View evidence ↗
The question
- The study aims to analyze patterns of non-senescent and senescent mortality by constructing cause-specific life tables. View evidence ↗
What they did
- The authors classified senescent deaths as those caused by cancer, cardiovascular disease, tuberculosis, and lip/oral cavity issues, while non-senescent deaths included HIV, vector-borne diseases, and chronic respiratory disease. View evidence ↗
- The analysis used cause-specific death data sourced from the Global Burden of Disease (GBD) results database. View evidence ↗
- The researchers used a multiple decrement table approach, starting with a basic life table for all causes and adding columns for individual causes of death. View evidence ↗
What they found
- In the Indian male population, malaria deaths were highest in the 0-1 age interval (2,316 deaths) and lowest in the 85+ age group (12 deaths). View evidence ↗
- Infant deaths due to cardiovascular disease were recorded as 505 for males and 431 for females. View evidence ↗
- For the year 2019, non-senescent infant deaths in India were 3,122 for males and 3,394 for females. View evidence ↗
- Infant deaths attributed to senescent mortality were 2,844 for males and 2,687 for females. View evidence ↗
- Across both male and female populations, deaths due to senescent causes were more frequent than those due to non-senescent causes. View evidence ↗
- The study found that senescent mortality rates were higher than non-senescent mortality rates for both sexes. View evidence ↗
- The highest proportion of decrement occurred at age 80, while the lowest was observed in infants for both males and females. View evidence ↗
What it means
- The authors conclude that senescent mortality peaks around ages 65 and 70, while non-senescent mortality is higher at ages 75 and 80. View evidence ↗
- The authors state that in the Indian population, the proportion of deaths due to senescence is greater than those due to non-senescent causes. View evidence ↗
Visual summary
3 visualsIllustrations explain the paper; charts are replotted from the paper's own table values.
Mortality Classification
AI-generated conceptual illustration (human internal organs and pathogens). It explains the idea and does not show study data.
View source evidence ↗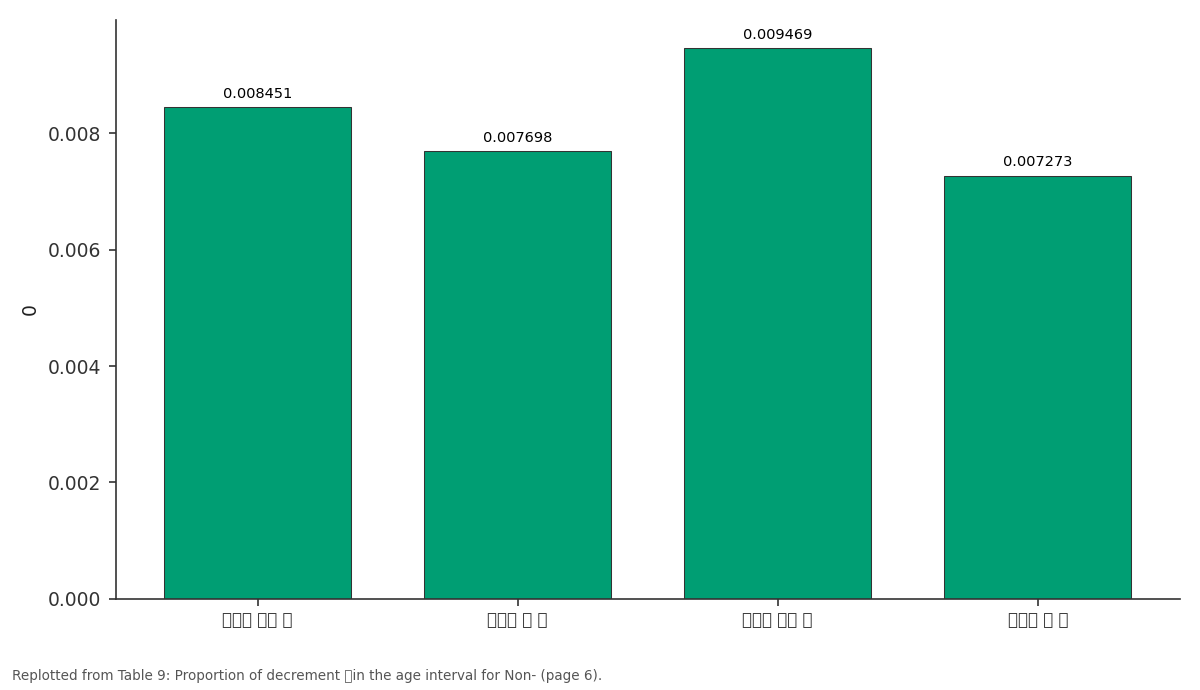
0: 𝑴𝑹𝒊 𝑵𝑺 𝒙 vs 𝑴𝑹𝒊 𝑺 𝒙 vs 𝑭𝑹𝒊 𝑵𝑺 𝒙 vs 𝑭𝑹𝒊 𝑺 𝒙
Replotted from Table 9 (page 6) of the original paper. Every bar is the paper's own table value.
View source evidence ↗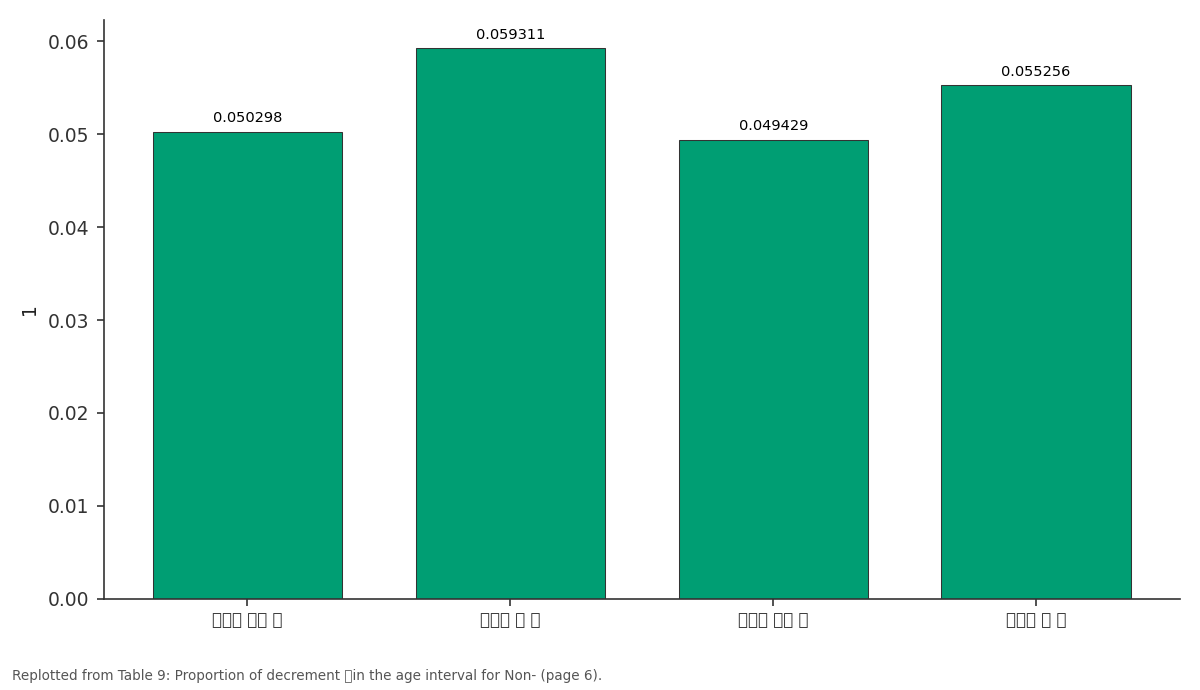
1: 𝑴𝑹𝒊 𝑵𝑺 𝒙 vs 𝑴𝑹𝒊 𝑺 𝒙 vs 𝑭𝑹𝒊 𝑵𝑺 𝒙 vs 𝑭𝑹𝒊 𝑺 𝒙
Replotted from Table 9 (page 6) of the original paper. Every bar is the paper's own table value.
View source evidence ↗Figures & tables
From the original paper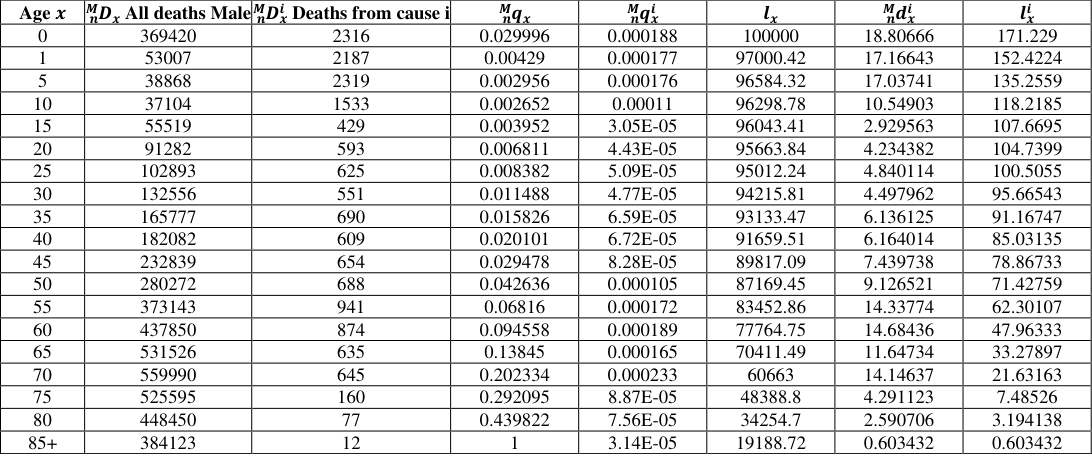 Table 1
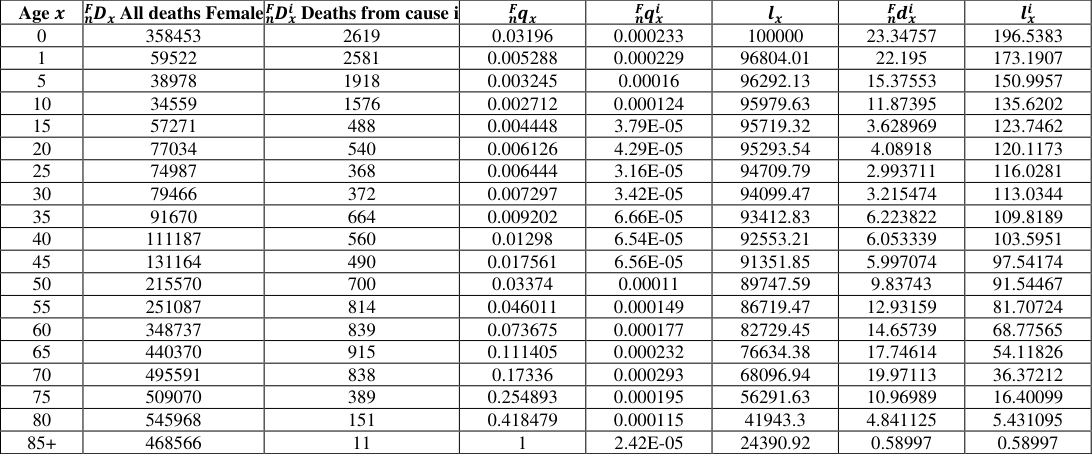 Table 2
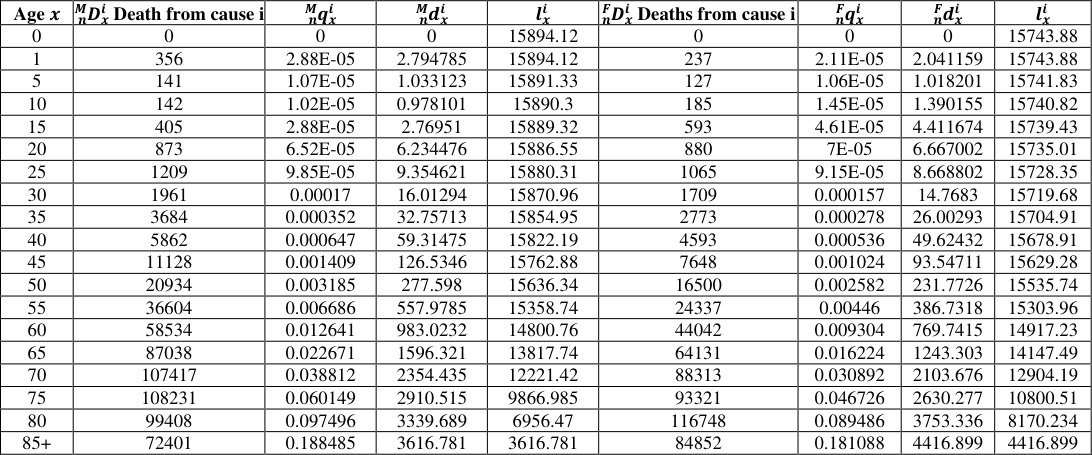 Table 3
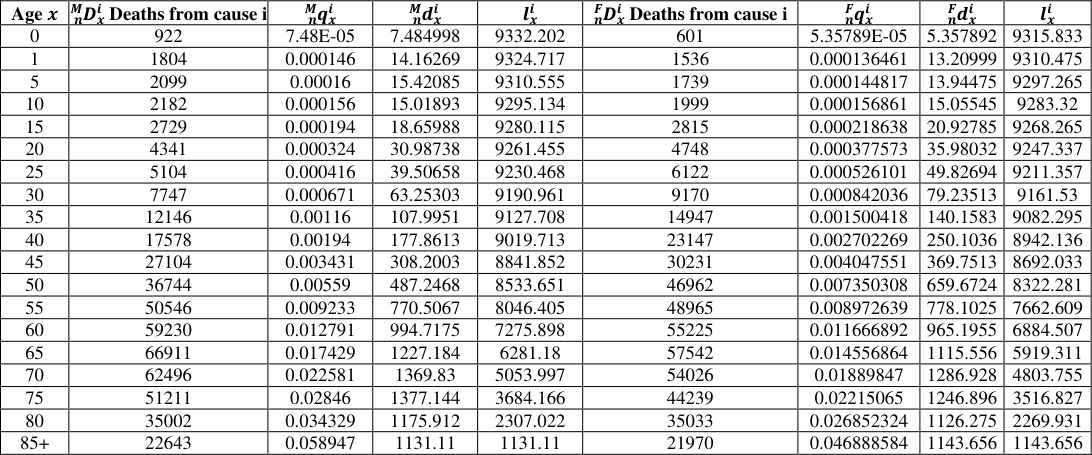 Table 4
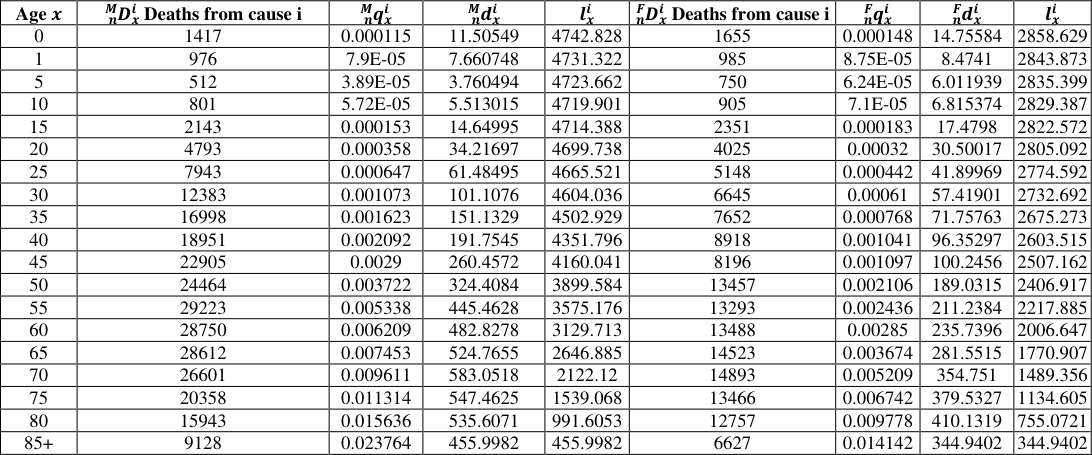 Table 5
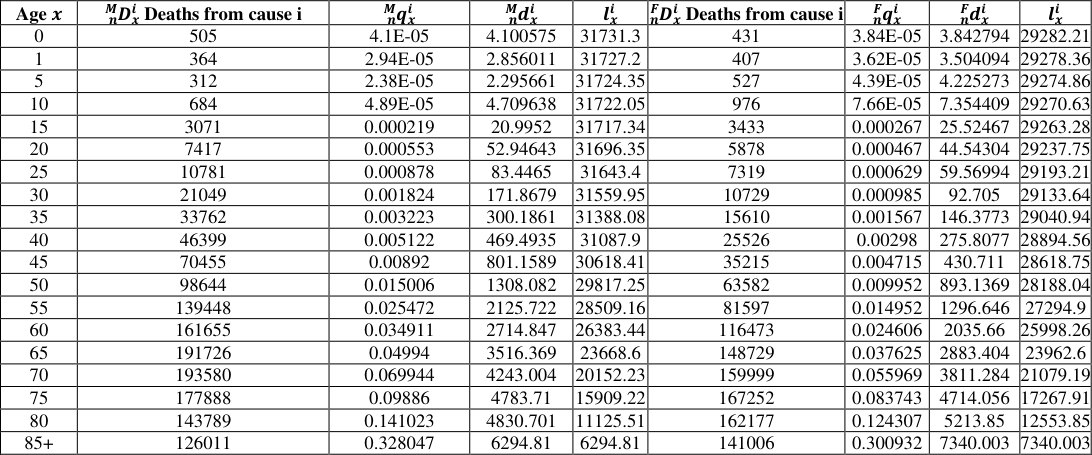 Table 6
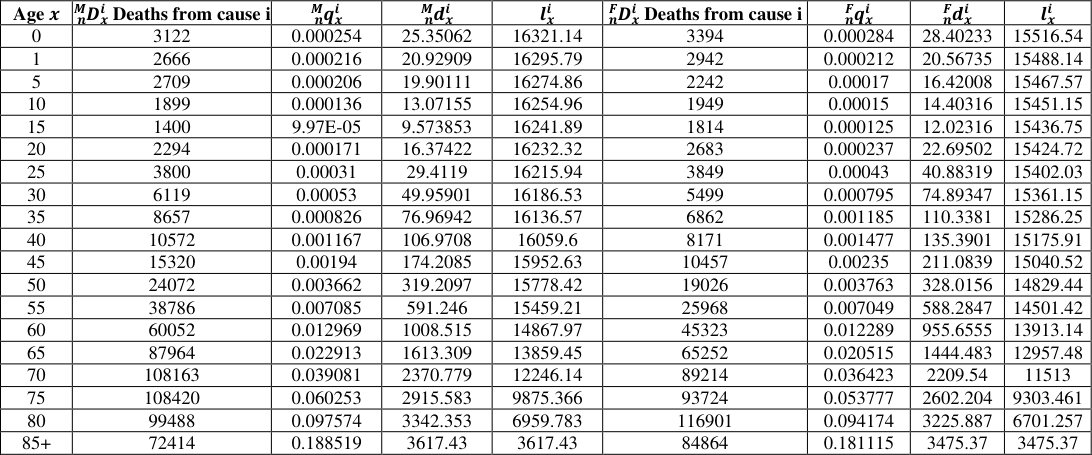 Table 7
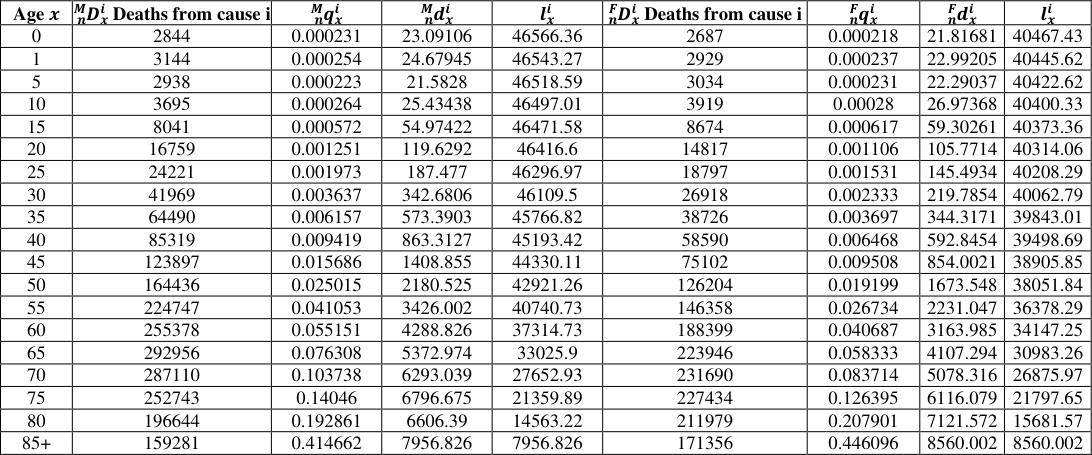 Table 8
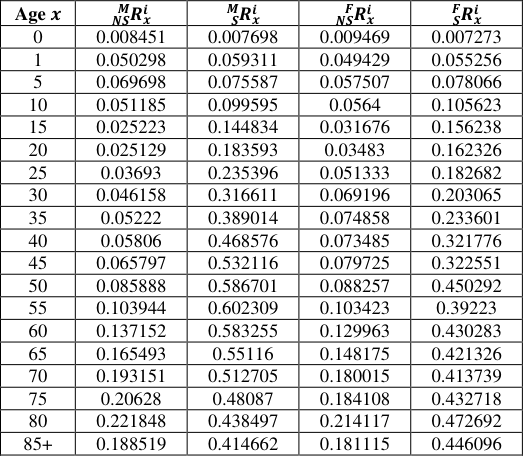 Table 9
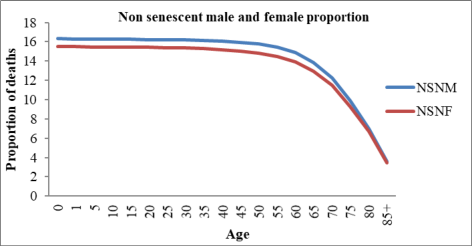 Figure 1
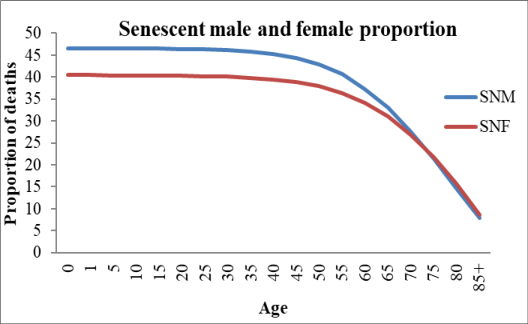 Figure 2
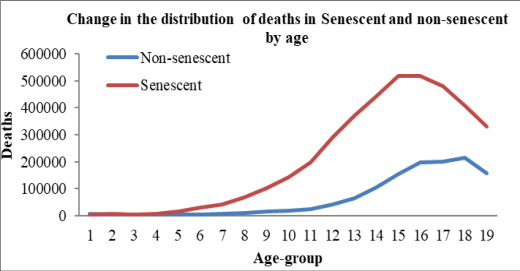 Figure 3
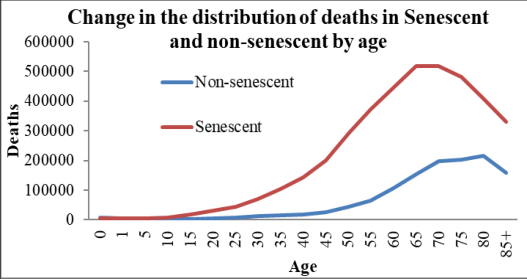 Figure 4
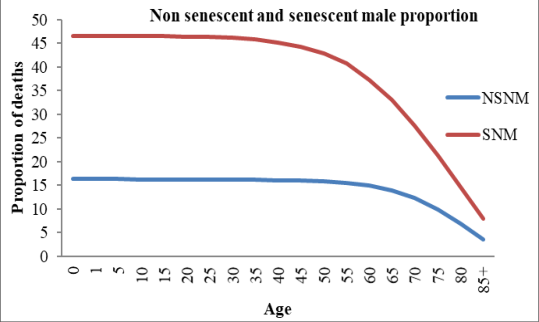 Figure 5
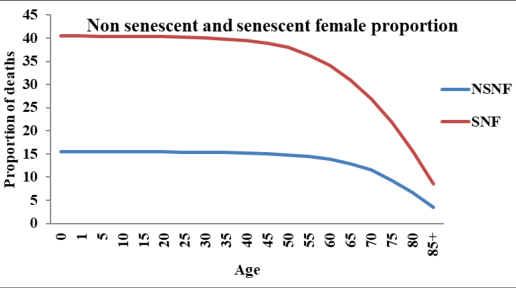 Figure 6
Introduction
Over the decades life expectancy in human life has changed and it's been focus of research to understand the human mortality due to aging process and cause of death. The study accounts with an impact of intrinsic and extrinsic factors of mortality. Mainly, the distinction is made between intrinsic cause of death as it is due to biological factors (causes), like non-senescent (Carnes et al., 2006) [3] and extrinsic cause of death due to external causes or environmental factors causes deaths, like aging or senescent (Makeham, 1867; Finch, 1994) [9,5] . The effect of extrinsically imposed mortality on the evolution of senescence has received considerable attention. Population dynamics that are density independent should not be affected by extrinsic mortality is influenced by age if population growth is dependent on density and populations are stable. The possibility of extrinsic mortality leads to increase in senescence rates at all ages, but also leads to decrease in rates at all ages or both at all ages (Abrams, 1993) [1] . The author presented a simple theoretical analysis of how extrinsic mortality should affect the rate of senescence (i.e., the rate at which probability of mortality increases with age) under different evolutionary and population dynamical assumptions. Intrinsic mortality is due to causes of death arising primarily within an organism, while extrinsic mortality originates from outside (Carnes et al., 2006; Caswell, 2007a) [3,4] . The rate of senescence can be inferred from acceleration by which mortality rates increase over age. Such a senescence rate is generally estimated from parameters of a mathematical model fitted to these mortality rates. According to the fundamental precept of classical theories of senescence, rapid intrinsic deterioration, or aging, is favored by environments with a high mortality risk. This prediction has received mixed empirical support, despite being frequently cited as being largely supported by the data that are currently available. This expectation should only be realized in specific situations, according to recent theory, which could explain the ambiguous empirical results (Williams, et al., 2006) [11] . Bongaarts (2009) [2] examined the pattern in two main components of mortality. One is senescent mortality, which is the result of biological ageing; it can be postponed through medical intervention and lifestyle adjustments, but it cannot be avoided because death is inevitable. The other non-senescent deaths unrelated to ageing (e.g., accidents, certain infections), which can be avoided by effective public health medical intervention and taking safety measures. Non-senescent mortality has reached very low levels and nearly all deaths are now due to senescence. Therefore, the key question for forecasters is whether and how rapidly senescent mortality is changing and how these trends affect future life expectancy. Cellular senescence is an underlying mechanism of aging and age-related conditions and also a process in which cells lose the ability to divide and damage neighboring cells by the factors they secrete, collectively referred as the senescence-associated secretory phenotype (SASP). Le Brasseur et al. (2015) [7] discussed the concept of cellular senescence, review the evidence that implicates cellular senescence and SASP in age-related deterioration, hyper proliferation, and inflammation, and proposed underlying mechanism of aging which play a fundamental role in the biology of frailty (See also Macieira-Coelho, 2014) [8] . In the present paper we considered the patterns in nonsenescent (background) and senescent mortality by means of constructing the columns of life tables based on death rates by cause of death. We compare the survival patterns for each cause of death, non-senescent and senescent deaths using cause of death information. We classify the total deaths (male and female) according to Bongaarts (2009) [2] due to different causes into senescent and non-senescent. Senescent deaths include the deaths due to total cancer, cardio vascular disease (CVD), Lip & oral cavity and tuberculosis (TB), where as non-senescent deaths include deaths due to human immune deficiency virus (HIV), vector borne disease and chronic respiratory disease. , 𝑅 𝑖 is the constant of proportionality for decrement 𝑖 in the age interval. Also, by the assumption of proportionality, the value of 𝑅 𝑖 , in the age interval is equal the ratio of the observed decrements from cause 𝑖 to the decrements for all causes combined. Also
Materials and Methods
Materials and Methods
Constructing a multiple decrement
Constructing a multiple decrement
Results and Discussion
We have used a single decrement life table for all causes of deaths combined (Rangoli and Talawar, 2023) [10] to construct different columns for each causes of death. In the construction, we have calculated cause-specific deaths and then carried out the analysis for senescent and non-senescent mortality (Source of data: https://vizhub.healthdata.org/gbd-results/). From Table 1 of male population of India, we observe the number of deaths by the cause Malaria (Vector Borne Disease). The highest number of deaths in the population in the age-interval 0-1 i.e., 2316 and lowest number of deaths during the age 85+ i.e., 12 are observed. In the middle age-groups, from 15-20 to 70-75 no much variation of deaths observed. The sudden decline of deaths is noticed after 75+ ages. Similar observations are made in the case female population of India (Table 2). From Table 6 of male and female population, we observe the number of deaths by the cause cardiovascular disease. The numbers of infant's death for male and female are 505 and 431 respectively. We notice that increase in number of male and female deaths during the age-groups 10-75 and 10-80 for respective populations. Then decline in deaths for both the populations is observed from age 75 and 80. Table 7 gives mortality pattern of non-senescence of male and female population of India for the year 2019. From the table, we observe that the number of infant's death for male and female is 3122 and 3394 respectively. The decrease in number of deaths is observed in the interval 1-5 to 15-20 age-groups for both male and female populations. Then increase in numbers of deaths is observed during the ages 20-80 and 20-85 for respective populations. The decline in deaths for both populations is observed from age 80+ and 85 above. Table 8 gives pattern of senescent mortality of male and female population. We observe from table that number of deaths by the cause senescent mortality and the number of infant's death for male and female population are 2844 and 2687 respectively. We observe that there is an increase in number of deaths from 0-70 and 0-75 age-groups for male and female populations. The decline in number of deaths is observed above the ages 70 and 75 respectively. Table 3 gives mortality and survival patterns due to chronic respiratory disease for male and female population of India for the year 2019. From the table, we observe that number of deaths by the cause chronic respiratory disease. The numbers of male and female deaths are not observed during an ageinterval 0-1. Then from the age-group 5-75 and 5-80, there is a continuous increase in deaths for male and female population. The decline of deaths is noticed after 75+ and 80+ ages for respective populations.
| Age 𝒙 | 𝑴𝑫𝒊 Deaths from cause i 𝒏 𝒙 | 𝑴𝒒𝒊 𝒏 𝒙 | 𝑴𝒅𝒊 𝒏 𝒙 | 𝒍𝒊 𝒙 | 𝑭𝑫𝒊 Deaths from cause i 𝒏 𝒙 | 𝑭𝒒𝒊 𝒏 𝒙 | 𝑭𝒅𝒊 𝒏 𝒙 | 𝒍𝒊 𝒙 |
|---|---|---|---|---|---|---|---|---|
| 0 | 2844 | 0.000231 | 23.09106 | 46566.36 | 2687 | 0.000218 | 21.81681 | 40467.43 |
| 1 | 3144 | 0.000254 | 24.67945 | 46543.27 | 2929 | 0.000237 | 22.99205 | 40445.62 |
| 5 | 2938 | 0.000223 | 21.5828 | 46518.59 | 3034 | 0.000231 | 22.29037 | 40422.62 |
| 10 | 3695 | 0.000264 | 25.43438 | 46497.01 | 3919 | 0.00028 | 26.97368 | 40400.33 |
| 15 | 8041 | 0.000572 | 54.97422 | 46471.58 | 8674 | 0.000617 | 59.30261 | 40373.36 |
| 20 | 16759 | 0.001251 | 119.6292 | 46416.6 | 14817 | 0.001106 | 105.7714 | 40314.06 |
| 25 | 24221 | 0.001973 | 187.477 | 46296.97 | 18797 | 0.001531 | 145.4934 | 40208.29 |
| 30 | 41969 | 0.003637 | 342.6806 | 46109.5 | 26918 | 0.002333 | 219.7854 | 40062.79 |
| 35 | 64490 | 0.006157 | 573.3903 | 45766.82 | 38726 | 0.003697 | 344.3171 | 39843.01 |
| 40 | 85319 | 0.009419 | 863.3127 | 45193.42 | 58590 | 0.006468 | 592.8454 | 39498.69 |
| 45 | 123897 | 0.015686 | 1408.855 | 44330.11 | 75102 | 0.009508 | 854.0021 | 38905.85 |
| 50 | 164436 | 0.025015 | 2180.525 | 42921.26 | 126204 | 0.019199 | 1673.548 | 38051.84 |
| 55 | 224747 | 0.041053 | 3426.002 | 40740.73 | 146358 | 0.026734 | 2231.047 | 36378.29 |
| 60 | 255378 | 0.055151 | 4288.826 | 37314.73 | 188399 | 0.040687 | 3163.985 | 34147.25 |
| 65 | 292956 | 0.076308 | 5372.974 | 33025.9 | 223946 | 0.058333 | 4107.294 | 30983.26 |
| 70 | 287110 | 0.103738 | 6293.039 | 27652.93 | 231690 | 0.083714 | 5078.316 | 26875.97 |
| 75 | 252743 | 0.14046 | 6796.675 | 21359.89 | 227434 | 0.126395 | 6116.079 | 21797.65 |
| 80 | 196644 | 0.192861 | 6606.39 | 14563.22 | 211979 | 0.207901 | 7121.572 | 15681.57 |
| 85+ | 159281 | 0.414662 | 7956.826 | 7956.826 | 171356 | 0.446096 | 8560.002 | 8560.002 |
Table text extracted from the original PDF; superscript letters are shown inline. The original table image is below.
View original table image
| Age 𝒙 | 𝑴𝑫𝒊 Deaths from cause i 𝒏 𝒙 | 𝑴𝒒𝒊 𝒏 𝒙 | 𝑴𝒅𝒊 𝒏 𝒙 | 𝒍𝒊 𝒙 | 𝑭𝑫𝒊 Deaths from cause i 𝒏 𝒙 | 𝑭𝒒𝒊 𝒏 𝒙 | 𝑭𝒅𝒊 𝒏 𝒙 | 𝒍𝒊 𝒙 |
|---|---|---|---|---|---|---|---|---|
| 0 | 3122 | 0.000254 | 25.35062 | 16321.14 | 3394 | 0.000284 | 28.40233 | 15516.54 |
| 1 | 2666 | 0.000216 | 20.92909 | 16295.79 | 2942 | 0.000212 | 20.56735 | 15488.14 |
| 5 | 2709 | 0.000206 | 19.90111 | 16274.86 | 2242 | 0.00017 | 16.42008 | 15467.57 |
| 10 | 1899 | 0.000136 | 13.07155 | 16254.96 | 1949 | 0.00015 | 14.40316 | 15451.15 |
| 15 | 1400 | 9.97E-05 | 9.573853 | 16241.89 | 1814 | 0.000125 | 12.02316 | 15436.75 |
| 20 | 2294 | 0.000171 | 16.37422 | 16232.32 | 2683 | 0.000237 | 22.69502 | 15424.72 |
| 25 | 3800 | 0.00031 | 29.4119 | 16215.94 | 3849 | 0.00043 | 40.88319 | 15402.03 |
| 30 | 6119 | 0.00053 | 49.95901 | 16186.53 | 5499 | 0.000795 | 74.89347 | 15361.15 |
| 35 | 8657 | 0.000826 | 76.96942 | 16136.57 | 6862 | 0.001185 | 110.3381 | 15286.25 |
| 40 | 10572 | 0.001167 | 106.9708 | 16059.6 | 8171 | 0.001477 | 135.3901 | 15175.91 |
| 45 | 15320 | 0.00194 | 174.2085 | 15952.63 | 10457 | 0.00235 | 211.0839 | 15040.52 |
| 50 | 24072 | 0.003662 | 319.2097 | 15778.42 | 19026 | 0.003763 | 328.0156 | 14829.44 |
| 55 | 38786 | 0.007085 | 591.246 | 15459.21 | 25968 | 0.007049 | 588.2847 | 14501.42 |
| 60 | 60052 | 0.012969 | 1008.515 | 14867.97 | 45323 | 0.012289 | 955.6555 | 13913.14 |
| 65 | 87964 | 0.022913 | 1613.309 | 13859.45 | 65252 | 0.020515 | 1444.483 | 12957.48 |
| 70 | 108163 | 0.039081 | 2370.779 | 12246.14 | 89214 | 0.036423 | 2209.54 | 11513 |
| 75 | 108420 | 0.060253 | 2915.583 | 9875.366 | 93724 | 0.053777 | 2602.204 | 9303.461 |
| 80 | 99488 | 0.097574 | 3342.353 | 6959.783 | 116901 | 0.094174 | 3225.887 | 6701.257 |
| 85+ | 72414 | 0.188519 | 3617.43 | 3617.43 | 84864 | 0.181115 | 3475.37 | 3475.37 |
Table text extracted from the original PDF; superscript letters are shown inline. The original table image is below.
View original table image
| Age 𝒙 | 𝑴𝑫𝒊 Deaths from cause i 𝒏 𝒙 | 𝑴𝒒𝒊 𝒏 𝒙 | 𝑴𝒅𝒊 𝒏 𝒙 | 𝒍𝒊 𝒙 | 𝑭𝑫𝒊 Deaths from cause i 𝒏 𝒙 | 𝑭𝒒𝒊 𝒏 𝒙 | 𝑭𝒅𝒊 𝒏 𝒙 | 𝒍𝒊 𝒙 |
|---|---|---|---|---|---|---|---|---|
| 0 | 505 | 4.1E-05 | 4.100575 | 31731.3 | 431 | 3.84E-05 | 3.842794 | 29282.21 |
| 1 | 364 | 2.94E-05 | 2.856011 | 31727.2 | 407 | 3.62E-05 | 3.504094 | 29278.36 |
| 5 | 312 | 2.38E-05 | 2.295661 | 31724.35 | 527 | 4.39E-05 | 4.225273 | 29274.86 |
| 10 | 684 | 4.89E-05 | 4.709638 | 31722.05 | 976 | 7.66E-05 | 7.354409 | 29270.63 |
| 15 | 3071 | 0.000219 | 20.9952 | 31717.34 | 3433 | 0.000267 | 25.52467 | 29263.28 |
| 20 | 7417 | 0.000553 | 52.94643 | 31696.35 | 5878 | 0.000467 | 44.54304 | 29237.75 |
| 25 | 10781 | 0.000878 | 83.4465 | 31643.4 | 7319 | 0.000629 | 59.56994 | 29193.21 |
| 30 | 21049 | 0.001824 | 171.8679 | 31559.95 | 10729 | 0.000985 | 92.705 | 29133.64 |
| 35 | 33762 | 0.003223 | 300.1861 | 31388.08 | 15610 | 0.001567 | 146.3773 | 29040.94 |
| 40 | 46399 | 0.005122 | 469.4935 | 31087.9 | 25526 | 0.00298 | 275.8077 | 28894.56 |
| 45 | 70455 | 0.00892 | 801.1589 | 30618.41 | 35215 | 0.004715 | 430.711 | 28618.75 |
| 50 | 98644 | 0.015006 | 1308.082 | 29817.25 | 63582 | 0.009952 | 893.1369 | 28188.04 |
| 55 | 139448 | 0.025472 | 2125.722 | 28509.16 | 81597 | 0.014952 | 1296.646 | 27294.9 |
| 60 | 161655 | 0.034911 | 2714.847 | 26383.44 | 116473 | 0.024606 | 2035.66 | 25998.26 |
| 65 | 191726 | 0.04994 | 3516.369 | 23668.6 | 148729 | 0.037625 | 2883.404 | 23962.6 |
| 70 | 193580 | 0.069944 | 4243.004 | 20152.23 | 159999 | 0.055969 | 3811.284 | 21079.19 |
| 75 | 177888 | 0.09886 | 4783.71 | 15909.22 | 167252 | 0.083743 | 4714.056 | 17267.91 |
| 80 | 143789 | 0.141023 | 4830.701 | 11125.51 | 162177 | 0.124307 | 5213.85 | 12553.85 |
| 85+ | 126011 | 0.328047 | 6294.81 | 6294.81 | 141006 | 0.300932 | 7340.003 | 7340.003 |
Table text extracted from the original PDF; superscript letters are shown inline. The original table image is below.
View original table image
| Age 𝒙 | 𝑴𝑫𝒊 Death from cause i 𝒏 𝒙 | 𝑴𝒒𝒊 𝒏 𝒙 | 𝑴𝒅𝒊 𝒏 𝒙 | 𝒍𝒊 𝒙 | 𝑭𝑫𝒊 Deaths from cause i 𝒏 𝒙 | 𝑭𝒒𝒊 𝒏 𝒙 | 𝑭𝒅𝒊 𝒏 𝒙 | 𝒍𝒊 𝒙 |
|---|---|---|---|---|---|---|---|---|
| 0 | 0 | 0 | 0 | 15894.12 | 0 | 0 | 0 | 15743.88 |
| 1 | 356 | 2.88E-05 | 2.794785 | 15894.12 | 237 | 2.11E-05 | 2.041159 | 15743.88 |
| 5 | 141 | 1.07E-05 | 1.033123 | 15891.33 | 127 | 1.06E-05 | 1.018201 | 15741.83 |
| 10 | 142 | 1.02E-05 | 0.978101 | 15890.3 | 185 | 1.45E-05 | 1.390155 | 15740.82 |
| 15 | 405 | 2.88E-05 | 2.76951 | 15889.32 | 593 | 4.61E-05 | 4.411674 | 15739.43 |
| 20 | 873 | 6.52E-05 | 6.234476 | 15886.55 | 880 | 7E-05 | 6.667002 | 15735.01 |
| 25 | 1209 | 9.85E-05 | 9.354621 | 15880.31 | 1065 | 9.15E-05 | 8.668802 | 15728.35 |
| 30 | 1961 | 0.00017 | 16.01294 | 15870.96 | 1709 | 0.000157 | 14.7683 | 15719.68 |
| 35 | 3684 | 0.000352 | 32.75713 | 15854.95 | 2773 | 0.000278 | 26.00293 | 15704.91 |
| 40 | 5862 | 0.000647 | 59.31475 | 15822.19 | 4593 | 0.000536 | 49.62432 | 15678.91 |
| 45 | 11128 | 0.001409 | 126.5346 | 15762.88 | 7648 | 0.001024 | 93.54711 | 15629.28 |
| 50 | 20934 | 0.003185 | 277.598 | 15636.34 | 16500 | 0.002582 | 231.7726 | 15535.74 |
| 55 | 36604 | 0.006686 | 557.9785 | 15358.74 | 24337 | 0.00446 | 386.7318 | 15303.96 |
| 60 | 58534 | 0.012641 | 983.0232 | 14800.76 | 44042 | 0.009304 | 769.7415 | 14917.23 |
| 65 | 87038 | 0.022671 | 1596.321 | 13817.74 | 64131 | 0.016224 | 1243.303 | 14147.49 |
| 70 | 107417 | 0.038812 | 2354.435 | 12221.42 | 88313 | 0.030892 | 2103.676 | 12904.19 |
| 75 | 108231 | 0.060149 | 2910.515 | 9866.985 | 93321 | 0.046726 | 2630.277 | 10800.51 |
| 80 | 99408 | 0.097496 | 3339.689 | 6956.47 | 116748 | 0.089486 | 3753.336 | 8170.234 |
| 85+ | 72401 | 0.188485 | 3616.781 | 3616.781 | 84852 | 0.181088 | 4416.899 | 4416.899 |
Table text extracted from the original PDF; superscript letters are shown inline. The original table image is below.
View original table image
| Age 𝒙 | 𝑭𝑫 All deaths Female 𝒏 𝒙 | 𝑭𝑫𝒊 Deaths from cause i 𝒏 𝒙 | 𝑭𝒒 𝒏 𝒙 | 𝑭𝒒𝒊 𝒏 𝒙 | 𝒍 𝒙 | 𝑭𝒅𝒊 𝒏 𝒙 | 𝒍𝒊 𝒙 |
|---|---|---|---|---|---|---|---|
| 0 | 358453 | 2619 | 0.03196 | 0.000233 | 100000 | 23.34757 | 196.5383 |
| 1 | 59522 | 2581 | 0.005288 | 0.000229 | 96804.01 | 22.195 | 173.1907 |
| 5 | 38978 | 1918 | 0.003245 | 0.00016 | 96292.13 | 15.37553 | 150.9957 |
| 10 | 34559 | 1576 | 0.002712 | 0.000124 | 95979.63 | 11.87395 | 135.6202 |
| 15 | 57271 | 488 | 0.004448 | 3.79E-05 | 95719.32 | 3.628969 | 123.7462 |
| 20 | 77034 | 540 | 0.006126 | 4.29E-05 | 95293.54 | 4.08918 | 120.1173 |
| 25 | 74987 | 368 | 0.006444 | 3.16E-05 | 94709.79 | 2.993711 | 116.0281 |
| 30 | 79466 | 372 | 0.007297 | 3.42E-05 | 94099.47 | 3.215474 | 113.0344 |
| 35 | 91670 | 664 | 0.009202 | 6.66E-05 | 93412.83 | 6.223822 | 109.8189 |
| 40 | 111187 | 560 | 0.01298 | 6.54E-05 | 92553.21 | 6.053339 | 103.5951 |
| 45 | 131164 | 490 | 0.017561 | 6.56E-05 | 91351.85 | 5.997074 | 97.54174 |
| 50 | 215570 | 700 | 0.03374 | 0.00011 | 89747.59 | 9.83743 | 91.54467 |
| 55 | 251087 | 814 | 0.046011 | 0.000149 | 86719.47 | 12.93159 | 81.70724 |
| 60 | 348737 | 839 | 0.073675 | 0.000177 | 82729.45 | 14.65739 | 68.77565 |
| 65 | 440370 | 915 | 0.111405 | 0.000232 | 76634.38 | 17.74614 | 54.11826 |
| 70 | 495591 | 838 | 0.17336 | 0.000293 | 68096.94 | 19.97113 | 36.37212 |
| 75 | 509070 | 389 | 0.254893 | 0.000195 | 56291.63 | 10.96989 | 16.40099 |
| 80 | 545968 | 151 | 0.418479 | 0.000115 | 41943.3 | 4.841125 | 5.431095 |
| 85+ | 468566 | 11 | 1 | 2.42E-05 | 24390.92 | 0.58997 | 0.58997 |
Table text extracted from the original PDF; superscript letters are shown inline. The original table image is below.
View original table image
| Age 𝒙 | 𝑴𝑫 All deaths Male 𝒏 𝒙 | 𝑴𝑫𝒊 Deaths from cause i 𝒏 𝒙 | 𝑴𝒒 𝒏 𝒙 | 𝑴𝒒𝒊 𝒏 𝒙 | 𝒍 𝒙 | 𝑴𝒅𝒊 𝒏 𝒙 | 𝒍𝒊 𝒙 |
|---|---|---|---|---|---|---|---|
| 0 | 369420 | 2316 | 0.029996 | 0.000188 | 100000 | 18.80666 | 171.229 |
| 1 | 53007 | 2187 | 0.00429 | 0.000177 | 97000.42 | 17.16643 | 152.4224 |
| 5 | 38868 | 2319 | 0.002956 | 0.000176 | 96584.32 | 17.03741 | 135.2559 |
| 10 | 37104 | 1533 | 0.002652 | 0.00011 | 96298.78 | 10.54903 | 118.2185 |
| 15 | 55519 | 429 | 0.003952 | 3.05E-05 | 96043.41 | 2.929563 | 107.6695 |
| 20 | 91282 | 593 | 0.006811 | 4.43E-05 | 95663.84 | 4.234382 | 104.7399 |
| 25 | 102893 | 625 | 0.008382 | 5.09E-05 | 95012.24 | 4.840114 | 100.5055 |
| 30 | 132556 | 551 | 0.011488 | 4.77E-05 | 94215.81 | 4.497962 | 95.66543 |
| 35 | 165777 | 690 | 0.015826 | 6.59E-05 | 93133.47 | 6.136125 | 91.16747 |
| 40 | 182082 | 609 | 0.020101 | 6.72E-05 | 91659.51 | 6.164014 | 85.03135 |
| 45 | 232839 | 654 | 0.029478 | 8.28E-05 | 89817.09 | 7.439738 | 78.86733 |
| 50 | 280272 | 688 | 0.042636 | 0.000105 | 87169.45 | 9.126521 | 71.42759 |
| 55 | 373143 | 941 | 0.06816 | 0.000172 | 83452.86 | 14.33774 | 62.30107 |
| 60 | 437850 | 874 | 0.094558 | 0.000189 | 77764.75 | 14.68436 | 47.96333 |
| 65 | 531526 | 635 | 0.13845 | 0.000165 | 70411.49 | 11.64734 | 33.27897 |
| 70 | 559990 | 645 | 0.202334 | 0.000233 | 60663 | 14.14637 | 21.63163 |
| 75 | 525595 | 160 | 0.292095 | 8.87E-05 | 48388.8 | 4.291123 | 7.48526 |
| 80 | 448450 | 77 | 0.439822 | 7.56E-05 | 34254.7 | 2.590706 | 3.194138 |
| 85+ | 384123 | 12 | 1 | 3.14E-05 | 19188.72 | 0.603432 | 0.603432 |
Table text extracted from the original PDF; superscript letters are shown inline. The original table image is below.
View original table image
From Table 4 of male and female population of India for the year 2019, we observe that number of deaths by the total cancer, an increase in male and female deaths during the agegroup 1-5 to 70-75. Then from age 75+ decline in deaths for both populations is observed. Table 5 gives mortality and survival pattern of male and female populations due to tuberculosis. We observe the number of infant's death for male and female is 1417 and 1655 respectively. The rise in numbers of male and female deaths is observed during the age-groups 15-55 and 15-70 for respective populations. Then decline in deaths for both populations is observed respectively from 60+ and 75+ ages. Table 9 shows proportion of decrement for non-senescent and senescent mortality of male and female population. Highest proportion of decrement is observed in age 80 whereas lowest is observed in infants for both populations. The lowest proportion of decrement is observed in infants of nonsenescent mortality. In case of senescent highest proportion is observed in age 55 for males and age 80 for females. Figure 1 gives the proportion of male and female population aged x die from various causes. We observe that newborns will eventually die from causes combined due to nonsenescent for males are more as compared to causes combined due to that for females. Figure 2 gives the proportion of male and female population aged 𝑥 die from various causes. Thus the proportion of male/female who survives to age 𝑥 will die from cause senescent for males are more as compared to cause senescent for females. From tables 1 to 6, we have the state of interest is being alive and decrements from that state are attributed to cause 𝑖 and all other causes of death. Figure 3 and Figure 4 gives change in the distribution of deaths in nonsenescent and senescent by age for male and female populations respectively. The deaths in senescent are more compared to non-senescent for both male and female populations. Figure 5 and Figure 6 give the non-senescent and senescent mortality for male and female population. In both cases senescent mortality is more compared to non-senescent mortality.
| Age 𝒙 | 𝑴𝑹𝒊 𝑵𝑺 𝒙 | 𝑴𝑹𝒊 𝑺 𝒙 | 𝑭𝑹𝒊 𝑵𝑺 𝒙 | 𝑭𝑹𝒊 𝑺 𝒙 |
|---|---|---|---|---|
| 0 | 0.008451 | 0.007698 | 0.009469 | 0.007273 |
| 1 | 0.050298 | 0.059311 | 0.049429 | 0.055256 |
| 5 | 0.069698 | 0.075587 | 0.057507 | 0.078066 |
| 10 | 0.051185 | 0.099595 | 0.0564 | 0.105623 |
| 15 | 0.025223 | 0.144834 | 0.031676 | 0.156238 |
| 20 | 0.025129 | 0.183593 | 0.03483 | 0.162326 |
| 25 | 0.03693 | 0.235396 | 0.051333 | 0.182682 |
| 30 | 0.046158 | 0.316611 | 0.069196 | 0.203065 |
| 35 | 0.05222 | 0.389014 | 0.074858 | 0.233601 |
| 40 | 0.05806 | 0.468576 | 0.073485 | 0.321776 |
| 45 | 0.065797 | 0.532116 | 0.079725 | 0.322551 |
| 50 | 0.085888 | 0.586701 | 0.088257 | 0.450292 |
| 55 | 0.103944 | 0.602309 | 0.103423 | 0.39223 |
| 60 | 0.137152 | 0.583255 | 0.129963 | 0.430283 |
| 65 | 0.165493 | 0.55116 | 0.148175 | 0.421326 |
| 70 | 0.193151 | 0.512705 | 0.180015 | 0.413739 |
| 75 | 0.20628 | 0.48087 | 0.184108 | 0.432718 |
| 80 | 0.221848 | 0.438497 | 0.214117 | 0.472692 |
| 85+ | 0.188519 | 0.414662 | 0.181115 | 0.446096 |
Table text extracted from the original PDF; superscript letters are shown inline. The original table image is below.
View original table image
| Age 𝒙 | 𝑴𝑫𝒊 Deaths from cause i 𝒏 𝒙 | 𝑴𝒒𝒊 𝒏 𝒙 | 𝑴𝒅𝒊 𝒏 𝒙 | 𝒍𝒊 𝒙 | 𝑭𝑫𝒊 Deaths from cause i 𝒏 𝒙 | 𝑭𝒒𝒊 𝒏 𝒙 | 𝑭𝒅𝒊 𝒏 𝒙 | 𝒍𝒊 𝒙 |
|---|---|---|---|---|---|---|---|---|
| 0 | 1417 | 0.000115 | 11.50549 | 4742.828 | 1655 | 0.000148 | 14.75584 | 2858.629 |
| 1 | 976 | 7.9E-05 | 7.660748 | 4731.322 | 985 | 8.75E-05 | 8.4741 | 2843.873 |
| 5 | 512 | 3.89E-05 | 3.760494 | 4723.662 | 750 | 6.24E-05 | 6.011939 | 2835.399 |
| 10 | 801 | 5.72E-05 | 5.513015 | 4719.901 | 905 | 7.1E-05 | 6.815374 | 2829.387 |
| 15 | 2143 | 0.000153 | 14.64995 | 4714.388 | 2351 | 0.000183 | 17.4798 | 2822.572 |
| 20 | 4793 | 0.000358 | 34.21697 | 4699.738 | 4025 | 0.00032 | 30.50017 | 2805.092 |
| 25 | 7943 | 0.000647 | 61.48495 | 4665.521 | 5148 | 0.000442 | 41.89969 | 2774.592 |
| 30 | 12383 | 0.001073 | 101.1076 | 4604.036 | 6645 | 0.00061 | 57.41901 | 2732.692 |
| 35 | 16998 | 0.001623 | 151.1329 | 4502.929 | 7652 | 0.000768 | 71.75763 | 2675.273 |
| 40 | 18951 | 0.002092 | 191.7545 | 4351.796 | 8918 | 0.001041 | 96.35297 | 2603.515 |
| 45 | 22905 | 0.0029 | 260.4572 | 4160.041 | 8196 | 0.001097 | 100.2456 | 2507.162 |
| 50 | 24464 | 0.003722 | 324.4084 | 3899.584 | 13457 | 0.002106 | 189.0315 | 2406.917 |
| 55 | 29223 | 0.005338 | 445.4628 | 3575.176 | 13293 | 0.002436 | 211.2384 | 2217.885 |
| 60 | 28750 | 0.006209 | 482.8278 | 3129.713 | 13488 | 0.00285 | 235.7396 | 2006.647 |
| 65 | 28612 | 0.007453 | 524.7655 | 2646.885 | 14523 | 0.003674 | 281.5515 | 1770.907 |
| 70 | 26601 | 0.009611 | 583.0518 | 2122.12 | 14893 | 0.005209 | 354.751 | 1489.356 |
| 75 | 20358 | 0.011314 | 547.4625 | 1539.068 | 13466 | 0.006742 | 379.5327 | 1134.605 |
| 80 | 15943 | 0.015636 | 535.6071 | 991.6053 | 12757 | 0.009778 | 410.1319 | 755.0721 |
| 85+ | 9128 | 0.023764 | 455.9982 | 455.9982 | 6627 | 0.014142 | 344.9402 | 344.9402 |
Table text extracted from the original PDF; superscript letters are shown inline. The original table image is below.
View original table image
| Age 𝒙 | 𝑴𝑫𝒊 Deaths from cause i 𝒏 𝒙 | 𝑴𝒒𝒊 𝒏 𝒙 | 𝑴𝒅𝒊 𝒏 𝒙 | 𝒍𝒊 𝒙 | 𝑭𝑫𝒊 Deaths from cause i 𝒏 𝒙 | 𝑭𝒒𝒊 𝒏 𝒙 | 𝑭𝒅𝒊 𝒏 𝒙 | 𝒍𝒊 𝒙 |
|---|---|---|---|---|---|---|---|---|
| 0 | 922 | 7.48E-05 | 7.484998 | 9332.202 | 601 | 5.35789E-05 | 5.357892 | 9315.833 |
| 1 | 1804 | 0.000146 | 14.16269 | 9324.717 | 1536 | 0.000136461 | 13.20999 | 9310.475 |
| 5 | 2099 | 0.00016 | 15.42085 | 9310.555 | 1739 | 0.000144817 | 13.94475 | 9297.265 |
| 10 | 2182 | 0.000156 | 15.01893 | 9295.134 | 1999 | 0.000156861 | 15.05545 | 9283.32 |
| 15 | 2729 | 0.000194 | 18.65988 | 9280.115 | 2815 | 0.000218638 | 20.92785 | 9268.265 |
| 20 | 4341 | 0.000324 | 30.98738 | 9261.455 | 4748 | 0.000377573 | 35.98032 | 9247.337 |
| 25 | 5104 | 0.000416 | 39.50658 | 9230.468 | 6122 | 0.000526101 | 49.82694 | 9211.357 |
| 30 | 7747 | 0.000671 | 63.25303 | 9190.961 | 9170 | 0.000842036 | 79.23513 | 9161.53 |
| 35 | 12146 | 0.00116 | 107.9951 | 9127.708 | 14947 | 0.001500418 | 140.1583 | 9082.295 |
| 40 | 17578 | 0.00194 | 177.8613 | 9019.713 | 23147 | 0.002702269 | 250.1036 | 8942.136 |
| 45 | 27104 | 0.003431 | 308.2003 | 8841.852 | 30231 | 0.004047551 | 369.7513 | 8692.033 |
| 50 | 36744 | 0.00559 | 487.2468 | 8533.651 | 46962 | 0.007350308 | 659.6724 | 8322.281 |
| 55 | 50546 | 0.009233 | 770.5067 | 8046.405 | 48965 | 0.008972639 | 778.1025 | 7662.609 |
| 60 | 59230 | 0.012791 | 994.7175 | 7275.898 | 55225 | 0.011666892 | 965.1955 | 6884.507 |
| 65 | 66911 | 0.017429 | 1227.184 | 6281.18 | 57542 | 0.014556864 | 1115.556 | 5919.311 |
| 70 | 62496 | 0.022581 | 1369.83 | 5053.997 | 54026 | 0.01889847 | 1286.928 | 4803.755 |
| 75 | 51211 | 0.02846 | 1377.144 | 3684.166 | 44239 | 0.02215065 | 1246.896 | 3516.827 |
| 80 | 35002 | 0.034329 | 1175.912 | 2307.022 | 35033 | 0.026852324 | 1126.275 | 2269.931 |
| 85+ | 22643 | 0.058947 | 1131.11 | 1131.11 | 21970 | 0.046888584 | 1143.656 | 1143.656 |
Table text extracted from the original PDF; superscript letters are shown inline. The original table image is below.
View original table image
Conclusion
The cause-specific deaths are determined and are used for the analysis of senescent and non-senescent mortality. The senescent mortality highly observed in the age 65 and 70, least for infants for male and female population. In case of non-senescent mortality, deaths are more in the age 75 and 80, least is noticed in the age 15 for both populations. We observe change in the distribution of deaths in non-senescent and senescent by age and the proportion of deaths in senescent is more as compared to that of non-senescent for male and female populations of India.
References
8 in the original paper- Abrams PA. Does increased mortality favor the evolution of more rapid senescence? Evolution. 1993;877-87.
- Carnes BA, Holden LR, Olshansky SJ, et al. Mortality partitions and their relevance to research on senescence. Biogerontology. 2006;7:183-198.
- Finch CE. Longevity, Senescence, and the Genome. University of Chicago Press. 1994.
- Le Brasseur NK, Tchkonia T, Kirkland JL. Cellular senescence and the biology of aging, disease, and frailty. Nestle Nutr. Inst. Workshop Ser. 2015;83:11-8. doi: 10.1159/000382054. Epub 2015 Oct 20. PMID: 26485647; PMCID: PMC4780350.
- Macieira-Coelho A. Control of cell replication during aging. Interdiscip Top Gerontol. 2014;39:24-44. Doi:10.1159/000358898. Epub 2014 May 13. PMID: 24862013.
- Makeham WM. On the law of mortality. Journal of the Institute of Actuaries (1866-1867). 1867;13(6):325-358. http://www.jstor.org/stable/41134517.
- Rangoli AM, Talawar AS. A demographic approach to competing risks analysis. Int. J Stat. Appl. Math. 2023;8(6):41-52. DOI: 10.22271/maths.2023.v8.i6a.1401.
- Williams PD, Day T, Fletcher Q, Rowe L. The shaping of senescence in the wild. Trends in Ecology and Evolution. 2006;21(8):458-63.