
Research article · 2023 · Full text
International Journal of Statistics and Applied MathematicsAnalyses of factors affecting the adoption of major Agro-forestry systems in the high altitude zone of Andhra Pradesh
Volume 8(6S) · Pages 580–583 · DOI: 10.22271/maths.2023.v8.i6sh.1433 ↗
Research areasAgricultural Economics and PracticesSustainable Agricultural Systems AnalysisAgroforestry and silvopastoral systems
Abstract
Author-writtenThe research study was conducted to analyse the factors affecting the adoption of major agro forestry systems in the high altitude zone of Andhra Pradesh. The high altitude zone of Andhra Pradesh is having the major agro forestry systems viz., cashew + pulses, mango + turmeric, sliver oak + pepper + coffee, eucalyptus, jafra, rubber systems spread over in an area of 12,28,504 ha in the state. Besides analyzing the interrelationships among the factors, the factor affecting the adoption of agro forestry systems were also identified. A total sample of 335 farmers from different districts in high altitude zone of Andhra Pradesh were selected to analyze the identified factors affecting the adoption of six major agro forestry systems. The data pertains to the years 2020-2022. Kaiser-Meyer-Olkin (KMO) of >0.5 was computed to test the sampling adequacy. Bartlett’s Test of Sphericity (Significant at 0.001) was conducted to test whether the correlation between the variables was sufficiently large for factor analysis and correlation matrix was computed to confirm the inter-item correlation. The principal component factor analysis was used for the factor extraction and varimax rotation technique was used for factor rotation. The results showed that six factors with eigen values greater than 1 were successfully constructed. The six factors accounted for 60.28% of the total variance in the dataset and were assigned as the factors influencing the agro forestry systems in Andhra Pradesh. The communalities results ranging from 0.47 to 0.72 depicted that the 6 factor model was adequate.
Summary
Source-checkedPlain-language reading of the full paper, prepared with AI and checked against the text. Each point links to the authors' own words.
Why it matters
- Agroforestry, the integration of trees into agricultural systems, is considered the most effective method for preserving tree benefits despite the ongoing clearance of natural vegetation for development. View evidence ↗
- The high altitude zone of Andhra Pradesh, covering five districts, contains approximately 44,849 sq. km of forest, which is 27.52% of the state's total forest area. View evidence ↗
- Farmers in this high altitude region face difficulties growing annual crops because groundwater levels are decreasing. View evidence ↗
The question
- The study aimed to identify the primary factors influencing the adoption of major agroforestry systems in the high altitude zone of Andhra Pradesh and analyze the interrelationships between these factors. View evidence ↗
What they did
- The researchers surveyed a total of 335 farmers from various districts within the high altitude zone to analyze factors affecting six major agroforestry systems. View evidence ↗
- The study analyzed 14 variables, including socio-economic factors (age, gender, income, education), resource access (credit, land size, extension services), and perceived benefits (cost, labor, future generations). View evidence ↗
- Principal Component Analysis (PCA) was employed for factor extraction, and the varimax rotation technique was used to rotate the factors. View evidence ↗
What they found
- The Kaiser-Meyer-Olkin (KMO) measure was 0.534, indicating that the sampling adequacy was barely acceptable. View evidence ↗
- Six factors with eigenvalues greater than 1 were identified, which collectively explained 60.28% of the total variance in the dataset. View evidence ↗
- The highest variance was explained by the lower cost of establishment and maintenance (73.6%) and farming experience (72.9%). View evidence ↗
- Age and farming experience were positively significant, while education level was negatively significant, suggesting that older, more experienced farmers with less formal education are more likely to adopt these systems. View evidence ↗
- Farmers experiencing labor scarcity are less likely to adopt agroforestry systems, likely due to the labor-intensive nature of the practices. View evidence ↗
- A desire to provide sustainable resources for future generations is a key driver for farmers to adopt agroforestry. View evidence ↗
What it means
- The authors conclude that the primary barriers to agroforestry adoption are a lack of credit facilities, insufficient extension services, and difficulty adapting to new technologies. View evidence ↗
- The authors recommend that government provision of subsidies, credit facilities, and extension services would increase agroforestry productivity and benefit farmers in the high altitude zone. View evidence ↗
Visual summary
2 visualsIllustrations explain the paper; charts are replotted from the paper's own table values.
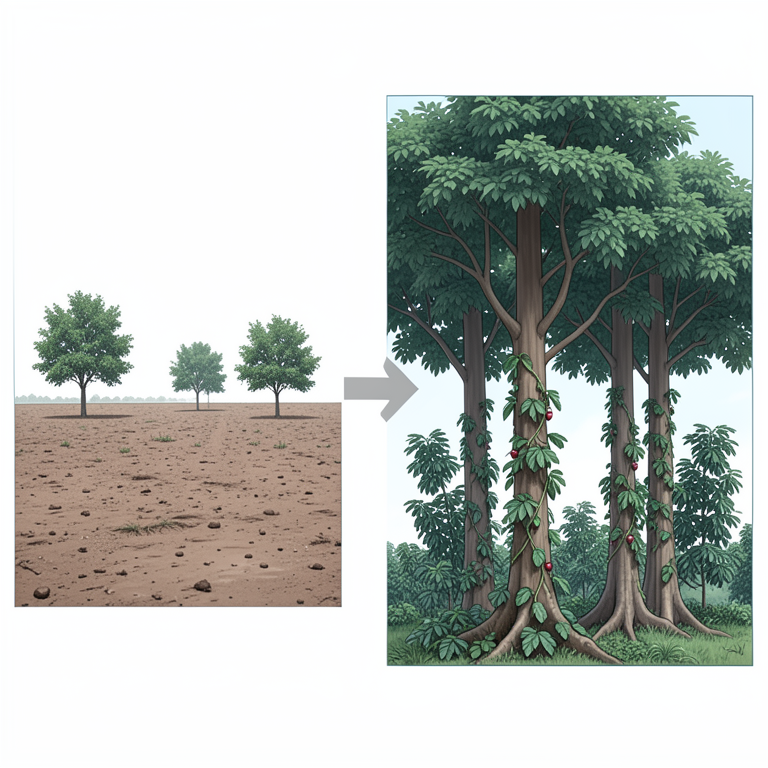
Drivers of Agroforestry Adoption
AI-generated conceptual illustration (Agroforestry systems in high altitude Andhra Pradesh (intercropped coffee and pepper vines on shade trees)). It explains the idea and does not show study data.
View source evidence ↗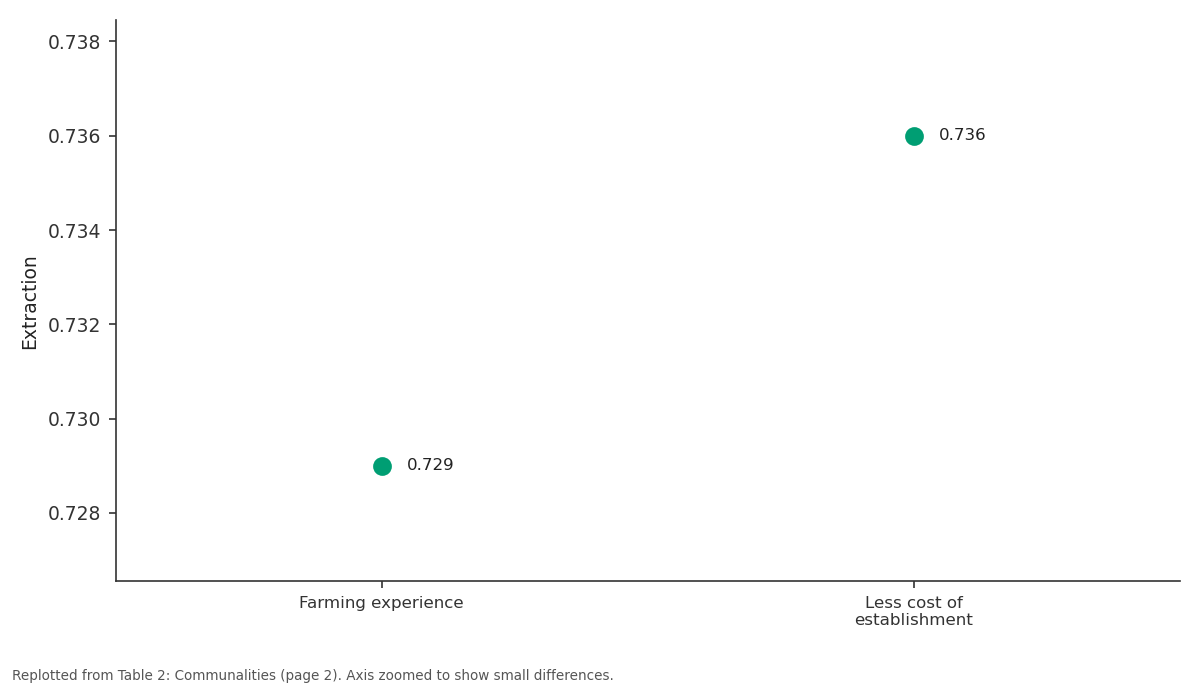
Extraction: Farming experience vs Less cost of...
Replotted from Table 2 (page 2) of the original paper. Every bar is the paper's own table value.
View source evidence ↗Figures & tables
From the original paper Table 1
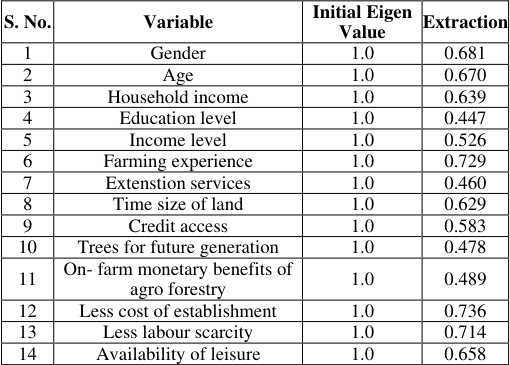 Table 2
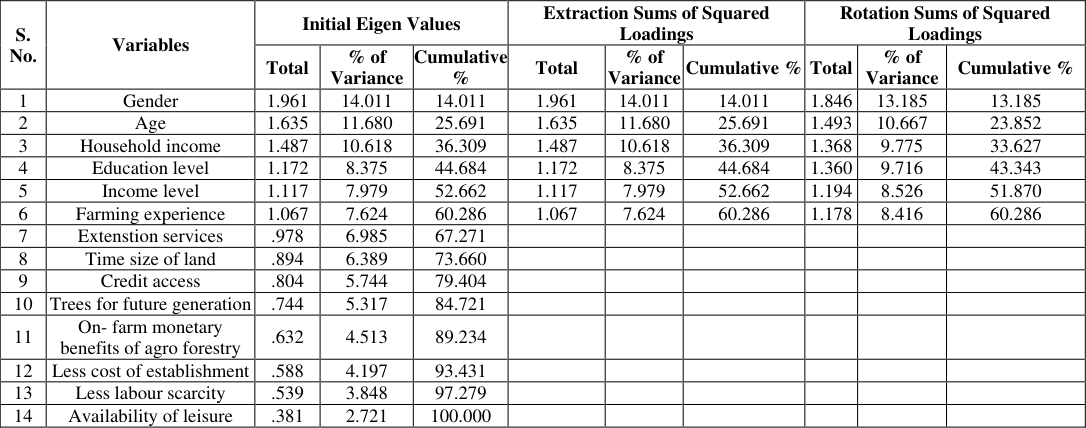 Table 3
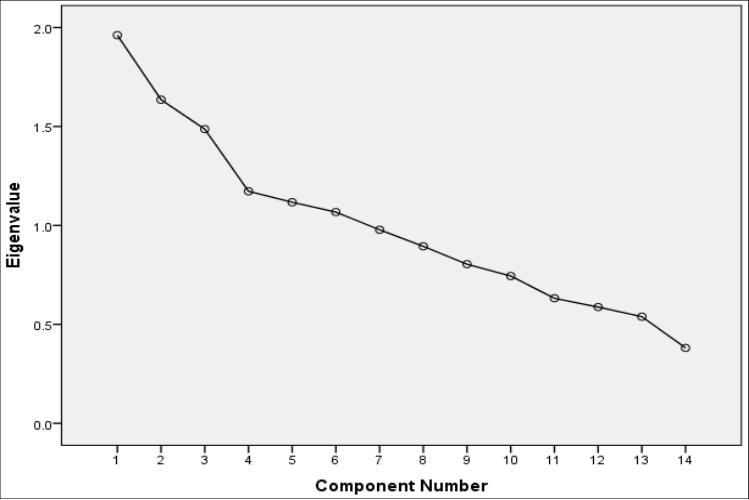 Figure 1
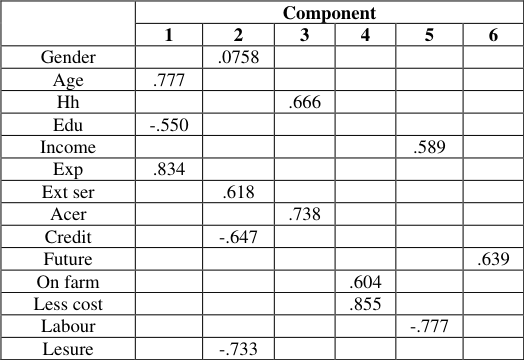 Table 4
Introduction
Forests provide numerous tangible and intangible economic benefits. The tangible benefits of timber and non-timber forest products, as well as the intangible benefits of carbon sequestration, providing recreation facilities, preserving native forests and wildlife, contributing to biodiversity, and improving air, soil, and water quality, are all aimed at meeting the economic, environmental, and social needs of the people on their private lands (Sangeetha and Shanmugam 2016) [9] . Integrating trees into agricultural systems, also known as agroforestry, is the most effective way to maintain the benefits that trees provide in the face of the ongoing clearance of natural vegetation for agricultural and other types of development. The field of agroforestry focuses on the diverse array of trees that can be grown on farms and in other rural areas. According to the report by the Forest Survey of India 2019, the total forest cover in India is 6,97,898 sq. km, which accounts for 21.23 per cent of its geographical area. The estimated forest area in Andhra Pradesh is 1,62,968 sq.km constituting 17.88 per cent of the geographical area of the state (ISFR, 2019) [15] . The high altitude zone of Andhra Pradesh comprising parts of East Godavari, West Godavari, Visakhapatnam, Vizianagaram and Srikakulam districts has an estimated forest area of 44,849 sq. km., constituting 27.52 per cent of the total forest area of the Andhra Pradesh state. Farmers in the high altitude zone are finding it difficult to cultivate annual crops due to dwindling ground water levels.
They believe that tree farming generates a higher income than annual crops grown under stress. Moreover, to industrialization, there has been an acute labour shortage for agriculture in the zone in recent years. The state government is making efforts in promoting social forestry and agroforestry to improve the environment. Most of the farmers were unaware that they are actually practicing Agroforestry system. This scenario happens because most of the communities in the rural areas were having unfavorable attitudes, less knowledge, and financial issues towards the agroforestry practice (Farooq et al., 2018) [3] . Education level is key-driven among rural communities in ensuring successful adoption of agroforestry practices (Tian and Shi, 2017; Musa et al., 2019) [12,8] , besides the communities support assisted by the government and local authorities (Islam et al., 2015) [5] . Hence the present study on analysis of factors affecting the adoption of major agro forestry systems in high altitude zone of Andhra Pradesh has been taken up with the objectives of analyzing the major factors affecting the adoption of major agro forestry systems, and the inter relationship among the factors identified affecting the adoption of agro forestry systems.
Methodology Selection of Study area
Multistage random sampling procedure was followed for selection of sample. Firstly, Andhra Pradesh state was purposively selected. Consequently out of six agro-climatic zones of Andhra Pradesh, the high altitude zone, which is constituted by parts of five districts viz., East Godavari, West Godavari, Visakhapatnam, Vizianagaram, and Srikakulam was selected in view of the availability of major agro forestry systems in the zone. From each selected district, the top two mandals with the highest forest area, totalling to ten mandals and from each selected mandal, two villages with the highest area under forest cover, thus constituting twenty villages were selected for the study. A total of 335 respondents practicing at least one agro forestry system in the zone were surveyed, whose selection is subject to the proportionate number of total agro forestry farmers in each village.
Data analysis
A total of 14 major variables viz., gender, age, household income, educational level, income level, farming level, extension services, size of land, credit access, trees for future generation, on-farm monetary benefits of agro forestry, less cost of establishment, less labour scarcity and availability of leisure were considered for adoption of agro forestry systems. The factor analysis was used as a technique in items statement analysis for adoption factors towards the contribution of agroforestry practices and Principal Component Analysis (PCA) was used as a factor extraction method (Luumi et al., 2016) [7] . It can identify the eigen vectors that contributed most of the underlying factors on the eight itemized statement in this study. Principal Components Analysis (PCA) used as a factor extraction method in factor analysis. The eigen value of the extracted factors was determined for the selection of the items/variables. The determination of the score for the adoption factors/latent variables was based on the relative factor loading of the items when items were falling under the factor with the highest eigen value, which is usually more than 1.0. The KMO (Kaiser-Meyer-Olkin) measure is used to determine if the responses given in a sample are adequate for factor analysis. A value close to 0.5 is considered satisfactory for factor analysis to proceed. Kaiser et al. (1974) [6] suggested a minimum value of 0.5 as acceptable, with values between 0.7 and 0.8 being barely acceptable, and values above 0.9 considered excellent. (Luumi et al., 2016) [7] . A value greater than 0.5 for factor loading of the statement was assumed to be a significant factor in the determination and selection of index variables (Shear et al., 2011) [10] . Bartlett's test is another indication of the strength of the relationship among variables. The Bartlett's Test of Sphericity value less than 0.05 and a p-value of 0.00, suggest a significant relationship among the variables (Tobias and Carlson, 1969) [13] . The Scree test and the latent root criterion were effective methods for determining the number of factors (Stewart, 1981) [11] . The analysis was carried using IBM SPSS statistics software version 25.
Results and Discussions Sampling adequacy
As observed from Table 1, the KMO measure was greater than 0.5 inferring that the sampling adequacy barely accepted and the responses given with the sample were minimum. The results were correlated with Vivek Mahajan and Pravin Cavan, 2019 [14] . The results of Bartlett's Test of Sphericity in Table 1 indicate that the values were significant for all agroforestry systems, with a p-value of 0.00, suggesting a significant relationship among the variables.
| Kaiser-Meyer-Olkin Measure of Sampling Adequacy | — | 0.534 |
|---|---|---|
| Bartlett's Test of Sphericity | Approx. Chi-Square | 427.236 |
| Df | 91 | |
| Sig. | 0.000 |
Table text extracted from the original PDF; superscript letters are shown inline. The original table image is below.
View original table image
Communalities
The Table 2 of communalities shows how much of the variance in the variables has been accounted for extracted factors (i.e., the communality value should be greater than 0.5 to be considered for further analysis; otherwise, these variables should be removed from further steps of factor analysis). The major variance was accounted for less cost of establishment and maintenance of agro forestry of the farmer with 73.6%, while 72.9 % of the variance was accounted on farming experience. Less labour scarcity was accounted for 71.4% variance, followed by socio-economic profiles like gender (68.1%), age (67.0%), availability of leisure (65.8%), household income (63.9%) and time size of land (62.9%) respectively. The least variance was on educational level with 44.7% influence on agro forestry systems. The initial eigen values and extracted sums of squared loadings were considered for analysis and interpretation and are depicted in Table 3. It is revealed from Table 3 that 1.961, 1.635, 1.458, 1.172, 1.117 and 1.067 were the total initial eigen values for the six components representing the set of 14 variables with 335 observations. Further, the per cent of variance extracted sum of squared loadings showed that the first factor accounted for 14.001% of the variance features from the stated observations, the second factor for 11.680%, the third factor for 10.618%, the 4 th factor contributed with 8.375 %, the fifth factor accounted for 7.979 % and the sixth factor contributed 7.624% (Table 3). Hence, the top 6 components account for 60.286% contribution towards adoption of agro forestry systems. The results are in correlation with that of Martin Ez et al. 2021 [2] . The factors where in all collectively accounted for an impressive 71.63% of the total variance in the dataset, signifying their importance in explaining the underlying trends in sustainable development within Southern Nigeria.
| S. No. | Variables | Initial Eigen Values | — | — | Extraction Sums of Squared Loadings | — | — | Rotation Sums of Squared Loadings | — | — |
|---|---|---|---|---|---|---|---|---|---|---|
| Total | % of Variance | Cumulative % | Total | % of Variance | Cumulative % | Total | % of Variance | Cumulative % | ||
| 1 | Gender | 1.961 | 14.011 | 14.011 | 1.961 | 14.011 | 14.011 | 1.846 | 13.185 | 13.185 |
| 2 | Age | 1.635 | 11.680 | 25.691 | 1.635 | 11.680 | 25.691 | 1.493 | 10.667 | 23.852 |
| 3 | Household income | 1.487 | 10.618 | 36.309 | 1.487 | 10.618 | 36.309 | 1.368 | 9.775 | 33.627 |
| 4 | Education level | 1.172 | 8.375 | 44.684 | 1.172 | 8.375 | 44.684 | 1.360 | 9.716 | 43.343 |
| 5 | Income level | 1.117 | 7.979 | 52.662 | 1.117 | 7.979 | 52.662 | 1.194 | 8.526 | 51.870 |
| 6 | Farming experience | 1.067 | 7.624 | 60.286 | 1.067 | 7.624 | 60.286 | 1.178 | 8.416 | 60.286 |
| 7 | Extenstion services | .978 | 6.985 | 67.271 | ||||||
| 8 | Time size of land | .894 | 6.389 | 73.660 | ||||||
| 9 | Credit access | .804 | 5.744 | 79.404 | ||||||
| 10 | Trees for future generation | .744 | 5.317 | 84.721 | ||||||
| 11 | On- farm monetary benefits of agro forestry | .632 | 4.513 | 89.234 | ||||||
| 12 | Less cost of establishment | .588 | 4.197 | 93.431 | ||||||
| 13 | Less labour scarcity | .539 | 3.848 | 97.279 | ||||||
| 14 | Availability of leisure | .381 | 2.721 | 100.000 |
Table text extracted from the original PDF; superscript letters are shown inline. The original table image is below.
View original table image
| S. No. | Variable | Initial Eigen Value | Extraction |
|---|---|---|---|
| 1 | Gender | 1.0 | 0.681 |
| 2 | Age | 1.0 | 0.670 |
| 3 | Household income | 1.0 | 0.639 |
| 4 | Education level | 1.0 | 0.447 |
| 5 | Income level | 1.0 | 0.526 |
| 6 | Farming experience | 1.0 | 0.729 |
| 7 | Extenstion services | 1.0 | 0.460 |
| 8 | Time size of land | 1.0 | 0.629 |
| 9 | Credit access | 1.0 | 0.583 |
| 10 | Trees for future generation | 1.0 | 0.478 |
| 11 | On- farm monetary benefits of agro forestry | 1.0 | 0.489 |
| 12 | Less cost of establishment | 1.0 | 0.736 |
| 13 | Less labour scarcity | 1.0 | 0.714 |
| 14 | Availability of leisure | 1.0 | 0.658 |
Table text extracted from the original PDF; superscript letters are shown inline. The original table image is below.
View original table image
Scree plot
The scree plot is a graph of the eigen values against all the factors as proposed by Cattell (1966) [1] . The graph can be used to determine how many factors to be considered for the study. The point of interest is the point at which the curve begins to flatten as can be seen in scree plot (Fig 1). The curve begins to flatten between factors 4 and 5 and from factor 7 onwards, the eigen value was less than one, resulting in the retention of only six factors.
Rotated component matrix
The idea of rotation is to reduce the number of six factors on which the variables under investigation have high loadings. Rotation does not actually change anything but makes the interpretation of the analysis easier. From Table 4, it is observed that age (.777) and farming experience (0.834) were positively significant, while educational level (-.550) was negatively significant and were substantially loaded on Factor 1. Similarly, gender (0.758) and extension service (0.618) were positively significant and credit access (-.647) and availability of leisure time (-.733) were negative and significantly loaded on Factor 2. The household size of the farmer (.666) and, size of land (.738) were positively loaded on factor 3. The lesser cost of establishment and maintenance of agro forestry (.855) & on-farm monetary benefits of agro forestry (.604) were loaded positively significant on factor 4, while the income level (.589) was loaded positively and labour scarcity (-.777) was loaded negatively significant on Factor 5. The trees for future generation (.639) was loaded positively significant on Factor 6. Experienced farmers are more inclined to adopt the system. Their expertise might enable them to effectively manage the challenges and requirements of the agro forestry system. The farmers with more available time can manage the additional tasks and complexities associated with this system alongside their regular farming activities. The farmers facing labour scarcity are less likely to adopt the agro forestry systems. The system might require more labor-intensive practices, and farmers with limited labor resources might find it challenging to manage. Education can enhance the understanding of innovative farming practices and their potential benefits. Most of the farmers prioritize long-term benefits, such as leaving a sustainable resource for future generations, and are more inclined to adopt the system. This could be driven by environmental consciousness and a desire for intergenerational sustainability. Age and farming experience showed positive significance and education level had a negative significant loading. This suggests that more experienced and elderly farmers with lower education levels are likely to be associated with this agroforestry system. One possible reason for this pattern could be that these farmers possess traditional knowledge and skills that are well-suited to managing the complex interactions among the different components of the system.
Conclusion
The factors affecting the adoption of major agro forestry systems in the high altitude zone of Andhra Pradesh were explored using principal component factor analysis. In the analysis, the results showed that six new factors were successfully constructed and assigned as the common factors that influence the adoption of major agro forestry systems in the high altitude zone of Andhra Pradesh. The six new factors, showed how the 14 considered, factors related to each other, influence the agro forestry systems. The total six principal components (PCs) contributed 60.28% variability for adoption of forestry systems. It is concluded that the age, farming experience, gender, extension service, household size of the farmer, size of land, less cost of establishment and maintenance of agro forestry, on-farm monetary benefits of agro forestry, income level, trees for future generations were positively significant, while educational level, credit access, labour scarcity and availability of leisure time were negatively significant loading factors influencing the newly constructed six factors.
The main constraints for forestry farmers are lack of credit facilities, extension services, and the failure to adapt to new technology, all of which have a negative impact on agroforestry farming. If the government provides credit facilities, subsidies, and potential extension services to farmers, the productivity of agroforestry will increase, benefiting farmers in the HA zone of Andhra Pradesh.
References
10 in the original paper- Cattell RB. The Scree Test for the number of factors. Mul. Behav. Res. 1966;1:245-276.
- Eze NM, Asogwa OC, Eze CM. Principal component factor analysis of some development factors in Southern Nigeria and its extension to regression analysis. Journal of Advances in Mathematics and Computer Science. 2021;36(3):132-160.
- Islam R, Walkerden G. How bonding and bridging networks contribute to disaster resilience and recovery on the Bangladeshi coast. International journal of disaster risk reduction. 2014;10:281-291.
- Kaiser HF, Rice J, Mark LJ. Educational and Phychological Measu. 1974;34(Spring):111-117.
- Musa F, Lile NA, Hamdan DDM. Agroforestry Practices Contribution Towards Socioeconomics: A Case Study of Tawau Communities in Malaysia. Agriculture and Forestry. 2019;65(1):65-72.
- Sangeetha R, Shanmugam TR. Factors affecting adoption rate of agro forestry technologies in Tamil Nadu. Agricultural Economics Research Review. 2016;29(2):307-312.
- Shear MK, Simon N, Wall M, Zisook S, Neimeyer R, Duan N, et al. Complicated grief and related bereavement issues for DSM-5. Depression and Anxiety. 2011;28:103117.
- Stewart DW. The application and misapplication of factor analysis in marketing research. Journal of Marketing Res. 1981;18:51-62.
- Tian J, Shi C. Allocation efficiency of forestry producing factors in different forest land scale farmer and its influencing factors. Issues of Forestry Economics. 2017;37(5):73-78.
- Tobias S, Carlson JE. Brief report: Bartlett's test of sphericity and chance findings in factor analysis. Muti. Behavioral Rea. 1969;4:375-377.