
Research article · 2023 · Full text
International Journal of Geography Geology and EnvironmentNovel criteria and methods for sustainable marine ecologic management
Volume 5(2) · Pages 151–162 · DOI: 10.22271/27067483.2023.v5.i2b.184 ↗
Research areasCoastal and Marine ManagementArctic and Russian Policy StudiesMaritime Navigation and Safety
Abstract
Author-writtenThis study develops an integrated methodology to evaluate and prioritize suitable sites for many human activities associated with sustainable marine development, such as wind farms, fish farms, and marine nature reserves. The methodological framework includes identifying proposed locations for ship trajectory, laying oil pipelines, oil platforms, and all those affecting these locations, including river plumes and sub-marine springs, using geographic information systems (GIS), remote sensing, and multi-natural-criteria methods. Therefore, maps were produced and then re-classified into three categories: low, moderate, and extreme ability training. The results provide a decision-making process regarding offshore wind farming, fish farming, and the establishment of marine reserves. The outputs of this work contribute to ensuring the sustainable spatial development of the marine ecosystem through renewable energy resources and nutrition solutions.
Summary
Source-checkedPlain-language reading of the full paper, prepared with AI and checked against the text. Each point links to the authors' own words.
Why it matters
- Global electricity and food resources are nearing exhaustion, driving interest in the 'blue economy' to find new resources in oceans and seas. View evidence ↗
- Effective deployment of offshore wind and fish farms requires careful planning to identify the most suitable locations. View evidence ↗
- Fish farming is considered the only viable way to meet fish demand because wild fish populations have limits that prevent large-scale increases in catches. View evidence ↗
The question
- The study aims to develop an integrated methodology to evaluate and prioritize suitable sites for sustainable marine activities, including wind farms, fish farms, and nature reserves. View evidence ↗
What they did
- The methodology uses a GIS spatial database incorporating factors such as wind speed, bathymetry, submarine springs, watershed, and Digital Elevation Models (DEM). View evidence ↗
What they found
- The methodology identified 273.1614 square kilometers of suitable area for wind farms. View evidence ↗
- The study identified 110.4131 square kilometers suitable for large-size fish farms. View evidence ↗
- The study identified 3.6404 square kilometers suitable for small-size fish farms. View evidence ↗
- The analysis identified 14 submarine springs in the study area that required consideration for site selection. View evidence ↗
- The Litani River was found to have a plume extending 15 km into the sea, which can negatively affect the establishment of fish farms. View evidence ↗
- Potential oil and gas platform sites were determined to be at depths between 1400 and 2000 meters. View evidence ↗
What it means
- The authors conclude that combining GIS and remote sensing enhances the ability to maintain a sustainable marine ecosystem when managing areas where human activities and natural habitats overlap. View evidence ↗
- The authors state that these new criteria and methods provide decision-makers with the tools to achieve sustainable and clean marine development. View evidence ↗
Visual summary
1 visualsIllustrations explain the paper; they do not show study data.
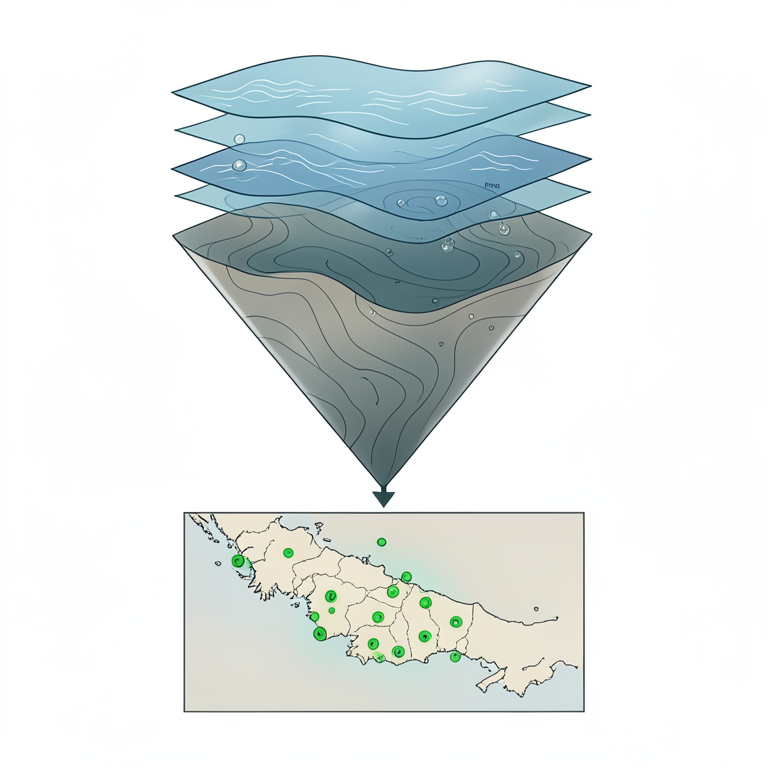
GIS Site Selection Process
AI-generated conceptual illustration (Marine spatial maps of a coastal ocean region). It explains the idea and does not show study data.
View source evidence ↗Figures & tables
From the original paper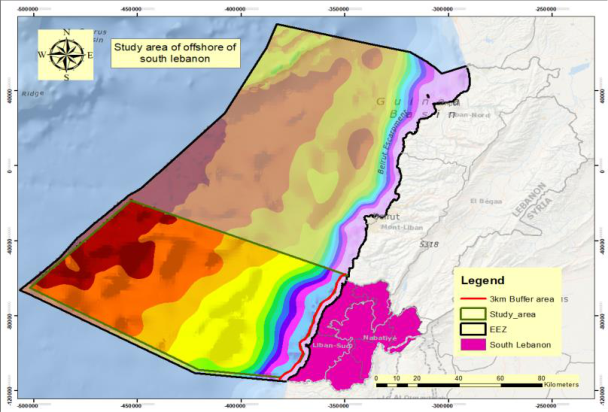 Figure 1Page 2
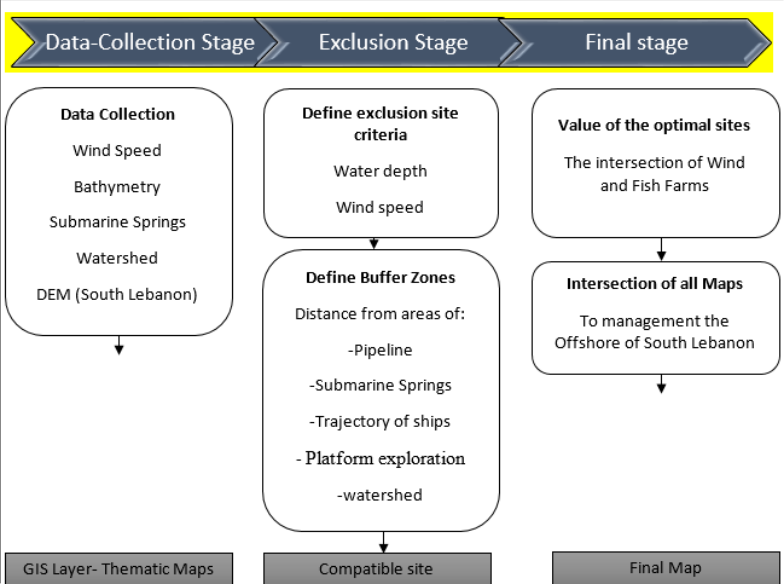 Figure 2Page 3
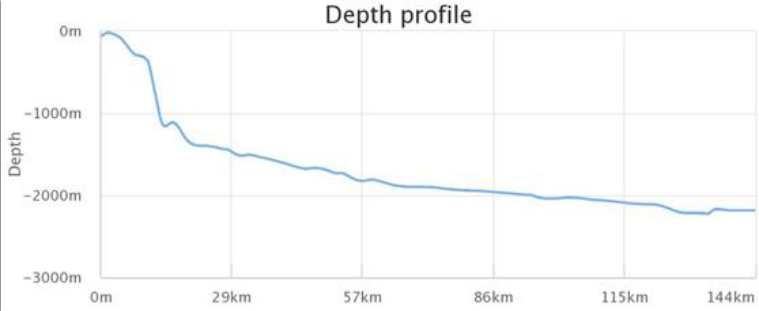 Figure 3Page 4
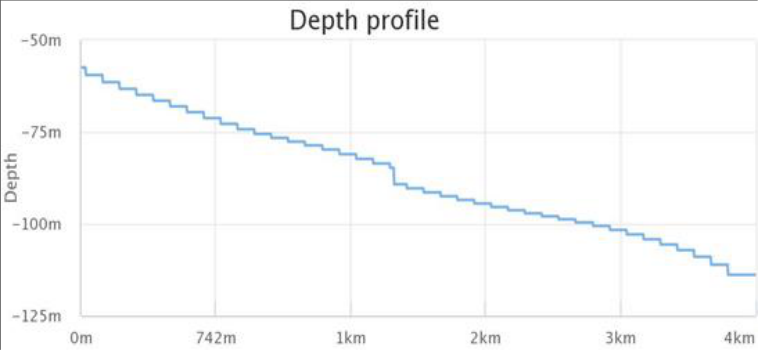 Figure 4Page 4
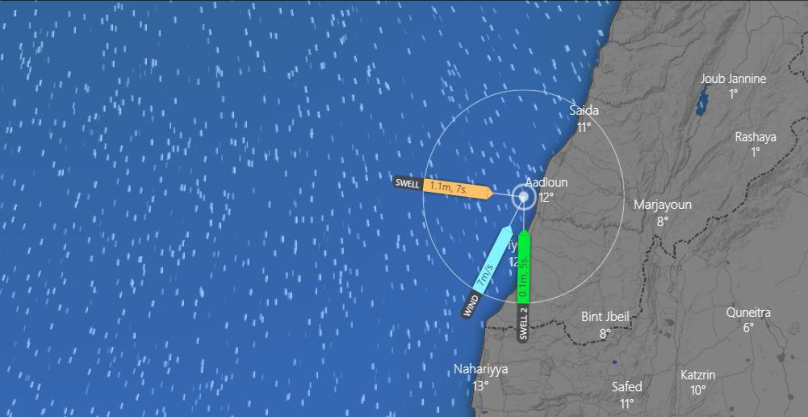 Figure 5Page 4
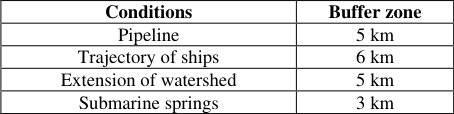 Table 1Page 5
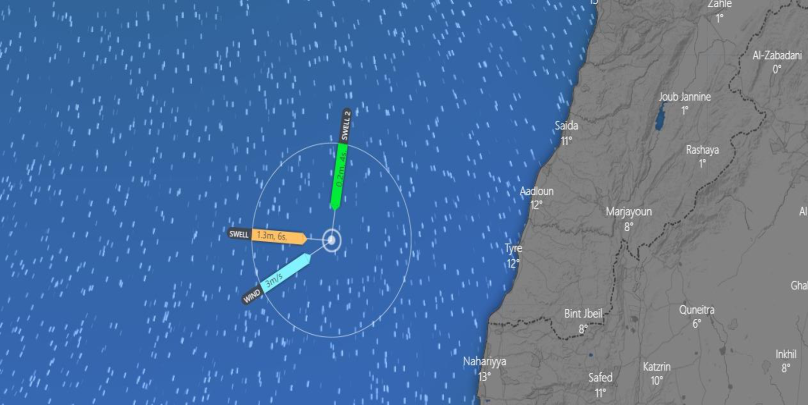 Figure 6Page 5
 Table 2Page 6
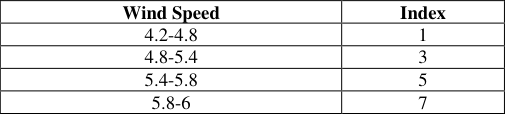 Table 4Page 6
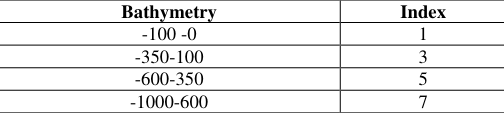 Table 3Page 6
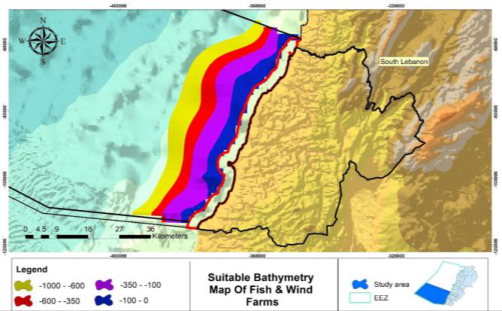 Figure 7Page 6
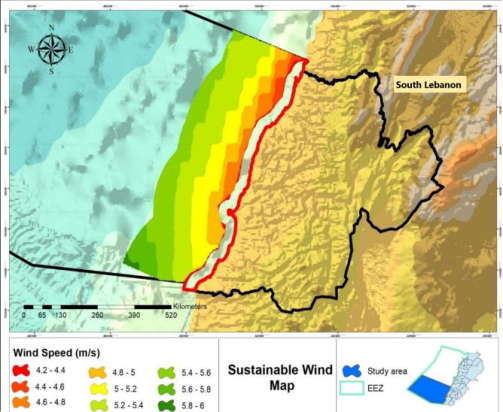 Figure 8Page 6
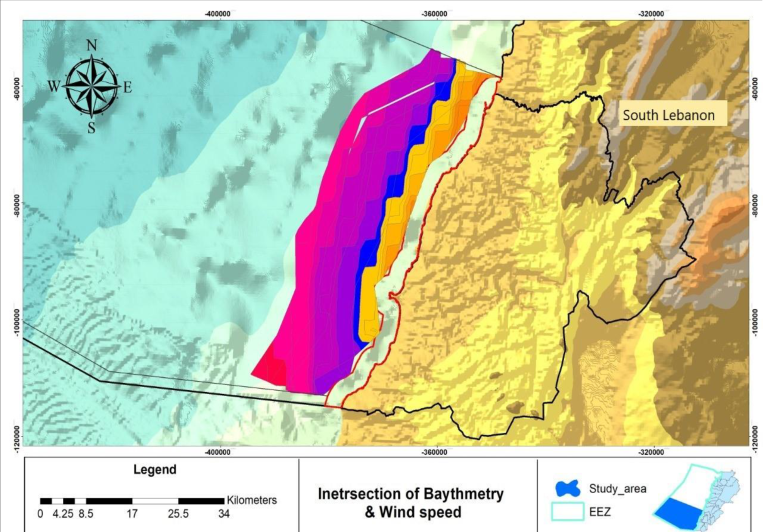 Figure 9Page 6
 Table 5Page 7
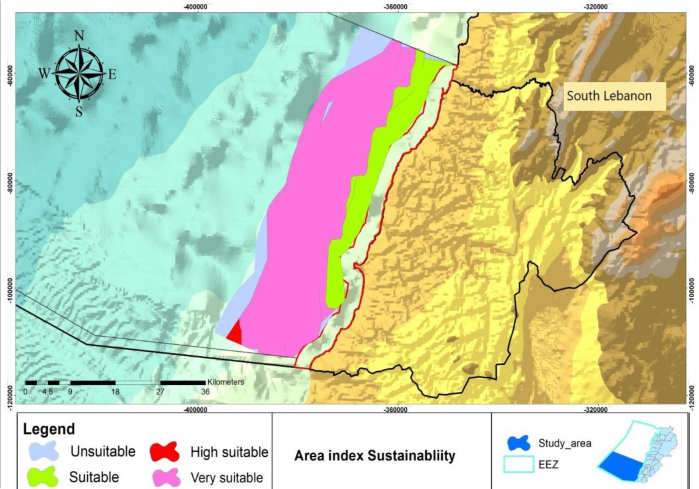 Figure 10Page 7
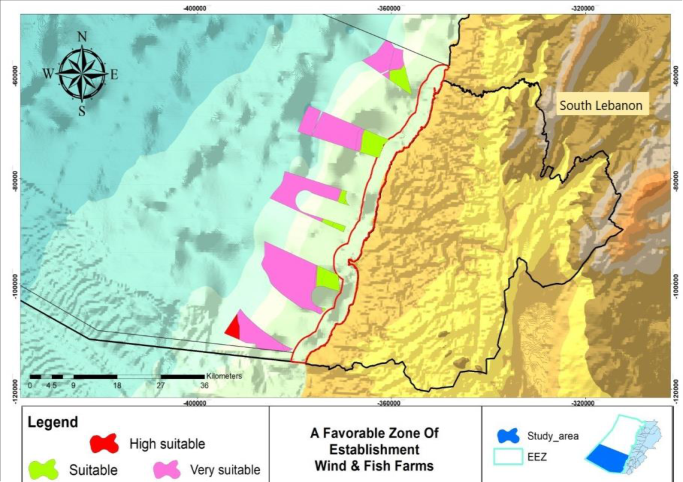 Figure 11Page 7
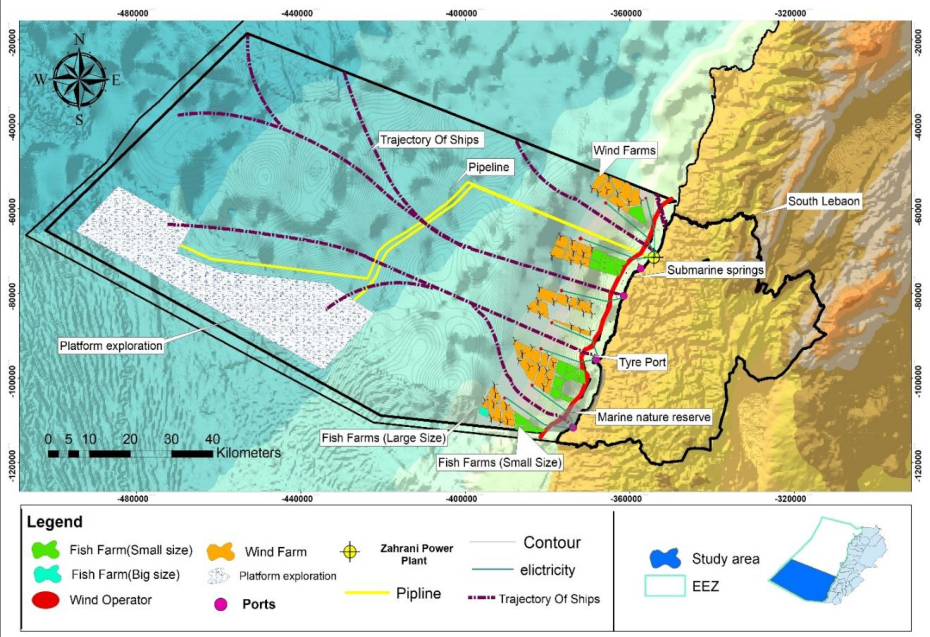 Figure 12Page 8
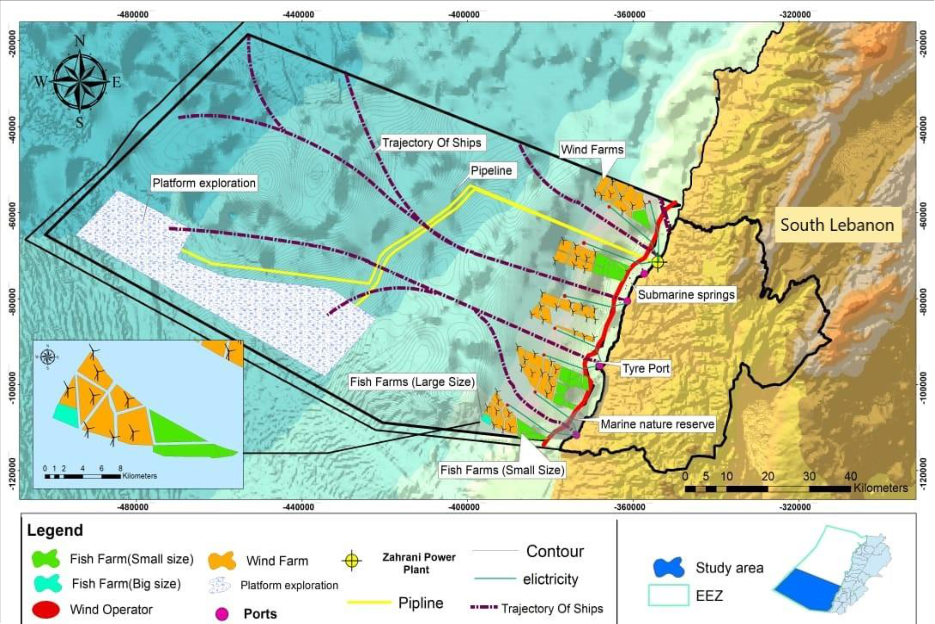 Figure 13Page 8
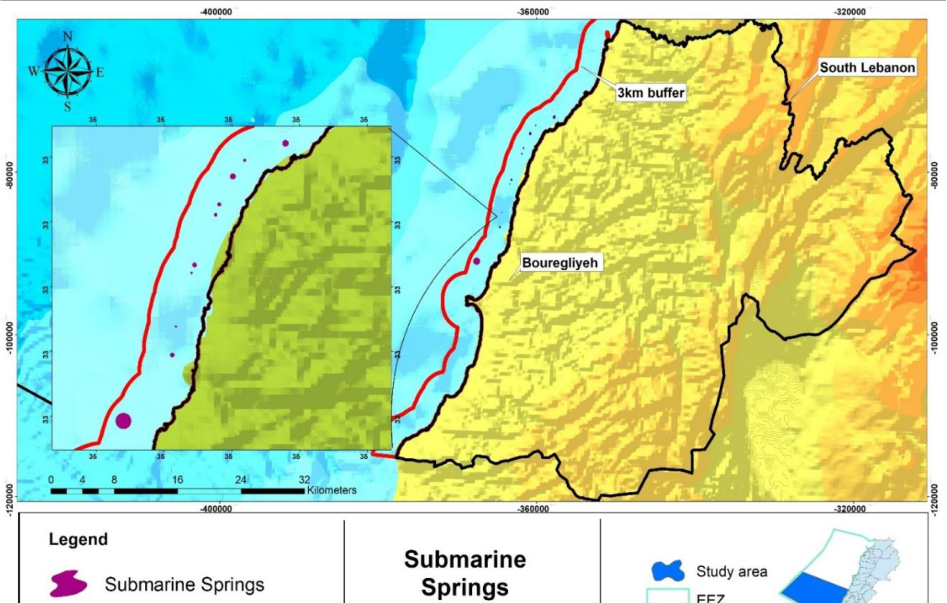 Figure 14Page 9
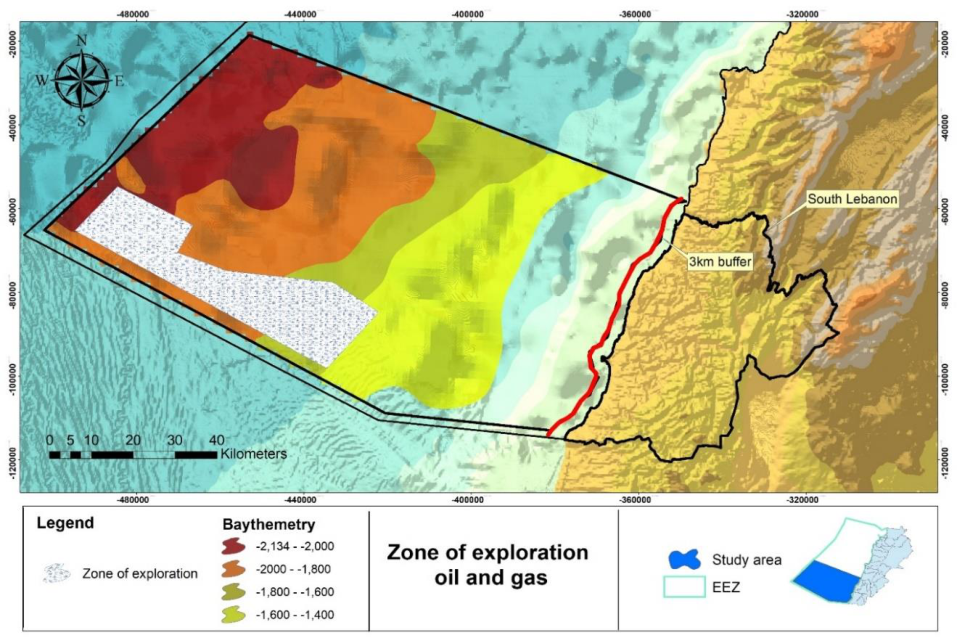 Figure 15Page 9
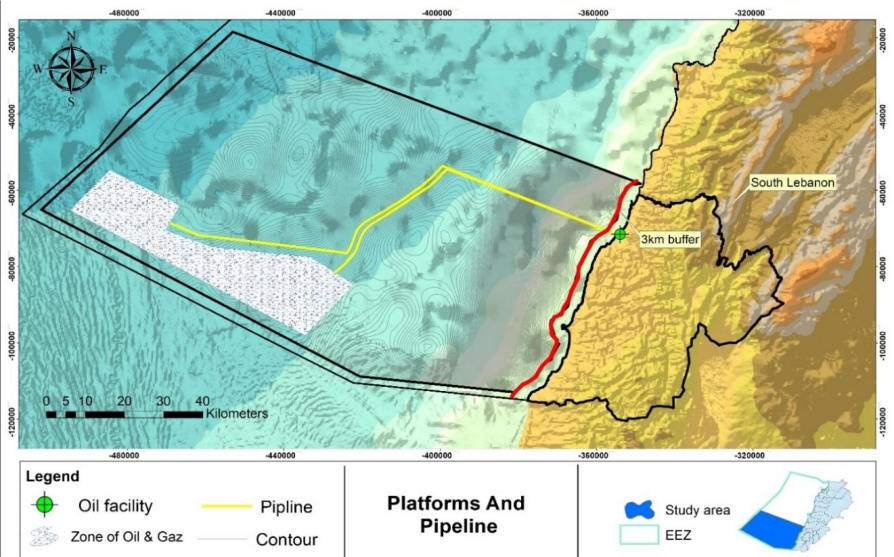 Figure 16Page 10
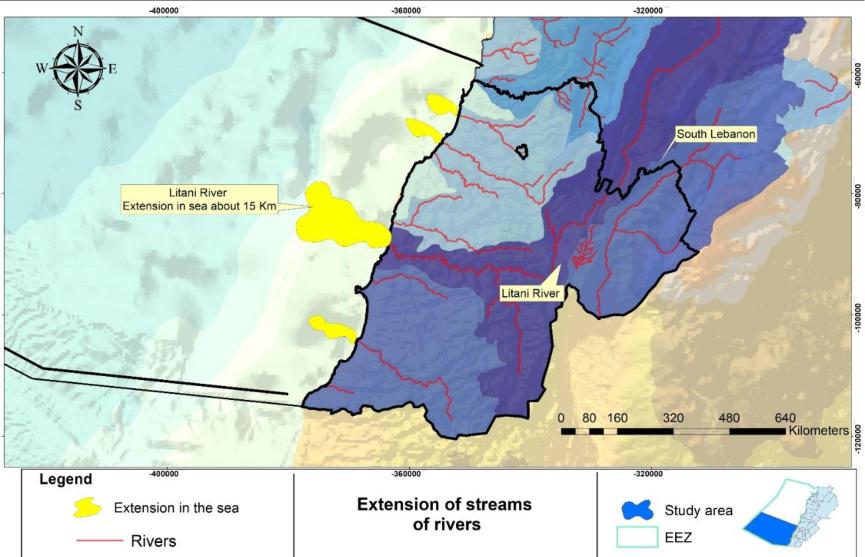 Figure 17Page 10
 Table 6Page 11
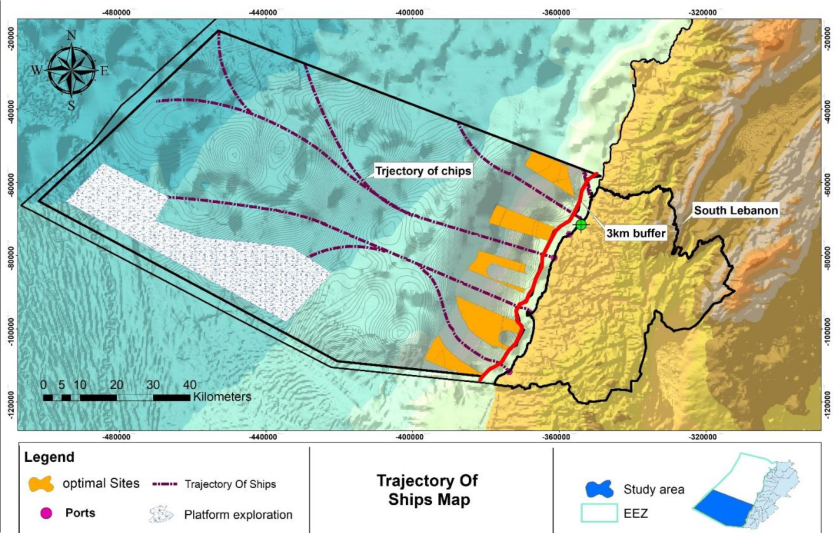 Figure 18Page 11
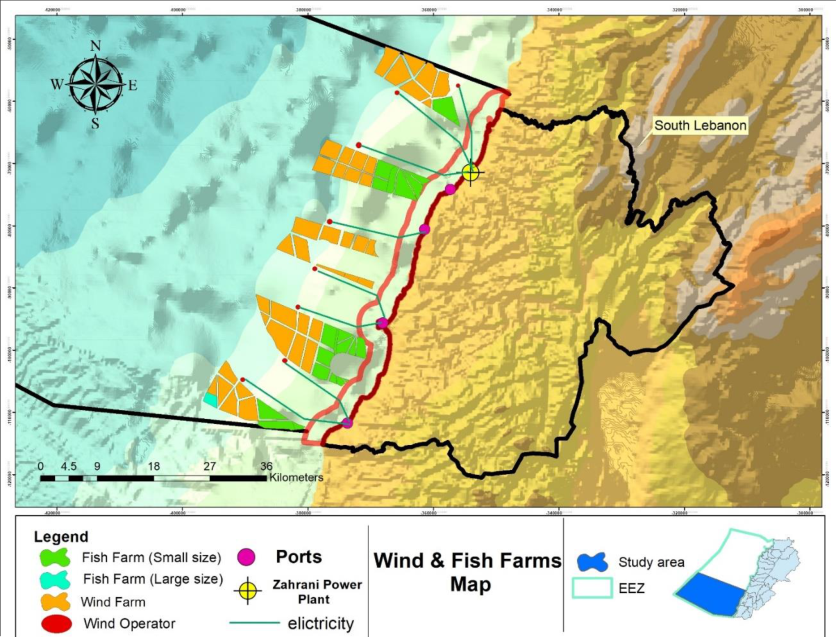 Figure 19Page 11
Introduction
The Earth now is not so far from the exhaustion of its electricity and meal resources. As an end result of securing the necessities of the sustainability of human life, Furthermore, this improvement contributed to tools and applied sciences evolutionary in exploring these assets that are no longer adequate to meet the desires of humans. In search of these resources, the interest grew to become in the direction of the oceans and seas, what is described as "blue economy", and what used to be extracted inland grew to exist underwater. Marine stations are of top-notch significance for industrial power and are an integral part of meal supply (Gabriel, 2015) [9] . The purpose is to draw the interest of humans to the significance of fish and wind farms; and the ball created greater than ninety percent of water, which has to be realized and paid interest to the existence of a revolution and a massive water wealth, which will extend the technology of the nation's financial system from electrical energy, and now not motel to importing large portions of oil, gasoline, and gasoline from abroad and to constructing a large financial power that can be exported abroad (Thomas, 2003) [14] . This will lead to renewable and sustainable and clean power and well-being for the population. Among our plans and emphasis in our venture is additionally the exploitation of remote places with fish of fantastic nature and the abundance of fish at home, which will lead to an increase in the share of Lebanese profits and economic needs, and the presence of lodges and eating places close to the seaside will embellish the arrival of vacationers in abundance and abundance, and in addition, it will minimize the impact of explosions in the water with small or large explosions from the loss of massive marine air pollution and fish and all this to assemble a weight loss program For the populace, the advantage from the sea and the upward jab of the economic system in Lebanon also Improving offshore wind and fish farms requires planning to find out the most splendid areas for the deployment of offshore wind and fish farm structures. For a better appearance at selecting the most dependable, GIS modeling is frequently carried out to furnish a healthy map (Kingsbury, 2004) [7] . GIS has become a major tool used to select the most suitable sites for onshore and offshore wind farm installations (Christidis, 2012) [15] . GIS methods for offshore wind projects have been applied in several countries around the world, such as Taiwan (Yue, 2009) [16] , China (Hong, 2011) [17] , Denmark (Möller, 2011) [17] , Greece (Vagiona, 2012; Christofora, 2017) [19,20] , Ohio (Mekonnen, 2015) [21] , South Korea (Kim, 2016) [22] and the Baltic States (Chaouachi, 2017) [23] . For instance, ref. (Yue, 2009) [16] evaluates wind energy resources with the aid of a GIS according to actual local conditions. Several local restrictions, such as wind speed, water depth, land use, and ecological environments, are considered in this analysis. Moreover, as import turns into the only way to meet the population's needs, fish farming is the only way to meet the demand for fish merchandise on account that it is not possible to increase the catches on a massive scale due to the limits and boundaries of the wild fish populations. The Food and Agriculture Organization stated that fish farming is one of the options to meet the growing demand of a developing population as fish is an environmentally friendly form of protein production. The predominant reason for the improvement of marine agriculture is the lack of covered websites for elevating fish and the fact that there are many open oceans in the world (Mathiesen ÁM, 2012.) [8] . To build these fish and wind farms, attention must be made to the penalties and developments that affect you in their various aspects, and consider each and every terrible impact that has a greater have an effect on than a wonderful one of submarine springs and extensions of streams of rivers, which are seen as one of the most indispensable sources of water due to the truth of the increase in the population's need for water in the Lebanese regions, basically the coastal segment of them. In addition to that, only the common sources of water are being used. Taking into account that if these farms are completed, a query ought to be asked: Are there consequences? and if it is determined that Lebanon has a great oil discoverer, what are the methods to take them into account as well? and how are the oil sources transferred from their vicinity to the neighborhood of work? beginning and by means of the use of whom? Therefore, offshore systems want to be established: massive constructions (floating or fixed) used to house the humans and tools desired for drilling ocean ground wells; natural oil and gas extraction; working produced fluids; and shipping pipelines to shore (Sharma, 2010) [12] . However, many humans do no longer know that the pipeline is the solely suggested for transporting beverages like water, oil, and gasoline from one location to another, which is critical for power transmission and additionally for keeping the country's financial system (Efzan, 2015) [3] Consider that pipelines play an imperative function in transporting crude oil (Hopkins, 2007; Seaman., 2010) [24,10] . This created an initiative, to put in advance this lookup message of ideas for setting up fish and wind farms in Lebanon, especially in the southern coast, via the GIS program, from its contrast and understanding to assemble a sophisticated, sustainable, and low-cost system that takes into account the dire state of affairs in Lebanon, and we will have monetary increase and diet at the stage of energy and fish, as well as radical selections for the investor and the state, especially elevating the stage of readiness to construct dams and obtain from streams, and extract oil to the extent that generating renewable electricity and even exports and a very massive monetary diploma rises, from ship lanes, pipelines, etc., and all of this to construct us with long-term power and nutrition. The introduction of novel concepts to GIS-based assessments of floating wind suitability in the form of layers representing high wind potential regions and long-term shore-normal components assisted the identification of productive and sustainable offshore wind and fish farm locations (Díaz, 2022) [25] .
Methodology 2.1 Study area
Lebanon is placed in Western Asia and on the eastern Mediterranean Sea. The use of a is placed between Latitudes 33˚ 03' 20" N and 34˚ 41' 35" N and Longitudes 35˚ 06' 15" E and 36˚ 37' 21" E. Our find out about will be in southern Lebanon alongside a shoreline of a hundred km (54 nautical miles), and an place of offshore about 7,000 rectangular kilometers, making it about sixty eight nautical miles (130 km) at its width of the sea and forty nautical miles (80 km) at its size of the sea. What is in addition illustrated in the map are numerous factors that want to be understood and taken into account; That is, there is a view of Lebanon from the governorates, especially in the south, in purple; It shows with the aid of the legend the exclusive economic zone and the view of the project, that is, in green; And the neighboring location that can't be labored in any shape of the establishments of the Lebanese authorities and is three kilometers from the Lebanese coast which is red, which ability that the purple coloration and the presence of some colorings suggest that it is the topography of the region Sea ground additionally It suggests distances in kilometers, in addition to the grid on the map As for the maritime borders Ministry of Energy and Waters (Flanders, 2019) [5] that Last edited on 2019-11-20 22:04:20 by Lonneville Britt and the exclusive economic zone, they are information from the Lebanese state (Figure 1.).
Materials and Methods
The first stage consists of the introduction of a spatial database primarily based on geographic statistics structures in GIS. That is, there are enemy factors that exist that explain the opening of this scientific lookup and, from them, (wind speed, bathymetry, submarine springs, watershed, and DEM (South Lebanon)). The 2nd stage, the exclusion stage, defines exclusion site criteria for water depth and wind speed and additionally entails the exclusion of incompatible areas by using chosen exclusion requirements Defining Buffer Zones for Pipelines, Submarine Springs, Trajectory of Ships, Platform Exploration, and Watershed and Surface Restrictions. After that, we pass to the remaining stage, which is a fee that represents the optimal sites of the intersection of wind farms and fish farms and is additionally regarded as the intersection factor of all maps with every other to manipulate the sea in southern Lebanon and exhibit the last. The proposed methodology is shown in (Figure 2):
2.2Data-Collection Stage
Bathymetric statistics have been downloaded from the facts warehouse, the General Bathymetric Chart of Oceans (GEBCO), and the National Oceanic and Atmospheric Administration (NOAA), European Marine Observation and Data Network (EMOD.net), and the statistics downloaded from the NOAA internet site have been licensed due to their excessive accuracy. Also, from the records of the National Council for Scientific Research (CNRS-L), wind velocity information at 50 meters used to be downloaded, in addition to facts on watershed and digital elevation information (DEM). The satellite TV for PC photos will additionally be used as a map for land cover use.
Define exclusion site criteria
The 2 nd stage for initiating the process of finding appropriate areas for the siting of wind farms and Fish farms is to knock out the areas deemed incompatible for the siting of offshore wind and fish farms. Two standards are used for this purpose: 1. The depth of the sea basin. 2. The wind speeds.
We have created bathymetry and wind pace maps and had been divided them into classifications that reflect on consideration of the stipulations required for the institution of wind farms and fish (Figure 7) (Figure 8). As for the depth offshore of south Lebanon, it is proven in (Figure 3). As for (Figure 4), the sea depth is proven after a distance of three km, thru which the classification was once classified. The intention of Figures three and four is to clarify in the relaxation of the maps show the water depths had been categorized from (0-100, -100-350, -350-600, and -600-1000) to exhibit that the depth past three km is about -50, and that it is much less and indicates how we divide it from the preceding maps to analyze it from the wind pace and the relaxation of the standards in it, and that the final blind was once taken is -1000 meters to mix it with the wind velocity criterion, i.e.,-1000 meters is about 15 km to 19 km and is associated with a wind velocity of up to 6 m/s. As for what is earlier than three km, it indicates and indicates that the depth of the seafloor is much less and we did not take it from a depth of -50, i.e., to three km, which is The lowest wind velocity is present, and it is additionally no longer viable to work with it by way of advantage of a decree from Lebanon's proclamation of an EEZ included in its Law No. 163 and consolidated through Government Decree No. 6433 dated October 1, 2011. It used to be consequently timely, and hence we took into account that from 0 is a line of three km to -100 with an increased wind pace and mixed it with the rest of the maps and analyzed that scale is every 1.9 cm on the map corresponds to a 10 km increase in the ground surface (GEBCO). As for the 2 nd criterion, there is a relationship between wind pace and wave movement. The movement of the waves is comparable to the floor wind motion of the sea. The relationship is proven through the wind rose, which shows the instructions of the winds and waves. For example, in south Lebanon, we do this wind rose, as shown in the (Figure 5) and (Figure 6) instructions (Wind speed, swell: that shows the path of the wave to the shore). Also, the relationship between them, to show you that in Lebanon there is no swell of the wave, regardless of the price of wind speed, which was once placed at some stage in these types, that about three km away there is an immoderate wind velocity of 7 m/s, and that the charge of the swell of the wave is low the farther away we are, and it does no longer have an effect on the institution of any wind farm or fish in order to no longer return to the waves. For example, if in Lebanon the fee of the swelling of the waves is very excessive and the wind tempo is immoderate and it is three km away or earlier, it is practicable that it influences these farms, and thinking about the fact that it is three km away, it is very applicable for us to take it into consideration, and that no matter how immoderate the wind is, it does not exceed two in the swell of the wave, and this depends on used. The wind rose Farther than from the Shore, wind 3m/s, swell 1.3m-6s
Process
Wind speed and water depth decide the most reliable areas for setting up fish farms. For example, the suggested maximum dive depth of many sorts of fish (Haddock (Melanogrammus aeglefinus) ranged from 50 to 400 preferred depth meter and also depth (top-bottom; m) from 12-21 meter (Sievers, 2022) [13] . The suggested maximum dive depth for the seafood products (Salmon and Whitefish fishes) that Fish farming for high valued seafood products needs low water temperatures as far as 17 kilometers offshore and with depths up to 1,000 meters (FAO, 2018) [4] . As for wind farms, the sea depth of these farms differs from one country to another. We have divided the classification at every 100-meter depth, down to a depth of one thousand meters, and wind speeds exceeding 3.5 m/s. To discover these sites, we intersect two blended maps to pick the proper website for these farms, for which standards have been set that serve our research inappropriate and inappropriate locations (Figure 9).
Define Buffer Zones
It is vital to define the minimal distances to be maintained to decide the most appropriate areas for putting in wind and fish farms. Standards intend to prevent warfare between these ideal sites and the entirety that impacts these sites for similarly minimal distance exclusion. Therefore, in our study, the areas of marine springs have to be defined, pipelines stretched from the region of oil drilling to the ground, and ship routes need to be precise extensions of rivers in the sea so that they do not fight with the superior sites, which keep the integrity of the area. (Table 1) indicates the buffer area of every condition. And there are no references used in it that have been taken from the nature of these maps and our analysis of them, and consequently it has been relied on in this way for the security of human beings and the maintenance of the surroundings through ship lanes that ought to be crossed through limitations at the backside of the sea and at least to pipelines from explosions and inflicting marine air pollution, and submerged springs and watersheds that drain mostly into the sea. As for fishing activities, you can do any recreation and any land that can be labored on in any fish farm supplied that there is no chance to it at all, and on account that we have carried out every one of them with a minimal of 3 km of brief shops at the paths of ships and others, he can lift out any things to do and measures It is additionally shut to the seashores thru measures and requirements set through the Lebanese states for fishermen and now not to inn to bombing and the like so that there is a monetary surrounding and sustainable improvement in it as long as the map suggests the lands appropriate for constructing these farms. Also modern fishing equipment and techniques are making deep-bottom fishing easier, and this technique is becoming more prevalent. However, it still requires a lot of skill and determination to successfully fish this method.
| Conditions | Buffer zone |
|---|---|
| Pipeline | 5 km |
| Trajectory of ships | 6 km |
| Extension of watershed | 5 km |
| Submarine springs | 3 km |
Table text extracted from the original PDF; superscript letters are shown inline. The original table image is below.
View original table image
There are a variety of tricks and techniques that can be used to catch fish in deep waters. Back in the old days, deepbottom fishing was carried out using traditional equipment such as canoes. The use of locally-available materials and equipment made from such materials was a challenge for most experienced fishermen. Today, the use of modern equipment and techniques is making this method easier to implement.
Results
The final stage of the methodology involves giving a value of the candidate sites that emerged from Stage 2 to identify the optimum installation area for a wind and fish farm in the study area. The areas that have been identified are mainly suitable according to spatial criteria regarding the installation of wind and fish farms. An attempt is performed to compare the available areas to arrive at the best sitting position from an economic, social, and efficiency perspective. Where a value was given to the sites according to the depth and wind speed. The comparison takes these values from a scale of 1 to 7. The (Table 2) show where 1" suitable", 3-5 " very suitable", 7 " high suitable" (Figure 10). After determining the values for the optimal sites, maps were collected so that these sites do not conflict with the locations of marine springs, marine pipelines, ship routes, and everything that opposes the determination of these sites. (Table 3) showing the suitable bathymetry of wind and fish farms, and each depth was given an index. Depth -0 to -100 is given a rank of 1, -100 to -350 is given a rank of 3, -350 to -600 is given a rank of 5, and -600 to -1000 is given a rank of 7. It was divided into this form in order to serve the field of our study. (Table 4) shown the suitable wind speed of wind and fish farms and each depth was given an index. Wind speed (4.2-4.8) is given a rank of 1, wind speed (4.8-5.4) is given a rank of 3, wind speed (5.4-5.8) is given a rank of 5, andwind speed (5.8-6) is given a rank of 7. It was divided into this form in order to serve the field of our study. High suitable (Table 5) showing the intersection between two factors (wind speed, depth) where a value was given to the sites according to the depth and wind speed. The comparison takes these values from a scale of 1 to 7. Where 1" suitable", 3-5 " very suitable", 7 " high suitable". Since the importance of the wind speed factor and the depth factor are incorporated in selecting optimal sites for fish and wind farms. Also, to determine these sites, attention must be paid to the submarine springs and the potential oil pipelines. And everything that opposes these sites. GIS is ideal for this kind of study to accomplish the analysis. The work was mainly accomplished using ArcGIS software and ArcMap.
| Rating | Index of Importance |
|---|---|
| 1 | Suitable |
| 3-5 | Very suitable |
| 7 | High suitable |
Table text extracted from the original PDF; superscript letters are shown inline. The original table image is below.
View original table image
| Bathymetry | Index |
|---|---|
| -100 -0 | 1 |
| -350-100 | 3 |
| -600-350 | 5 |
| -1000-600 | 7 |
Table text extracted from the original PDF; superscript letters are shown inline. The original table image is below.
View original table image
| Wind Speed | Index |
|---|---|
| 4.2-4.8 | 1 |
| 4.8-5.4 | 3 |
| 5.4-5.8 | 5 |
| 5.8-6 | 7 |
Table text extracted from the original PDF; superscript letters are shown inline. The original table image is below.
View original table image
| Rating | Index of Importance |
|---|---|
| 1 | Suitable |
| 3-5 | Very suitable |
| 7 | High suitable |
Table text extracted from the original PDF; superscript letters are shown inline. The original table image is below.
View original table image
Vector data type was used as a data type for all layers.
These maps have several scales depending on their importance for each determining factor; a map was produced and classified according to suitability classes. Several re-processing tools (Buffer, Intersection, Merge) were applied to generate the map representing each factor A classification was obtained for a wind and fish farms map by assigning values from 0 to 7 to its attribute table according to the suitability class. Any polygon receiving at least one 0 attributes from any of the implemented layers is consequently unsuitable for wind and fish farms and must be restricted and classified as unsuitable A map was then compiled reflecting the reality of our field of study: (0 -Unsuitable), Suitable (1), Very Suitable (3-5), and High Suitable (7). Maps of each of the potential oil pipelines, marine springs, watersheds, trajectory of ships, and the locations of oil platforms from figures (37-48) After that, these maps were used and combined with the appropriate classification to create a final map of the best sites for wind and fish farms in (Figure 11).
Discussion
The findings of this investigation assist decision-makers and authorities in Lebanon in selecting appropriate wind and fish farms to build and overcome the country's financial difficulties. Wind speed and sea depth elements have a sturdy impact on the site's location. Also, the city areas' things are an imperative aspect in making the excessive suitability. For sustainable development, this lookup will inspect the corporation of the marine areas of southern Lebanon and their most effective use in sustainable improvement tasks for these areas (optimal sites for fish farms, wind farms, doable oil pipelines, submarine springs, herbal covered marine areas, etc.). In (Figure 12) and (Figure 13). Also, we can see in (Google Earth). It is necessary to pay attention to the submarine springs identified as 14 springs (Figure 14). The platforms sites have been determined as oil and gas at a depth ranging between 1400-2000 meters (Figure 15). we extended the pipelines to the Zahrani area, taking into account the contour of the depths, which is shown through (Figure 16). Before combining these maps to avoid the problem of conflict with the sites, it is necessary to mention the water flows from rivers into the sea (plumes), which reflects negatively on the establishment of fish farms in front of these rivers. Because the glide of this Lithuanian river, which flows into the sea, as it was once noted, is 15 km, that means that there are farms for wind and fish, and most of them are for fish due to the fact that it is feasible for some sorts of fish to be affected by the aid of sweet water and at the same time salty water. For example, the country needs to extract sparkling water and provide it to the citizens. Is it feasible to extract it? Of course, each will have an effect on and preclude it considerably with the presence of fish farms, and have an effect on the vitamin proteins of some kinds of fish and dissolved oxygenation: These are small fish that stay in the fish and their share of fish. Melted fish vary according to the type of fish, fish, temperature, number, and so on, types of fish that can survive for long periods of time in white water with low oxygen levels. They make that of their bodies in the air, in general. And there are five plumes (The most poured into the sea, mainly in our finding out about southern Lebanon, which is the most essential in it) and among these rivers, an influence is the Litani River, which extends 15 km deep in the sea that shown in (Figure 17). After that, we chose the best route for the ships that did not conflict with the optimal sites for establishing farms (Figure 18). After identifying all these factors, the final map shows the best place to establish these farms. (Figure 19) Moreover, (Table 6) shown the fish and wind farms areas.
| Farms | Areas (Sq.km) |
|---|---|
| Fish Farm (Large size) | 110.4131 Sq.km |
| Fish Farm (Small size) | 3.6404 Sq.km |
| Wind Farms | 273.1614 Sq.km |
Table text extracted from the original PDF; superscript letters are shown inline. The original table image is below.
View original table image
Conclusion
The study proved that the both use of geographic information systems and remote sensing in managing marine areas where human activities interfere with natural habitats contributed to enhancing the ability and increasing confidence in maintaining a sustainable marine ecosystem. Especially after the introduction of new natural environmental standards for the management of these marine areas, such as bathymetric maps, surface wind speed and direction, sub-marine freshwater springs, and river deltas (Plumes) which led to the creation of proportional distributions of fish farms and marine environmental reserves in light of the occupation of large areas for alternative energy. And sustainable wind farms, because there are great requirements for the development of many species that enter the food industry. These habitats have also been spared potential risks arising from the trajectory of commercial ships and oil tankers, which increase the possibility of destructive pollution to diverse marine life. Geographic information systems and marine surveys have contributed to protecting the deep sea and its ecosystem from the risks of potential human or natural events resulting from damage to pipelines transporting petroleum materials extending from oil extraction platforms or between countries. The use of geographical information systems and bathymetry has led to drawing and determining the most appropriate trajectory oil pipeline that takes into account the marine environment on the beaches or in the deep sea. These new criteria and methods used in managing the marine environment and working on its sustainability have helped decision-makers take advanced steps to help stakeholders achieve sustainable and clean marine development.
References
19 in the original paper- Bakke T, Klungsøyr J, Sanni S. Environmental impacts of produced water and drilling waste discharges from the Norwegian offshore petroleum industry. Marine Environmental Research. 2013;92:154-169.
- Díaz H, Soares CG. An integrated GIS approach for site selection of floating offshore wind farms in the Atlantic continental European coastline. Renewable and Sustainable Energy Reviews. 2020;134:110328.
- Ervina Efzan MN, Kesahvanveraragu S. Review on pipelines in offshore platform processing system. In Applied Mechanics and Materials. 2015;695:684687.
- Hooper T, Beaumont N, Hattam C. The implications of energy systems for ecosystem services: A detailed case study of offshore wind. Renewable and Sustainable Energy Reviews. 2017;70:230-241
- Seaman J. Energy security, transnational pipelines and China's role in Asia. Institut Franҫais des Relations Internationales. 2010;27:1-38.
- Sharma R, Kim TW, Sha OP, Misra SC. Issues in offshore platform research-Part1: Semi-submersibles. International Journal of Naval Architecture and Ocean Engineering. 2010;2(3):155-170.
- Sievers M, Korsøen Ø, Warren-Myers F, Oppedal F, Macaulay G, Folkedal O, et al. Submerged cage aquaculture of marine fish: A review of the biological challenges and opportunities. Reviews in Aquaculture. 2022;14(1):106-119.
- Thomas S, Dawe RA. Review of ways to transport natural gas energy from countries which do not need the gas for domestic use. Energy. 2003;28(14):14611477.
- Christidis T, Law J. Review: The use of geographic information systems in wind turbine and wind energy research. Journal of Renewable and Sustainable Energy. 2012;4(1):012701.
- Yue CD, Yang MH. Exploring the potential of wind energy for a coastal state. Energy Policy. 2009;37(10):3925-3940.
- Hong L, Möller B. Offshore wind energy potential in China: Under technical, spatial and economic constraints. Energy. 2011;36(7):4482-4491.
- Möller B. Continuous spatial modelling to analyse planning and economic consequences of offshore wind energy. Energy Policy. 2011;39(2):511-517.
- Vagiona DG, Karanikolas NM. A multicriteria approach to evaluate offshore wind farms siting in Greece. Global NEST Journal. 2012;14(2):235-243.
- Christoforaki M, Tsoutsos T. Sustainable siting of an offshore wind park a case in Chania, Crete. Renewable Energy. 2017;109:624-633.
- Mekonnen AD, Gorsevski PV. A web-based participatory GIS (PGIS) for offshore wind farms suitability within Lake Erie, Ohio. Renewable and Sustainable Energy Reviews. 2015;41:162-177.
- Kim T, Park JI, Maeng J. Offshore wind farm site selection study around Jeju Island, South Korea. Renewable Energy. 2016;94:619-628.
- Chaouachi A, Covrig CF, Ardelean M. Multi-criteria selection of offshore wind farms: Case study for the Baltic States. Energy Policy. 2017;103:179-192.
- Hopkins PE. Positionalities and knowledge: Negotiating ethics in practice. ACME: An International Journal for Critical Geographies. 2007;6(3):386-94.
- Díaz JL. La conciencia viviente. La conciencia viviente. 2022, 1-00.