
Research article · 2023 · Full text
International Journal of Statistics and Applied MathematicsEstimates of urbanisation pattern in Tiruchirapalli District: An economic analysis
Volume 8(6S) · Pages 180–183 · DOI: 10.22271/maths.2023.v8.i6sc.1378 ↗
Research areasUrban and Rural Development ChallengesAgricultural Economics and PracticesSocial and Economic Development in India
Abstract
Author-writtenUrbanisation is an index of transformation from traditional rural economy to modern industrial economy and progressive concentration of population in urban units. It mostly subsumes the rural populace attributes usurping along the agricultural land for industrial activities or for the settlement purpose. Urban conversion of agricultural land was intense and alarming in a few districts and states with high rates of economic growth. The specific objectives set forth are to evaluate the structure and pattern of urbanisation in the study area and to determine the impact perception and factors influencing on urbanisation in the study area. A multistage stratified random sampling technique was adopted in this study. The tools of analysis used are descriptive statistics, urban indices and log it model. The results revealed that the urban indices of the three sample talukas that the urbanisation has been more pronounced in the peri-urban and urban gradients than the rural gradient, as per the census 2011 and 2001 and also the study revealed that the urbanisation has both positive and negative impacts on the sample respondents.
Summary
Source-checkedPlain-language reading of the full paper, prepared with AI and checked against the text. Each point links to the authors' own words.
Why it matters
- Urbanization represents the shift from a traditional rural economy to a modern industrial one, characterized by the concentration of people in urban areas. View evidence ↗
- As urbanization progresses, agricultural land is often taken over for industrial use or residential settlements. View evidence ↗
- Technological advancements in agriculture increased productivity, which pushed excess rural populations toward urban centers without significantly affecting total crop production. View evidence ↗
The question
- The study aimed to evaluate the structure and pattern of urbanization in the Tiruchirapalli district and determine the factors influencing it and how it is perceived. View evidence ↗
What they did
- The researchers used a multistage stratified random sampling technique, dividing the nine talukas of Tiruchirapalli district into rural, peri-urban, and urban gradients. View evidence ↗
- The final sample included 270 respondents, with 90 individuals selected from each of the three gradients (rural, peri-urban, and urban). View evidence ↗
- Data analysis was performed using descriptive statistics, various urban indices, and a logit model. View evidence ↗
What they found
- In the 2011 census, the level of urbanization was highest in the urban gradient (75.76%), followed by the peri-urban (29.97%) and rural (19.59%) gradients. View evidence ↗
- Between 2001 and 2011, the peri-urban gradient experienced the highest decadal growth (68.99%), compared to 38.35% in urban and 4.20% in rural gradients. View evidence ↗
- The rate of urbanization was positive for peri-urban (39.32%) and urban (8.29%) gradients, but negative for the rural gradient (-2.40%). View evidence ↗
- Urban population growth contributed most to total population growth in the urban gradient (96.67%), followed by peri-urban (67.84%) and rural (12.17%) gradients. View evidence ↗
- A majority of respondents (70.37%) perceived that urbanization had a positive impact across the identified dimensions. View evidence ↗
- Despite positive perceptions, 72.60% of respondents also identified negative implications resulting from urbanization. View evidence ↗
- The logit model showed that larger land holdings negatively influenced the perception of urbanization's impact; for every one-acre increase, the odds of perceiving it as impactful decreased by 1.027 times. View evidence ↗
- Family migration, occupational shifts, and household land loss were found to be positively significant factors influencing the perception of urbanization's impact on farming. View evidence ↗
What it means
- The authors recommend the development of a balanced rural-urban policy to ensure a smooth transition during the process of urbanization. View evidence ↗
Visual summary
3 visualsIllustrations explain the paper; charts are replotted from the paper's own table values.
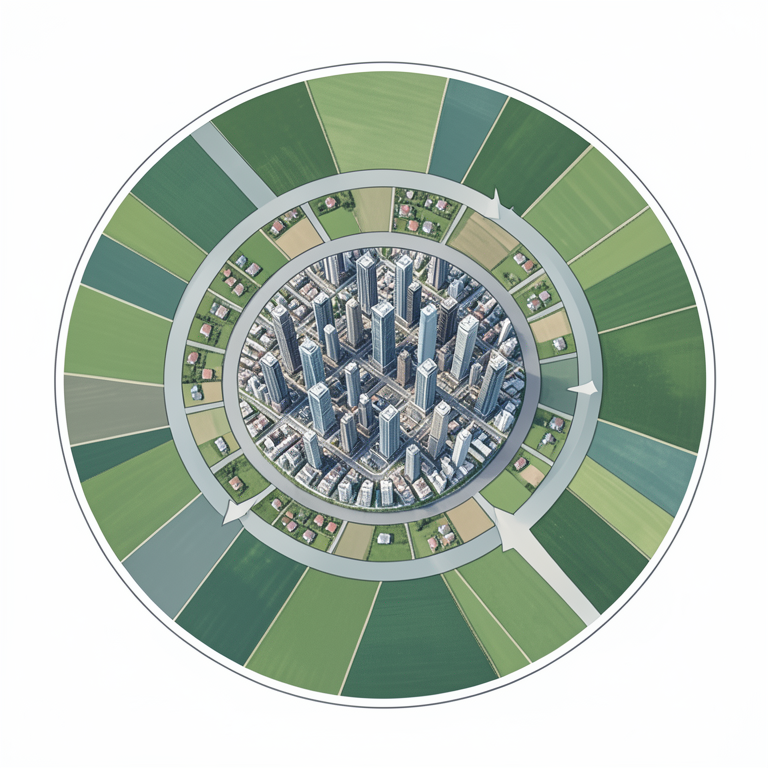
Urbanization Gradient Comparison
AI-generated conceptual illustration (A landscape map of Tiruchirapalli District showing urban, peri-urban, and rural land use). It explains the idea and does not show study data.
View source evidence ↗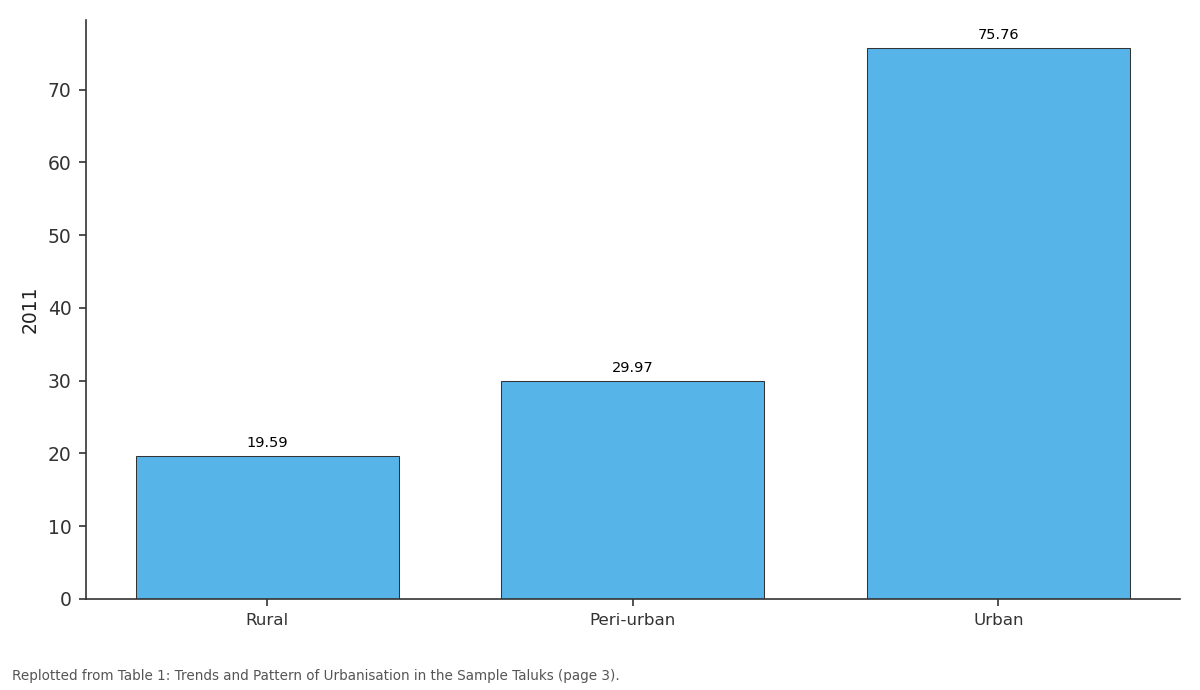
2011: Rural vs Peri-urban vs Urban
Replotted from Table 1 (page 3) of the original paper. Every bar is the paper's own table value.
View source evidence ↗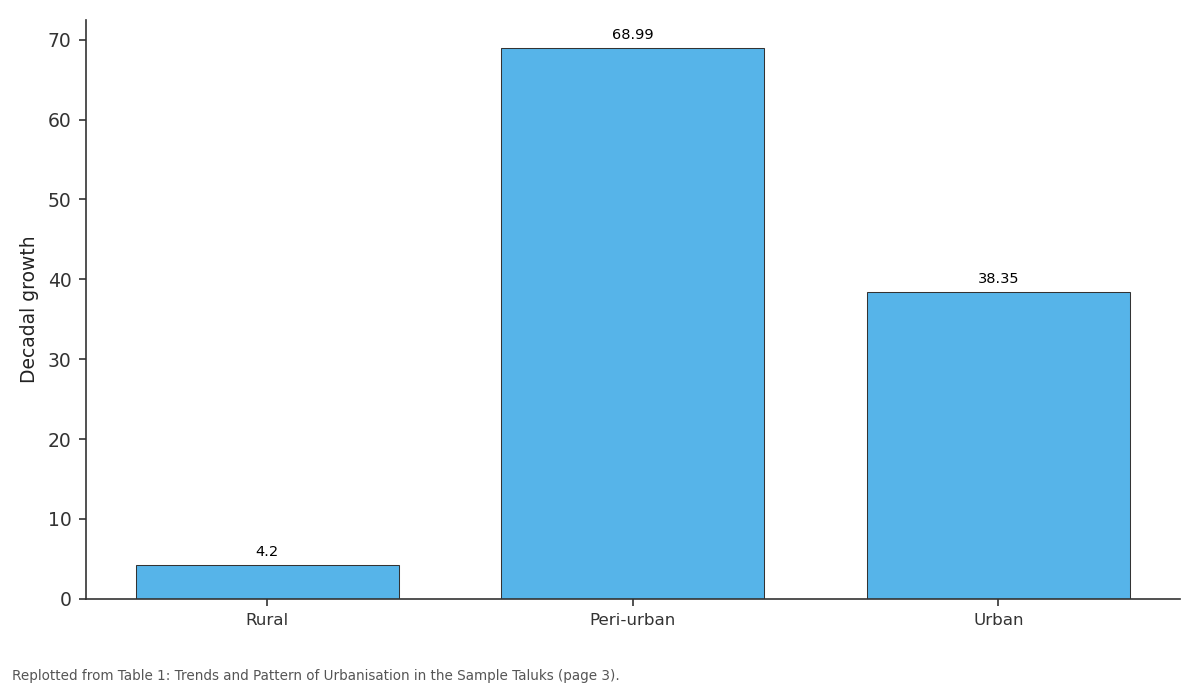
Decadal growth: Rural vs Peri-urban vs Urban
Replotted from Table 1 (page 3) of the original paper. Every bar is the paper's own table value.
View source evidence ↗Figures & tables
From the original paper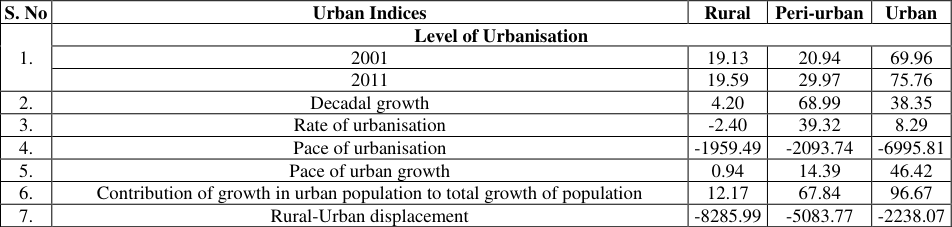 Table 1
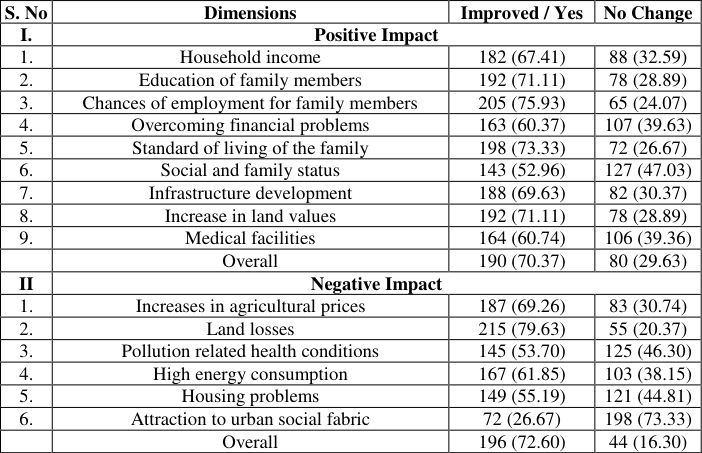 Table 2
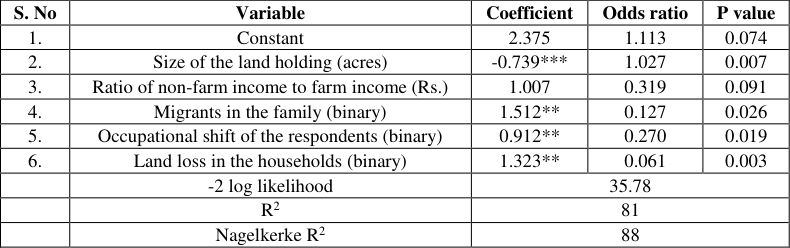 Table 3
Introduction
Urbanization is defined as the movement of people from small communities concerned chiefly or solely with agriculture to other communities generally larger, whose activities are primarily centred in government, trade, manufacture or allied interest (Thompson, 1935) [3] . Urbanization is a worldwide megatrend that has drastically changed people-environment interactions in the last decades and is expected to remain one of the main drivers of global change in the future. As the population becomes more and more urban, the adjoining rural area comes under 'urban zone of influence', which impart some distinct urban characteristics in rural populace. Over time, the urbanization mostly subsumes the rural populace attributes usurping along the agricultural land for industrial activities or for the settlement purpose. On the natural ecosystems, currently, conversion of rural areas to urban areas had a marked effect at unprecedented rate. Urbanisation is an index of transformation from traditional rural economy to modern industrial economy and progressive concentration of population in urban units. The economic improvement and technological advancement have inspired people to move closer to urban and semi-urban areas in a country. The technological transformation of agriculture had a much larger effect on the movement of people from rural to urban areas and concluded that urbanisation had little effect on the total crop production, whereas, technological changes in agriculture had resulted in increased productivity and pushed the excess population to urban areas (Winfield, 1973) [5] . With the above background this study has been carried out, to estimate the urbanisation pattern among different gradients of Tiruchirapalli district, the specific objectives are as follows, 1. To evaluate the structure and pattern of urbanisation in the study area. 2. To determine the impact perception and factors influencing urbanisation in the study area.
Design of the study 2.1 Methodology
A multistage stratified random sampling technique was adopted in this study. The nine talukas of Tiruchirapalli district have been classified as three gradients namely, Rural, Peri-urban and Urban, based on the proportion of urban population in the respective talukas (Census 2011) [1] and also by referring geographical map of Tiruchirapalli district. One taluk has been randomly selected from each of the gradients, six villages have been randomly selected from each of the selected gradient and 15 respondents have been randomly selected from each of three villages. The ultimate sample consists of 270 sample respondents, which comprised of 90 sample respondents in each of the gradients, namely, Rural, Peri-urban and Urban. The primary data has been collected from the sample respondents of Rural, Peri-urban and Urban gradients using structured interview schedule.
Tools of Analysis 2.2.1 Descriptive Analysis
Descriptive statistical analysis was undertaken using percentage, mean etc. to study the impact perception of urbanisation pattern.
Urban Indices
The process of urbanisation has been analysed on the basis of different urban indices, namely, level of urbanisation, decadal growth of urban population and the rate of urbanisation (Sivaramakrishnan et al., 2005) [2] . In addition, the Eldridge index (Vaidyanathan, 1981) [4] was also used to investigate the pace of urbanization. Also, the pace of urban growth, contribution of growth in urban population to total growth of population and rural-urban displacement have been calculated.
Logit Estimates on Urbanisation Impact Perception
The logit model was also used to find out the determinants for factors influencing respondents' perception on impact of urbanisation over farming (binary). The index variable Li indicates that whether respondents perception if yes to taken the value one and otherwise, it takes the value zero, is the function of some independent variables and is expressed as. The pattern of urbanisation has also been analysed on the basis of urban indices for the three sample gradients, viz., rural, peri-urban and urban. The results are presented as trends and pattern of urbanisation in Table 1. It is also seen that the rate of urbanisation was positive in the peri-urban and the urban gradient (39.32 per cent and 8.29 per cent, respectively). Whereas, rural gradient had a negative rate of urbanisation (-2.40 per cent), might be due to lesser percentage of urban population. The pace of urban growth in the three gradients have recorded a positive growth of 0.94 per cent, 14.39 per cent and 46.42 per cent in the rural, peri-urban and urban gradient. However, the pace of urbanisation showed a negative pattern in all the three gradients, which might be due to the positive growth in urban population in the decades with respect to previous decade. The contribution of urban population growth to the total population growth was measured as 96.67 per cent in the urban gradient, which was the highest, followed by 67.84 per cent in the peri-urban and 12.17 per cent in the rural gradient, respectively. And the rural-urban displacement was negative in rural (-8285.99), peri-urban (-5083.77) and urban (-2238.07) gradients, which indicates that the people had been displaced from rural areas to urban areas during the decades.
| S. No | Urban Indices | Rural | Peri-urban | Urban |
|---|---|---|---|---|
| 1. | Level of Urbanisation | |||
| 2001 | 19.13 | 20.94 | 69.96 | |
| 2011 | 19.59 | 29.97 | 75.76 | |
| 2. | Decadal growth | 4.20 | 68.99 | 38.35 |
| 3. | Rate of urbanisation | -2.40 | 39.32 | 8.29 |
| 4. | Pace of urbanisation | -1959.49 | -2093.74 | -6995.81 |
| 5. | Pace of urban growth | 0.94 | 14.39 | 46.42 |
| 6. | Contribution of growth in urban population to total growth of population | 12.17 | 67.84 | 96.67 |
| 7. | Rural-Urban displacement | -8285.99 | -5083.77 | -2238.07 |
Table text extracted from the original PDF; superscript letters are shown inline. The original table image is below.
View original table image
It could be concluded from the urban indices of the three sample taluks that the urbanisation has been more pronounced in the peri-urban and urban gradients than the rural gradient, as per the census 2011 and 2001. This might be due to the formation of urban fringes along the urban area, due to population pressure and industrialisation.
Impact perception of urbanisation
The process of urbanisation is bound to have socio-economic implications on the populations. The impact of urbanisation both positive and negative, as perceived by the sample respondents was studied and are presented in Table 2. To study the indirect benefits accruing from urbanization, eight dimensions were identified, viz., household income, education of the family members, chances of employment for family members, overcoming financial problems, standard of living of the family, social and family status, infrastructure development, increase in land values and medical facilities and the responses were collected from the respondents. In the process of urbanisation, the people and the society has to bear some losses too. The negative impacts in terms of increase in agricultural prices, land losses, pollution related health conditions, high energy consumption, housing problems, attraction to urban social fabric were also identified. The results on the perception of respondents are presented as a whole in Table 2, since there were no significant differences in the perception of sample respondents across the gradients. It could be observed from the table that majority of the respondents (70.37 per cent) opined that the various dimensions identified in the study had positive impact of urbanisation. Whereas, only 29.63 per cent were of the view that urbanisation has not done good to them. Out of the nine positive dimensions, almost all the dimensions except social and family status, received more than 60 per cent of positive responses of these, chances of employment for family members had the highest positive responses, followed by standard of living of the family, educational level of family members and increase in land values. A further look at the table indicated that 72.60 per cent of respondents opined that there were negative implications of urbanisation and the rest of 16.30 per cent of respondents felt it was not so. Among the negative dimensions, the loss of land and increase in the price of agricultural commodities received more yes responses. The dimension 'attraction to urban social fabric' received the least percentage of yes responses. More than 50 per cent of respondents were opined that urbanization would result in pollution related health conditions and housing problems. Hence, it could be concluded that the urbanisation has both positive and negative impacts on the sample respondents.
| S. No | Dimensions | Improved / Yes | No Change |
|---|---|---|---|
| I. | Positive Impact | ||
| 1. | Household income | 182 (67.41) | 88 (32.59) |
| 2. | Education of family members | 192 (71.11) | 78 (28.89) |
| 3. | Chances of employment for family members | 205 (75.93) | 65 (24.07) |
| 4. | Overcoming financial problems | 163 (60.37) | 107 (39.63) |
| 5. | Standard of living of the family | 198 (73.33) | 72 (26.67) |
| 6. | Social and family status | 143 (52.96) | 127 (47.03) |
| 7. | Infrastructure development | 188 (69.63) | 82 (30.37) |
| 8. | Increase in land values | 192 (71.11) | 78 (28.89) |
| 9. | Medical facilities | 164 (60.74) | 106 (39.36) |
| Overall | 190 (70.37) | 80 (29.63) | |
| II | Negative Impact | ||
| 1. | Increases in agricultural prices | 187 (69.26) | 83 (30.74) |
| 2. | Land losses | 215 (79.63) | 55 (20.37) |
| 3. | Pollution related health conditions | 145 (53.70) | 125 (46.30) |
| 4. | High energy consumption | 167 (61.85) | 103 (38.15) |
| 5. | Housing problems | 149 (55.19) | 121 (44.81) |
| 6. | Attraction to urban social fabric | 72 (26.67) | 198 (73.33) |
| Overall | 196 (72.60) | 44 (16.30) |
Table text extracted from the original PDF; superscript letters are shown inline. The original table image is below.
View original table image
Logit Estimates on Urbanisation Impact Perception
The logit model was employed to study the degree and direction of the factors influencing respondents' perception on the impact of urbanisation over farming (binary), i.e., it takes the value one, if the respondent's perception is yes and takes the value zero, otherwise) and the results are presented in Table 3. It could be seen from Table 3 that the estimated model predicted 81 per cent of the reasons for the respondents' perception on the impact of urbanisation over farming. The coefficient for the variable, size of land holding was negatively significant and revealed that the odds of being perceived as impactful would decrease by 1.027 times, for every one-acre increase in the land holding. The variables, migrants in the family, occupational shift of the respondents and land loss in the households were positively significant, indicating the influence of these variables on the respondents' perception on the impact of urbanisation on farming. With regard to migrants in the family, the results revealed that for every one positive response on urbanisation, the odds of being perceived as impactful would increase by 0.127 times. Also, the odds of being perceived as impactful would increase by 0.270 times and 0.061 times, respectively, with the occupational shift of the respondents and land loss in the households.
| S. No | Variable | Coefficient | Odds ratio | P value |
|---|---|---|---|---|
| 1. | Constant | 2.375 | 1.113 | 0.074 |
| 2. | Size of the land holding (acres) | -0.739*** | 1.027 | 0.007 |
| 3. | Ratio of non-farm income to farm income (Rs.) | 1.007 | 0.319 | 0.091 |
| 4. | Migrants in the family (binary) | 1.512** | 0.127 | 0.026 |
| 5. | Occupational shift of the respondents (binary) | 0.912** | 0.270 | 0.019 |
| 6. | Land loss in the households (binary) | 1.323** | 0.061 | 0.003 |
| -2 log likelihood | 35.78 | |||
| R2 | 81 | |||
| Nagelkerke R2 | 88 |
Table text extracted from the original PDF; superscript letters are shown inline. The original table image is below.
View original table image
Conclusion
The study concludes that the urbanisation has been more pronounced in the peri-urban and urban gradients than the rural gradient, as per the census 2011 and 2001. In the same way, the results also revealed that the urbanisation has both positive and negative impacts on the sample respondents. The size of land holding was negatively influenced and the other variables, migrants in the family, occupational shift and land loss among the households were positively influenced factors on impact of urbanisation perception over farming. This might be due to the formation of urban fringes along the urban area, due to population pressure and industrialisation. From the results it is suggested to develop a balanced ruralurban policy which is the need of the hour for a smooth ruralurban transformation.
Acknowledgement
I would like to acknowledge that the study was funded by the ICSSR Doctoral Fellowship.
References
3 in the original paper- Thompson WS. Urbanization in Encyclopedia of Social Sciences, Macmillan. 1935;15:189.
- Vaidyanathan KE. Rural -Urban Distribution of Population in West Asia, Population Geography. 1981;3(1-2):96-113.
- Winfield GF. The Impact of Urbanization on Agricultural Processes, The Annals of the American Academy of Political and Social Science. 1973;405(1):65-74.