
Research article · 2023 · Full text
International Journal of Statistics and Applied MathematicsStatistical modeling of electronic waste (e-waste) generated in India
Volume 8(6S) · Pages 116–122 · DOI: 10.22271/maths.2023.v8.i6sb.1368 ↗
Research areasRecycling and Waste Management Techniques
Abstract
Author-writtenElectronic Waste (e-waste) is one of the fastest growing waste streams in the country. Growth of Information and Communication Technology sector has enhanced the usage of the electronic equipment exponentially. Developing countries are facing enormous challenges related to the generation and management of E-waste which are either internally generated or imported illegally; India is no exception to it. Electronic wastes can cause widespread environmental damage due to the use of toxic materials in the manufacture of electronic goods. Hazardous materials such as lead, mercury and hexavalent chromium in one form or the other are present in such wastes. Due to the lack of sufficient facilities for the safe management of waste in developing countries, this waste is buried, burned in the open air or dumped into surface water bodies. E-waste disposal in landfills and incinerators does permanent damage to the atmosphere by water and soil pollution and air contamination. The aquatic organisms that live in the affected water bodies are highly exposed to these toxic, bio-accumulative, and persistent contaminants. This study presents an overview of generated e-waste in coming future using statistical modeling and analysis.
Summary
Source-checkedPlain-language reading of the full paper, prepared with AI and checked against the text. Each point links to the authors' own words.
Why it matters
- Electronic waste is one of the fastest-growing waste streams in India, driven by the exponential growth of the Information and Communication Technology sector. View evidence ↗
- E-waste poses significant environmental risks because it contains hazardous materials like lead, mercury, and hexavalent chromium. View evidence ↗
- In developing countries, a lack of safe management facilities leads to e-waste being burned in the open, buried, or dumped into water bodies. View evidence ↗
The question
- The study aims to provide an overview and prediction of future e-waste generation in India using statistical modeling and analysis. View evidence ↗
What they did
- The researchers collected secondary e-waste data through a detailed literature survey of various ministry reports and government agencies. View evidence ↗
- The data was analyzed using ANOVA, trend analysis, and curve fitting tools. View evidence ↗
What they found
- India is the world's fifth largest producer of e-waste, discarding approximately 18.5 lakh tonnes annually. View evidence ↗
- Government, public, and private industrial sectors generate nearly 70% of India's e-waste, while households contribute about 15%. View evidence ↗
- Computer equipment is the primary source of e-waste in India at nearly 70%, followed by telecom/phones (12%), electrical equipment (8%), and medical equipment (7%). View evidence ↗
- Future e-waste generation is predicted to follow a second-degree polynomial parabola (y = 0.052x² + 0.752x + 2.249) with a high R² of 0.996. View evidence ↗
- The regression model was found to be statistically significant, as the significance F value (0.009955915) was below the 0.05 threshold. View evidence ↗
- Domestic production of computer hardware showed a linear increase described by the equation y = 684.2x + 18278 (R² = 0.935). View evidence ↗
What it means
- The authors conclude that India needs analyzable annual e-waste production data to effectively strategize against the e-waste problem. View evidence ↗
- The authors recommend publishing e-waste data in the public domain to increase transparency regarding waste generation, flow, and disposal methods. View evidence ↗
Visual summary
1 visualsIllustrations explain the paper; they do not show study data.
E-Waste Growth Trend
AI-generated conceptual illustration (Electronic waste (e-waste) including old smartphones, laptops, circuit boards, and monitors). It explains the idea and does not show study data.
View source evidence ↗Figures & tables
From the original paper Table 1
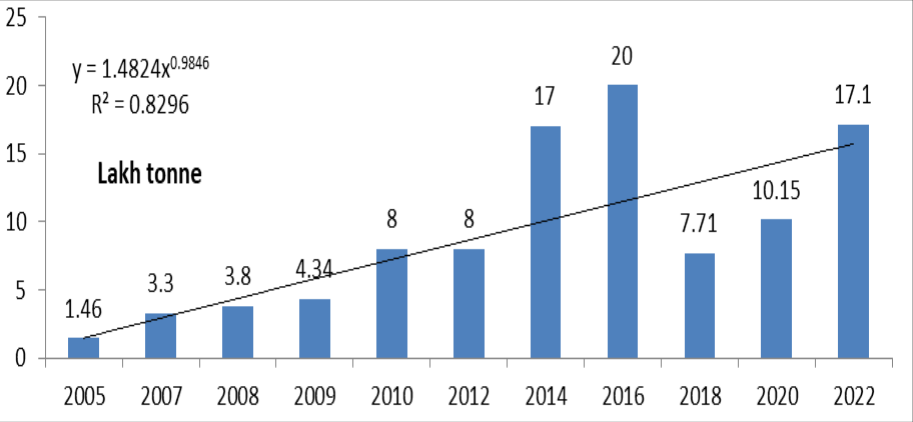 Figure 1
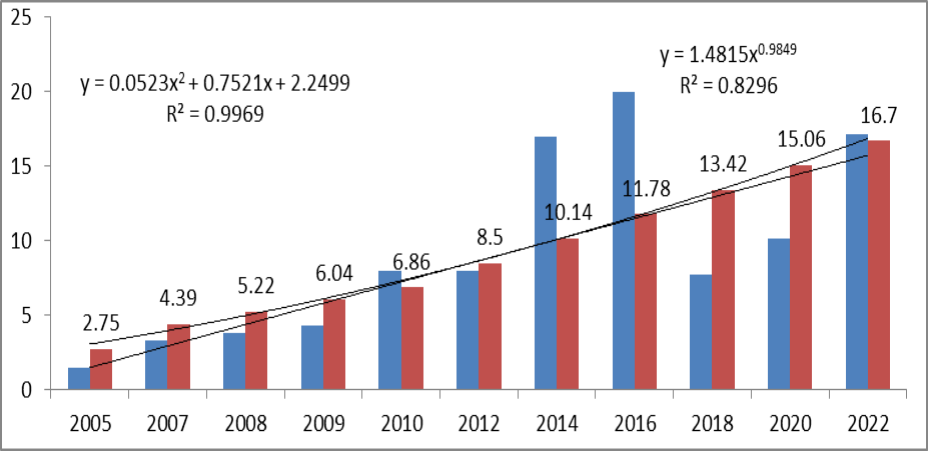 Figure 2
 Table 1
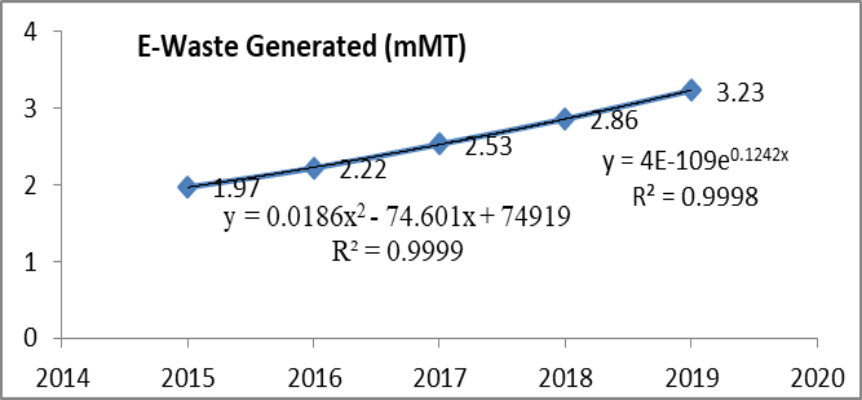 Figure 3
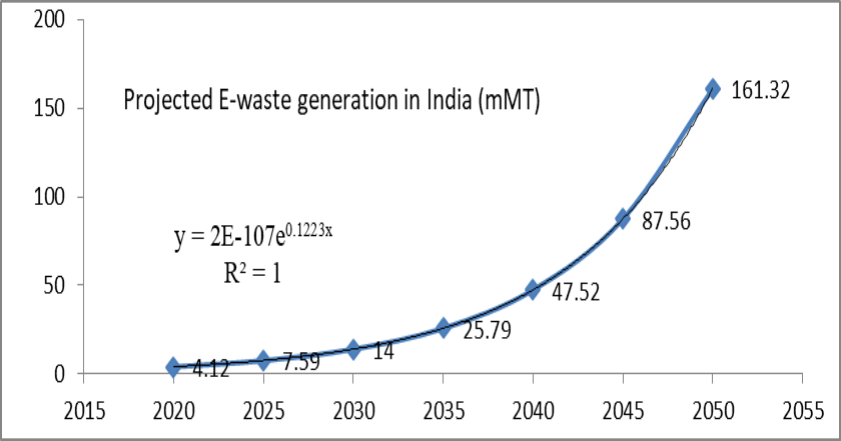 Figure 4
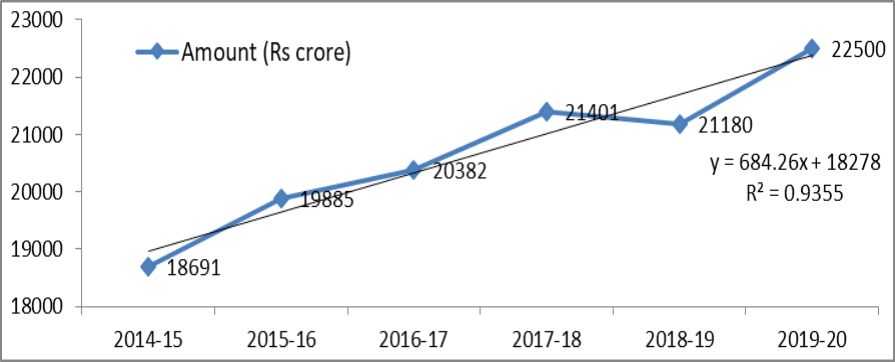 Figure 5
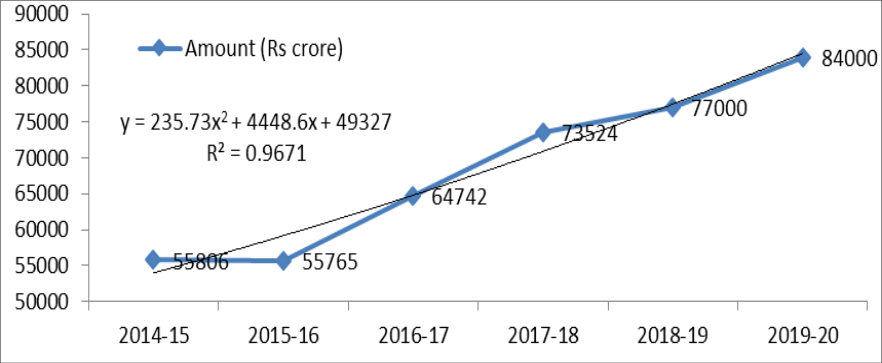 Figure 6
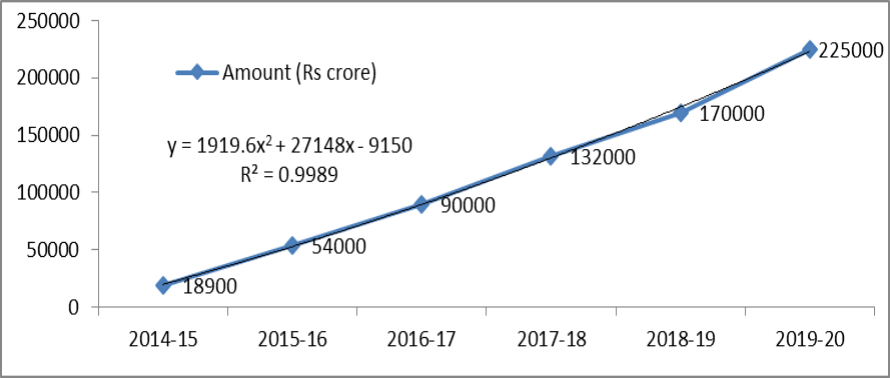 Figure 7
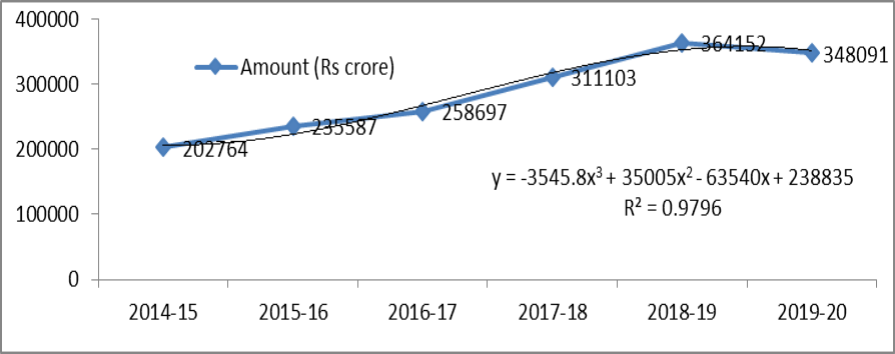 Figure 8
Introduction
E-waste or electronic waste is created when an electronic product is discarded after the end of its useful life. The rapid expansion of technology and the consumption driven society give results in the creation of a very large amount of e-waste. E-waste can be toxic, is not biodegradable and accumulates in the environment, in the soil, air, water and living things. Ewaste can cause serious environmental problems due to toxic chemicals such as lead, mercury and arsenic that pollute our soil and water and disrupt our ecosystems and our health. The toxic materials from electronic devices are released into bodies of water, groundwater, soil and air, affecting both land and sea animals. When we throw out our e-waste they wind up in landfills, causing toxic materials to seep into groundwater. When e-waste is exposed to the heat, toxic chemicals are released into the air damaging the atmosphere; this is one of the biggest environmental impacts of e-waste. Those toxic materials can then seep into the groundwater, affecting both land and sea animals. Open-air burning and acid baths being used to recover valuable materials from electronic components release toxic materials leaching into the environment. The main cause of e-waste is the rising demand for electronic products. Often, when electrical appliances break, consumers opt to purchase a replacement, more so if it is more economical than fixing the broken one. In other scenarios, the annual launch of new electronic gadgets encourages people to upgrade annually.
Current status of E-waste in India
India, has emerged as the world's second largest mobile market, is also the fifth largest producer of e-waste, discarding roughly 18.5 lakh tonnes of electronic waste each year (Lobo et. al., 2016) [16] . Telecom equipment alone accounts for 12% of the e-waste (Adhana, 2020) [5] .
According to the Central Pollution Control Board, India generated 1.71 million metric tons of e-waste as compared to the worldwide e-waste generation which stood at 59.40 million metric tons (Kumar and Kumar, 2023) [13] . It is no secret that electronic dumps contain substantial quantities of toxic elements like lithium, mercury, arsenic, barium, cadmium, cobalt, etc. When broken or unwanted electronics are dumped in landfill, toxic substances like lead and mercury can leach into soil and water. Electronics also contain valuable non-renewable resources including gold, silver, copper, platinum, aluminum and cobalt. India processed 3.4 lakh tonnes of e-waste in 2020-2021 (Patel, 2021) [20] . According to CPCB, the generation of plastic waste per year is increasing by 3% and the generation of e-waste is even higher, with waste produced totaling 7.1 lakh tonnes in 2018-19 and 10.14 lakh tonnes in 2019-20 (Khan, 2023) [12] . Every year, there is a 31% increase. In 2021-22, of the 16, 01, 155 tonnes of e-waste generated, 5, 27, 131 tonnes (32.9%) were recycled. In 2020-21, 26.33% of e-waste was processed, while in 2019-20, the figure stood at 22.07% (Gupta, 2023) [10] . The main sources of electronic waste in India are the government, public and private (industrial) sectors, which account for almost 70% of total waste generation. The contribution of individual households is relatively small at about 15%; the rest being contributed by manufacturers (Rajya Sabha, 2011) [22] . Globally, consumers generated 44.7 million metric tons of ewaste in 2016. More than 44 million tonnes of electronic and electrical waste was produced globally in 2017, over six kilograms for every person on the planet. The world produced 44.7 million tonnes of electronic waste (e-waste) in 2016 (Baldé et. al., 2017) [1] , enough to build nine great pyramids of Giza. This includes two million tonnes generated in India, which has one of the fastest growing electronics industries in the world. It is estimated that the total amount e-waste generated in 2014 was 41.8 million metric tonnes (Baldé et. al., 2014) [2] . It is forecasted to increase to 50 Mt of e-waste in 2018. According to the UN, in 2021 each person on the planet will produce on average 7.6 kg of e-waste, meaning that a massive 57.4 million tons will be generated worldwide India is now the world's third-largest source of e-waste, generating around 3.2 million tonnes annually (2019), behind only China (10 million tonnes) and the US (6.9 million tonnes) in 2021 (Geneva Environment Network, 2023) [7] . In India, Maharashtra produces maximum e-waste in the country followed by Tamil Nadu, Andhra Pradesh, Uttar Pradesh, West Bengal, Delhi, Karnataka, Gujarat, Madhya Pradesh and Punjab. Similarly Mumbai ranks first in generating e-waste followed by Delhi, Bangalore, Chennai, Kolkata, Ahmadabad, Hyderabad, Pune, Surat and Nagpur. Mumbai produces 96,000 metric tonnes (MT) every year (Rajya Sabha, 2011) [22] . Urban India generates around 62 million tons of municipal solid waste every year. Mumbai and Delhi generate about 11,000 and 8,700 tonnes of solid waste per day, respectively (CPHEEO, 2020) [4] . Study done by KPMG and ASSOCHAM, stated that computer equipment stands for almost 70% of e-waste in India, and followed by telecom/phones (12%), electrical equipment (8%) and medical equipment (7%) (Patel & Balachandran, 2016) [19] . China is the largest importer and producer of electronic waste worldwide, generating more than 10 million metric tons (over 70% of all global e-waste) worth in 2019 (Vanessa et. al, 2020) [25] . This was followed by the United States where roughly seven million metric tons was produced. Ministry of Environment, Forest and Climate Change indicates that a staggering 10, 74, 024 tonnes (67%) of e-waste remained unprocessed. India ranks 177 amongst 180 countries and is amongst the bottom five countries on the Environmental Performance Index 2018, as per a report released at the World Economic Forum 2018 (Gupta, 2023) [10] . This was linked to poor performance in the environment health policy and deaths due to air pollution categories. India's share in global hardware electronics production is about 3%. The share of domestic electronics production in India's GDP is 2.3%. India's share in global electronics manufacturing has grown from 1.3% in 2012 to 3.6% in 2020 (NEP, 2020). The domestic production of electronic items has increased substantially at a Compound Annual Growth Rate (CAGR) of 17%. Production profile for electronics in India (Annual Report MeitY, 2019-20, IBEF, 2023) [11] for electronic commodities like computer hardware, consumer electronics and mobile phones are given.
Literature Survey/Review
Electronic industry is the fastest growing industry. It contributes a lot in the economy of a country and fuels the market with new and latest products. In India, the volume of e-waste generated was 146,000 tonnes per year (Borthakur and Sinha 2013 [3] ; Kumar & Karishma, 2016 [14] ; Pathak, 2022) [21] . Gupta and Nikam (2009) estimated that approximately 80% of old electronic equipment and their parts are lying idle, discarded and not at all in use. The uncertainty of how to manage such a huge unused electronic waste has worsened the problem. Tyagi et al. (2015) [24] reported that by the end of 2016, 93.5 million tons of e-waste will be generated globally which was 41.5 million tons in 2011. In India the formalization process of handling the ewaste is in transition India is capable of handling only 4% of the generated e-waste. Sakshi Gupta (2020) stated that Ewaste generation in 2005 was 1.47 lakh metric tons while in 2016 it was 20 lakh metric tons and it is growing 21% annually. Sixty-five cities in India generate more than 60% of the total e-waste generated in India. Ten states generate 70% of the total e-waste generated in India (Naik & Khan, 2020) [18] . Electronic Waste Management in India identified that computer equipment account for almost 70% of e-waste, followed by telecommunication equipment phones (12%), electrical equipment (8%) and medical equipment (7%) with remaining from household e-waste (Manish & Chakraborty, 2019) [17] . The study reveals that 35 million tone of e waste to be produced by 2021-22. E-waste contains 51 types of hazardous materials which is harmful to humans & environment (Kumar, 2018) [15] . In India only 4.5 lakes tons of e-waste were recycled every year which is a high gap between waste recycled and produced. This is effecting adversely to the climate and environment. E-waste collection, transportation, processing, and recycling are dominated by the informal sector. Due to low awareness and sensitization e-waste is thrown along with garbage which is collected and segregated by rag pickers. E-Waste contains reusable and precious material.
The Environmental Protection Agency estimates that only 15-20% of e-waste is recycled, the rest of these electronics go directly into landfills and incinerators. The recyclers use old and hazardous technologies and equipment to recycle/treat the ewaste. In India, the informal recycling sector employs mostly unskilled migrant labor and those from marginalized groups. Most people involved in informal recycling are the urban poor with low literacy levels, and hence have very little awareness regarding the hazards of E-waste and the recycling processes (Kumar & Karishma, 2016) [14] .
Methodology
Detail and deep literature survey has been done for collection of secondary E-waste data. For literature survey different government agencies and ministry reports has been selected. For data analysis, ANOVA, curve fitting and trend analysis tools has been applied.
Data Analysis and Discussion
The paper is based on data collected through literature survey. The literature survey covers newspaper articles, magazine, e-books and e-papers. The graph of e-waste data collected through literature survey is given below in form of graph. The x and y axis of the graph shows year and generated e-waste respectively. Looking at the graph, it is clear that maximum ewaste has been generated in 2014 and 2016. Analysis of data generated between 2005 to 2022 shows that the trend of generated data holds power equation, which is y = 1.482x 0.984 , with R² = 0.829 (Figure 1). The various errors SSE, MSE estimated are well within the directed limit for the confidence bounds of the 95%. The graph given below shows the best fit curves at 95% prediction bound. On the basis of power equation, when trend analysis was done in e-waste data, the trend of predicted e-waste (or predicted y) to be generated in future was found to be polynomial (Second degree parabola y = 0.052x 2 + 0.752x + 2.249 with R² = 0.996 within the directed limit for the confidence bounds of the 95% -Figure 2). The ANOVA analysis shows that the p value of the model is found 0.01024805. The p-value is used in correlation and regression analysis, which helps us identify whether the result is feasible and which data set from the result to work with. The p-values for the coefficients indicate whether the dependent variable is statistically significant. When the pvalue is less than our significance level, we can reject the null hypothesis. Since this value is less than 0.05, we can conclude that the regression model as a whole is statistically significant. F is the F statistic or F-test for the null hypothesis. It is used to test the overall significance of the model. Significance F is the p-value associated with the overall F statistic. It tells us whether or not the regression model as a whole is statistically significant. The significance F is computed from the F value.
Significance F is the P-value of F. Since significance F (0.009955915) is less than 0.05 (5%), it means our model is all right.
Conclusion
The generation of e-waste is a function of the amount of EEE used and discarded by citizens in a particular year. As the social strata changes, the consumption patterns, amount of consumption and rate of generation changes as well. MeitY conveyed to the Ministry of Environment, Forest and Climate Change (MoEF & CC) that only a national-level inventory of e-waste generation can be prepared. We need data that can be analyzed and interpreted to arrive at an estimate of electronic waste produced annually. This will help us strategize to tackle the menace of e-waste. Publishing data in the public domain will also create transparency with respect to generation, flow channels and methods of handling and disposal of potentially hazardous e-waste material. It is a positive sign that we want to position ourselves as a global manufacturing hub and it only increases the need for a robust data management system for handling of e-waste.
Figures and tables from the paper
| ANOVA | — | — | Multiple R | 0.540332948 |
|---|---|---|---|---|
| T Stat | P-Value | F | 10.579389 | |
| Intercept | -3.234528327 | 0.01024805 | R Square | 0.540332948 |
| X Variable 1 | 3.252597264 | 0.00995591 | Significance F | 0.009955915 |
Table text extracted from the original PDF; superscript letters are shown inline. The original table image is below.
View original table image
References
18 in the original paper- Baldé CP, Forti V, Gray V, Kuehr R, Stegmann P. The Global E-waste Monitor 2017, Executive SummaryQuantities, Flows and Resources. United Nations University (UNU), International Telecommunication Union (ITU) & International Solid Waste Association (ISWA), Bonn/Geneva/Vienna; c2017.
- Baldé CP, Wang F, Kuehr R, Huisman J . The Global Ewaste Monitor, Quantities Flows and resources. United Nations University Institute for the Advanced Study of Sustainability (UNU-IAS); c2014. https://i.unu.edu/media/unu.edu/news/52624/UNU1stGlobal-E-Waste-Monitor-2014-small.pdf
- Borthakur A, Sinha K. Generation of Electronic Waste in India: Current Scenario, Dilemmas and Stakeholders. African Journal of Env Sci and Tech. 2013;7(9):899-910.
- Deepak Kumar Adhana. E-Waste Management in India: A Study of Current Scenario. International Journal of Management, Technology and Engineering (January 2019). 2020;9(1):2791-2803.
- Pratap Chandran R, Anusha Vijayan S, Silpa S, Sruthy P, Sreelekshmi S. Isolation of pathogens from leaf, root and rhizosphere water samples of aquatic weeds, Eichhornia crassipes and Pistia stratiotes present in the backwaters of YMCA canal, Alappuzha, Kerala, India. Int. J Biol. Sci. 2021;3(2):24-29. DOI: 10.33545/26649926.2021.v3.i2a.131
- Gupta R, Sangita, Kaur V. Electronic Waste: A Case Study. Research Journal of Chemical Sciences. ISSN 2231-606X. 2011;1(9):49-56,
- Gupta S. Future of E-Waste Management: Challenges and Opportunities. International Journal of Advanced Research in Science, Communication and Technology (IJARSCT). 2020 Nov;11:2.
- Kumar A, Kumar M. Efficiency Enhancements Technique in Recycling Process of E-Waste, Technical Report, May 2023. Affiliation: Swami Shraddhanand College, University of Delhi; c2023. https://www.researchgate.net/publication/370608183_EF ficiency_enhancements_technique_in_recycling_process _of_e-waste
- Kumar R, Karishma. Current Scenario of e-waste management in India: Issues and strategies International Journal of Scientific and Research Publications. 2016 Jan;6:1.
- Kumar P. Electronic waste-hazards, management and available green technologies for remediation-a review. International Research Journal Environmental Sciences. 2018;7:57-68.
- Manish MA, Chakraborty DP. E-Waste Management in India: Challenges and Opportunities. 2019;12(8):22-28. https://www.teriin.org/article/e-waste-management-indiachallenges-and-opportunities
- Naik NS, Khan A. E-Waste Management with respect to Indian Scenario. International Journal of Engineering Research & Technology (IJERT). 2020;9:11. http://www.ijert.org ISSN: 2278-0181
- Patel B, Balachandran V. E-waste Management: Increasing Concern in India. International Journal of Research in Economics and Social Sciences (IJRESS). 2016 Nov;6(11):180-189.
- Pathak P. E-Waste. International Journal of Advanced Research in Science, Communication and Technology (IJARSCT). 2022 Feb;2:2, ISSN (Online) 2581-9429. https://ijarsct.co.in/Paper2746.pdf
- Rajya S. E-waste in India. Research Unit (Larrdis), Rajya Sabha Secretariat, New Delhi; c2011 Jun. URL: https://greene.gov.in/wp-content/uploads/2018/01/ewaste_in_india-Document.pdf
- Tyagi N, Baberwal SK, Passi N. E-Waste: Challenges and its Management, DU Journal of Undergraduate Research and Innovation. 2015;1(3):108-114.
- Vanessa F, Cornelis PB, Ruediger K, Garam B. The Global E-waste Monitor 2020, Quantities, flows and the circular economy potential; c2020. https://www.itu.int/en/ITUD/Environment/Documents/To olbox/GEM_2020_def.pdf
- Garg Ritika, Dang Shweta, Gauba Pammi. E-waste: A Concern. VSRD International Journal of Bio-Technology & Pharmaceutical Sciences. 2022 Jul;9:Special Issue.
Cited by 4
From OpenAlex, OpenCitations and reference lists read by Scinovex
- Waste-derived carbon nanomaterials for electrochemical applications: toward a circular and sustainable future ↗
Shruthi Venkataraman, Ashok Kumar Sundramoorthy · RSC Advances · 2026
The unparalleled global surge in waste generation necessitates a revolutionary shift toward the circular economy, simultaneously addressing resource depletion and environmental remediation. This review highlights the critical role of various waste materials, such as plastic waste, industrial waste, and agricultural waste, used for the synthesis of nanomaterials like carbon nanotubes, graphene, and carbon quantum dots, as versatile, high-performance precursors for…
❝ 19PDF - Performance of waste rubber fiber and e-waste fiber in the realization of GGBFS-based self-compacting geopolymer concrete ↗
Soumyaranjan Panda, Saubhagya Kumar Panigrahi · Journal of Environmental Management · 2025
❝ 8 - Review of Reagent-Free Electronic Waste Recycling: Technology, Energy, Materials and Spatial Effects ↗
N. A. Kulenova, Marzhan Anuarbekovna Sadenova, Stanislav Boldyryev · Recycling · 2026
The rapid increase in e-waste has become a significant global concern, influenced by swift technological advancements, shorter product lifecycles, and rising consumer demand. This situation leads to considerable environmental and health hazards, primarily due to the presence of toxic materials, energy demands, and the inadvertent loss of valuable resources when waste is not adequately managed. This review synthesises contemporary theories…
❝ 5PDF - Blockchain and Digital Solutions for E-Waste Management ↗
S. Karthikeyan, Kantubhuktha Surya Naveen, Amit Joshi, Samadhan Bundhe, Prasanthi Gottumukkala, D. Sridhar et al. · IGI Global eBooks · 2026
E-waste is developing rapidly due to the exponential rise of electronic gadgets, causing global environmental, economic, and health challenges. In conventional e-waste processing, inefficiency, lack of transparency, and insufficient regulatory enforcement cause inappropriate recycling, informal sector exploitation, and resource loss. Blockchain can make e-waste management secure, transparent, and traceable throughout its existence. Blockchain, IoT, AI, and digital tracking platforms enable…
❝ 0