
Research article · 2023 · Full text
International Journal of Statistics and Applied MathematicsAnalysis on area, production, productivity and export competitiveness of basmati rice in India
Volume 8(6S) · Pages 06–09 · DOI: 10.22271/maths.2023.v8.i6sa.1346 ↗
Research areasAgricultural Economics and Practices
Abstract
Author-writtenThe nature of data used for study is entirely based on secondary source of data form 1988-89 to 2017-18. It is divided in to two Periods, Period - I (1988-89 to 2002-03), Period - II (2003-04 to 2017-18) and overall Period (1988-89 to 2017-18).The percent CGR of total national export in the Period - I was 19 percent and in Period - II area was 15.09 percent. The percent CGR of total agricultural export in the Period - I was 16.97 percent and in Period - II area was 16.46 percent. The percent CGR of Total Basmati Export in the Period - I was 16.96 percent and in Period - II area was 22.63 percent. The CGR of area of basmati rice in the Period - I was 5.76 percent and in Period - II area was 7.67 percent. The percent CGR of Production of basmati rice in the Period - I was 6.04 percent and in Period - II area was 9.01 percent. The percent CGR of Productivity of basmati rice in the Period - I was 0.25 percent and in Period - II area was 1.24 percent. The CGR of export quantity of basmati rice in the Period - I was 8.72 percent and in Period - II area was 13.64 percent. The percent CGR export value of basmati rice in the Period - I was 16.96 percent and in Period - II area was 22.63 percent. The percent CGR of unit export value of basmati rice in the Period - I was 7.58 percent and in Period - II area was 7.91 percent. NPC value for Overall period is 0.67 which states that market is moderately competitive for export competitiveness of Basmati Rice. When the analysis was done using two different periods i.e. Period - I and Period - II average value of NPC ratio was 0.849 and 0.491, respectively which indicates Period - I was moderately competitive and Period - II was less competitive.
Summary
Source-checkedPlain-language reading of the full paper, prepared with AI and checked against the text. Each point links to the authors' own words.
Why it matters
- Rice is a critical global crop, providing approximately 20% of the average calorie intake worldwide and utilizing 11% of agricultural land. View evidence ↗
- Basmati rice is a high-quality product from the Himalayan region of India, characterized by a unique aroma and quality, making it a key export item. View evidence ↗
- India is a major rice exporter; in 2018-19, basmati rice accounted for 4.4 million tons of the total 11.9 million tons of rice exported. View evidence ↗
The question
- The study aims to estimate the growth in area, production, and productivity of basmati rice, as well as to analyze its export competitiveness. View evidence ↗
What they did
- The research utilized secondary data spanning from 1988-89 to 2017-18. View evidence ↗
- The analysis was divided into two distinct timeframes: Period I (1988-89 to 2002-03) and Period II (2003-04 to 2017-18), alongside an overall period. View evidence ↗
- Compound growth rates (CGR) for area, production, productivity, and export metrics were estimated using an exponential growth function. View evidence ↗
- Export competitiveness was measured using the Nominal Protection Coefficient (NPC), calculated as the ratio of domestic price to the world reference price. View evidence ↗
What they found
- The area used for basmati rice grew at a compound rate of 5.76% in Period I and 7.67% in Period II, with an overall growth rate of 5.45%. View evidence ↗
- Basmati rice production increased by 6.04% in Period I and 9.01% in Period II, resulting in an overall compound growth rate of 9.40%. View evidence ↗
- Productivity growth was low in Period I (0.25%) and increased to 1.24% in Period II, with an overall growth rate of 3.75%. View evidence ↗
- The quantity of basmati rice exported grew by 8.72% in Period I and 13.64% in Period II, with an overall growth rate of 11.03%. View evidence ↗
- The export value of basmati rice showed strong growth, increasing by 16.96% in Period I and 22.63% in Period II, for an overall rate of 17.65%. View evidence ↗
- The unit export value grew by 7.58% in Period I and 7.91% in Period II, with an overall growth rate of 5.96%. View evidence ↗
- The overall NPC value of 0.67 indicates that the basmati rice market is moderately competitive for export. View evidence ↗
- When split by period, the NPC ratio was 0.849 in Period I (moderately competitive) and 0.491 in Period II (less competitive). View evidence ↗
What it means
- The authors conclude that India's total export of basmati rice experienced consistent year-to-year compound growth from 1988-89 to 2017-18. View evidence ↗
Visual summary
3 visualsIllustrations explain the paper; charts are replotted from the paper's own table values.
Research Framework
AI-generated conceptual illustration (Basmati rice plants and grains in an Indian agricultural setting). It explains the idea and does not show study data.
View source evidence ↗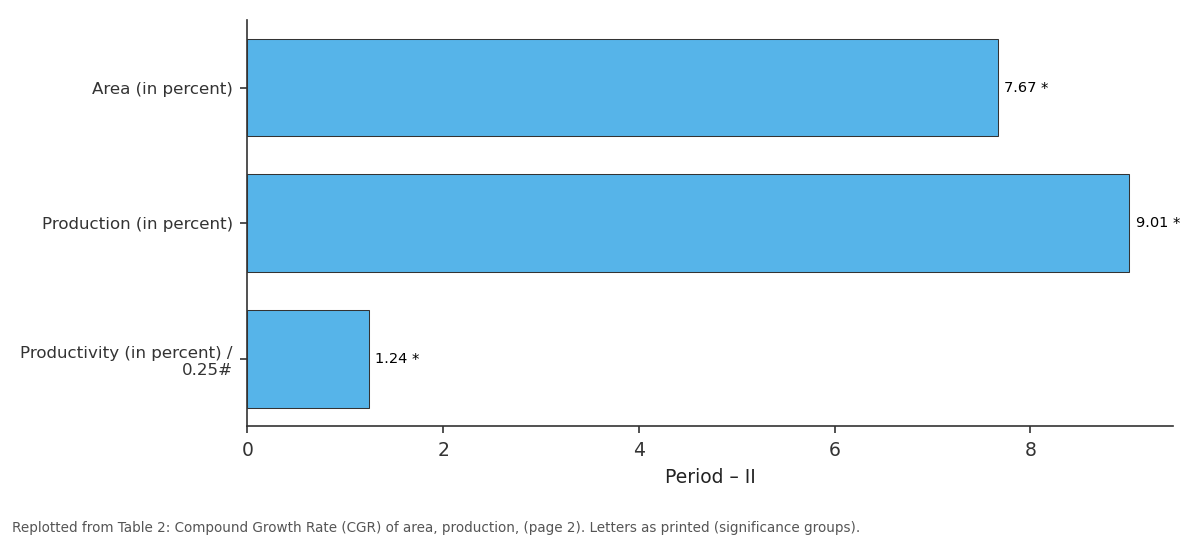
Period – II: Area (in percent) vs Production (in percent) vs Productivity (in...
Replotted from Table 2 (page 2) of the original paper. Every bar is the paper's own table value.
View source evidence ↗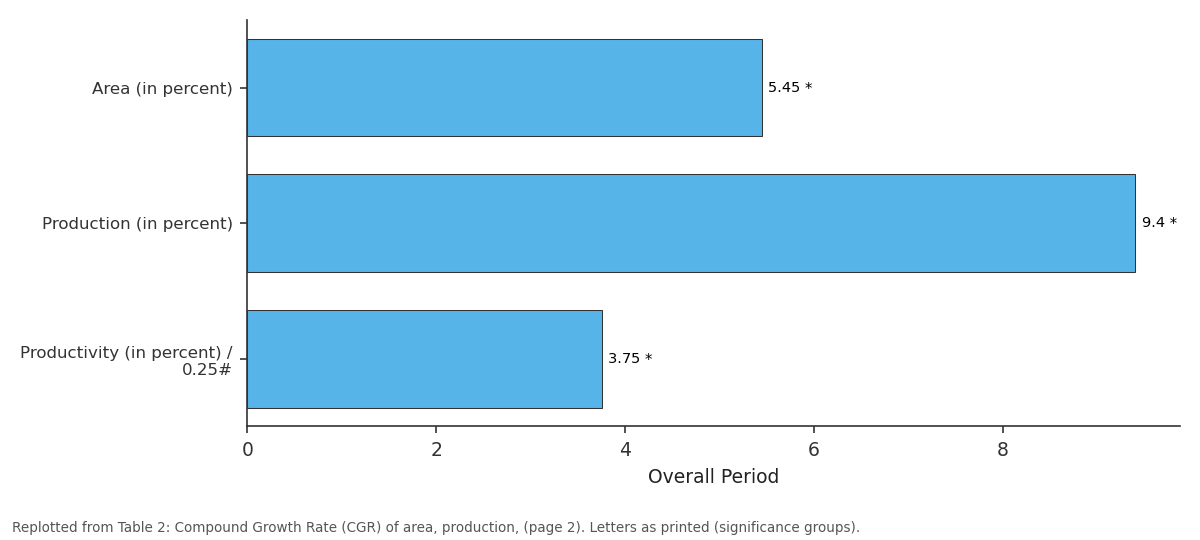
Overall Period: Area (in percent) vs Production (in percent) vs Productivity (in...
Replotted from Table 2 (page 2) of the original paper. Every bar is the paper's own table value.
View source evidence ↗Figures & tables
From the original paper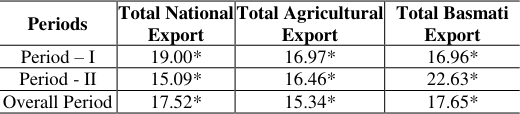 Table 1
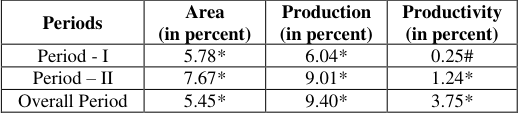 Table 2
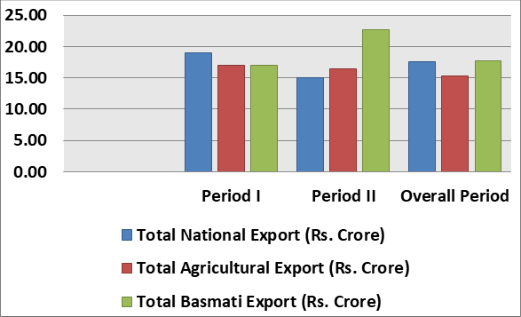 Figure 1
 Table 4
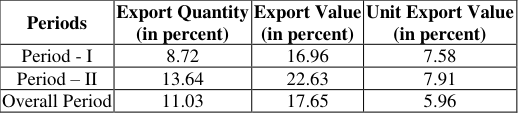 Table 3
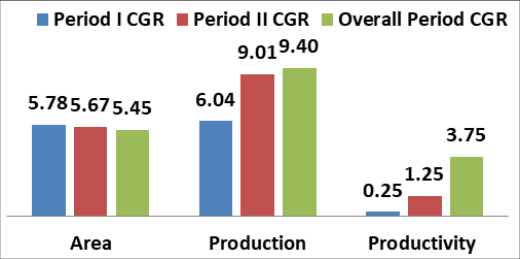 Figure 2
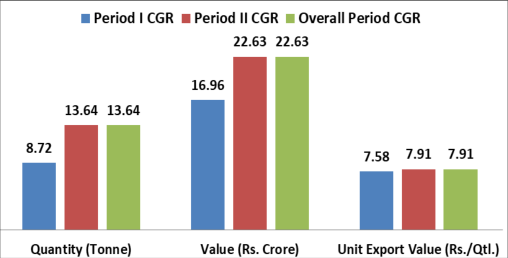 Figure 3
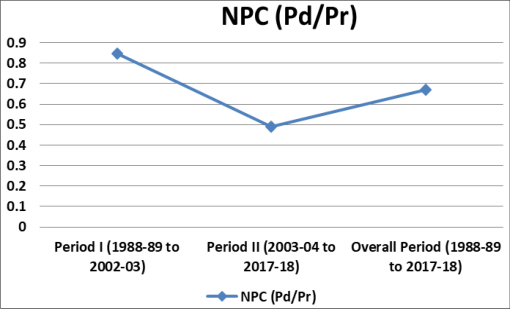 Figure 4
Introduction
Rice (Oryza sativa) provides about 20% of the world's average calorie intake and accounts for 11% of the world's agricultural land. In 2017, world rice production was approximately 984 million tons (FAOSTAT 2019). The theme "Rice is life" shows the importance of rice as an essential food and source of remuneration, especially in many non-industrial countries (Thanh and Singh 2015) [10]. Rice accounts for about 44% of the country's total food utilization and 23% of India's total planting area.
In India and the world, the production of rice has a huge impact on food and nutrition security (Mishra et al., 2014) [11]. Rice is undoubtedly affected by the development of the industry, and it is an important food crop. Basmati Paddy (Basmati Paddy) is a novel product of the Himalayan Indian-Indian aircraft, with unparalleled quality and smell, making it an important food item in foods sent from India. India is one of the largest exporters of basmati rice (basmati rice and non- basmati rice).
The annual export volume of basmati rice is about 10-13 million tons. In 2018-19 (April to March), India sent 11.9 million tons of rice, of which the trade volume of basmati rice was 4.4 million tons, and the export volume of non-basmati rice was 7.5 million tons. The proportion of basmati rice exported in absolute rice has been fluctuating in the range of 30% to 40%, while non-basmati rice accounts for 60% to 70% of the rice trade. India has been trading world rice (Basmati rice) to approximately 132 countries around the world.
The main ticket price objections for Indian rice are Iran, Saudi Arabia, the UAE and Iraq. Maths 2023; SP-8(6): 06-09 https://www.mathsjournal.com Akash Tiwari Ph.D. Scholar, Department of Agricultural Economics, Raipur, Chhattisgarh, India Dr. VK Choudhary Indira Gandhi Krishi Vishwavidyalaya, Raipur, Chhattisgarh, India Nileema Pandey Department of Floriculture and Landscape, IGKV Raipur, Chhattisgarh, India Suryakant Chubey Department of Agricultural Extension, IGKV Raipur, Chhattisgarh, India Akash Tiwari Ph.D.
Scholar, Department of Agricultural Economics, Raipur, Chhattisgarh, India https://www.mathsjournal.com Objectives 1. To estimate growth in area, production and productivity The percent CGR of total agricultural export in the overall Period was 15.34 percent. The percent CGR of Total Basmati Export in the Period - I was 16.96 percent and in Period - II area was 22.63 percent. The percent CGR of Total Basmati Export in the overall Period was 17.65 percent.
Table 1: Compound Growth Rate (CGR) of Total National, Agricultural and Basmati Rice export Total Agricultural Total Basmati Periods Total National Export Export Export Period – I 19.00* 16.97* 16.96* Period - II 15.09* 16.46* 22.63* Overall Period 17.52* 15.34* 17.65* Note: * - denotes significant at 5% level Fig 1: Compound Growth Rate (CGR) of Total National, and export of Basmati Rice. 2. To study the export competitiveness of Basmati Rice.
| Periods | Total National Export | Total Agricultural Export | Total Basmati Export |
|---|---|---|---|
| Period – I | 19.00* | 16.97* | 16.96* |
| Period - II | 15.09* | 16.46* | 22.63* |
| Overall Period | 17.52* | 15.34* | 17.65* |
Table text extracted from the original PDF; superscript letters are shown inline. The original table image is below.
View original table image
Materials And Methods
This study was based on the secondary data. The data were collected from various government publications like, Ministry of Commerce & Industry”- Government of India, Agri. Indiastat, DAC & FW, Directorate of Economics & Statistics, FAO (Food and Agricultural Organization) Stat, APEDA (Agricultural and Process Food Products Export Development Authority) and Agmarknet. Growth rates analysis To arrive at normal years, a simple average of estimate for thirty years from 1988-89 to 2017-18 have been taken.
The normal year was considered as base year for estimating growth rates. By taking time as the independent variables and the area, production, productivity and export volume and their respective values of the Basmati Rice as the dependent variables, the compound growth rates were estimated by using following exponential growth function. Y = a bt Where, Y = Area / Production / Productivity / Export quantity / export value / Unit value of Basmati Rice production. t = Time variable b = Regression coefficient a = Intercept. Nominal protection coefficient (NPC) NPC will be computed to determine the extent of competitive advantage enjoyed by the commodity in the context of free trade.
The coefficient shed light on whether a country has comparative advantage in the export of that commodity in the free trade scenario or not. The NPC is defined as the ratio of the domestic price to the world reference price of the commodity under consideration. Symbolically, Agricultural and Basmati Rice export Compound growth rate (CGR) of area, production and productivity of Basmati rice in India: For the computation of Compound Growth Rate (CGR) of area, production and productivity of basmati rice in India data was collected from year 1988-89 to 2017-18. It is divided in to three Periods, Period - I (988-89 to 2002-03), Period - II (2003-04 to 2017- 18) and overall Period (1988-89 to 2017-18).
The CGR of area of basmati rice in the Period - I was 5.76 percent and in Period - II area was 7.67 percent. The percent CGR of area of basmati rice in the overall Period was 5.45 percent. All the above CGR are significant at 5% level of significance. The percent CGR of Production of basmati rice in the Period - I was 6.04 percent and in Period - II area was 9.01 percent.
The percent CGR of production of basmati rice in the overall Period was 9.40 percent. The CGR percent in basmati rice is significant at 5% level of significance. The percent CGR of Productivity of basmati rice in the Period - I was 0.25 percent and in Period - II area was 1.24 percent. The percent CGR of productivity of basmati rice in the overall Period was 3.75 percent.
Productivity of Period - I is non - significant at 5% level of significance and the Period - II and Overall Period both are significant at 5% level of significance. Table 2: Compound Growth Rate (CGR) of area, production, productivity Basmati Rice in India Productivity Periods Area (in percent) Production (in percent) NPC = Pd Pb Where, Pd= Domestic Price of Commodity Pb= World reference price or border price of the commodity
Results And Discussion
Compound Growth Rate (CGR) of Total National, Agricultural and Basmati Rice export It is observed from the table 1 that the compound growth rate (CGR) in India’s total export of basmati rice were year to year from 1988-89 to 2017-18. It is divided in to two Periods, Period - I (1988-89 to 2002-03), Period - II (2003-04 to 2017- 18) and overall Period (1988-89 to 2017-18). The percent CGR of total national export in the Period - I was 19 percent and in Period - II area was 15.09 percent. The percent CGR of total national export in the overall Period was 17.52 percent.
The percent CGR of total agricultural export in the Period - I was 16.97 percent and in Period - II area was 16.46 percent. (in percent) Period - I 5.78* 6.04* 0.25# Period – II 7.67* 9.01* 1.24* Overall Period 5.45* 9.40* 3.75* Note: * - denotes significant at 5% level https://www.mathsjournal.com competitive for export competitiveness of Basmati Rice. When the analysis was done using two different periods i.e. Period - I and Period - II average value of NPC ratio was 0.849 and 0.491, respectively which indicates Period - I was moderately competitive and Period - II was less competitive. Table 4: The export competitiveness of Basmati Rice Sr.
| Sr. No. | Particulars | NPC (Pd/Pr) |
|---|---|---|
| 1 | Period I (1988-89 to 2002-03) | 0.849 |
| 2 | Period II (2003-04 to 2017-18) | 0.491 |
| 3 | Overall Period (1988-89 to 2017-18) | 0.67 |
Table text extracted from the original PDF; superscript letters are shown inline. The original table image is below.
View original table image
No. Particulars NPC (Pd/Pr) 1 Period I (1988-89 to 2002-03) 0.849 2 Period II (2003-04 to 2017-18) 0.491 3 Overall Period (1988-89 to 2017-18) 0.67 Fig 2: Compound Growth Rate (CGR) of area, production, productivity Basmati Rice in India Compound growth rate (CGR) of export quantity, export value and unit value of basmati export The CGR of export quantity of basmati rice in the Period - I was 8.72 percent and in Period - II area was 13.64 percent. The percent CGR of export quantity of basmati rice in the overall Period was 11.03 percent. All the above CGR are significant at 5% level of significance.
The percent CGR export value of basmati rice in the Period - I was 16.96 percent and in Period - II area was 22.63 percent. The percent CGR of export value of basmati rice in the overall Period was 17.65 percent. The CGR percent for export value of basmati rice is significant at 5% level of significance. The percent CGR of unit export value of basmati rice in the Period - I was 7.58 percent and in Period - II area was 7.91 percent.
The percent CGR of unit export value of basmati rice in the overall Period was 5.96 percent. Unit export value for all the Period significant at 5% level of significance. Table 3: Compound Growth Rate (CGR) of export quantity, export value and unit value Basmati Rice in India Export Value Unit Export Value Periods Export Quantity (in percent) (in percent) (in percent) Period - I 8.72 16.96 7.58 Period – II 13.64 22.63 7.91 Overall Period 11.03 17.65 5.96 Fig 3: Compound Growth Rate (CGR) of export quantity, export value and unit value Basmati Rice in India The export competitiveness of basmati rice Analysis of export competitiveness was analyzed by using nominal protection co-efficient. The competitiveness depends on the NPC ratio.
When the ratio of NPC is less than 0.5 then the market is highly competitive, when the ratio of NPC is in between 0.5 to 1, the market is moderately competitive and when ratio of NPC is greater than one, then market is said to non-competitive. It is observed from the table is that NPC value for Overall period is 0.67 which states that market is moderately Fig 4: Graphical representation of NPC
Conclusion
The compound growth rates (CGR) in India’s total export of basmati rice were year to year from 1988-89 to 2017-18. It is divided in to two Periods, Period - I (1988-89 to 2002-03), Period - II (2003-04 to 2017-18) and overall Period (1988-89 to 2017-18).The percent CGR of total national export in the Period - I was 19 percent and in Period - II area was 15.09 percent. The percent CGR of total national export in the overall Period was 17.52 percent. The percent CGR of total agricultural export in the Period - I was 16.97 percent and in Period - II area was 16.46 percent.
The percent CGR of total agricultural export in the overall Period was 15.34 percent. The percent CGR of Total Basmati Export in the Period - I was 16.96 percent and in Period - II area was 22.63 percent. The percent CGR of Total Basmati Export in the overall Period was 17.65 percent. The CGR of area of basmati rice in the Period - I was 5.76 percent and in Period - II area was 7.67 percent.
The percent CGR of area of basmati rice in the overall Period was 5.45 percent. The percent CGR of Production of basmati rice in the Period - I was 6.04 percent and in Period - II area was 9.01 percent. The percent CGR of production of basmati rice in the overall Period was 9.40 percent. The percent CGR of Productivity of basmati rice in the Period - I was 0.25 percent and in Period - II area was 1.24 percent.
The percent CGR of productivity of basmati rice in the overall Period was 3.75 percent. The CGR of export quantity of basmati rice in the Period - I was 8.72 percent and in Period - II area was 13.64 percent. The percent CGR of export quantity of basmati rice in the overall Period was 11.03 percent. The percent CGR export value of basmati rice in the Period - I was 16.96 percent and in Period - II area was 22.63 percent.
The percent CGR of export value of basmati rice in the overall Period was 17.65 percent. The percent CGR of unit export value of basmati rice in the Period - I was 7.58 percent and in Period - II area was 7.91 percent. The percent CGR of unit export value of basmati rice in the overall Period was 5.96 percent. https://www.mathsjournal.com
References
20 in the original paper- Adhikari A, Sekhon MK, Kaur M. Export of Rice from Exports from Tamil Nadu Ports. Arthshastra: Indian Journal of Economics and Research. 2016;5(4):11-19. India: Performance and Determinants, Agricultural Economics Research Review. 2016;29(1):135-150.
- Ajjan N, Vaseeharan SS, Ranaganathan C, Raveendaran N. An economic analysis of export performance of senna and periwinkle in India. Indian Journal of Agricultural Economics. 1998;(1 & 2):88-99.
- Buckewell AE, Shucksmith DM, Young DA. Structural projections of the Scottish dairy industry using micro and macro Markov transition matrices. Journal of Agricultural Economics. 1983;34(1):57-68.
- Chahal HS. Production and export potential of basmati rice in Indian, Punjab. Hry. Eco. Jr. 2004;24(1-2):102- 105.
- Dutta SK. India's trade prospects for rice. In: Chand, R. and Hague, T. Vision of India's rice trade, NCAP, New Delhi; c1996. p. 14-35.
- GOI (Government of India) Price policy for kharif crops- The marketing season 2012-13. Commission for Agricultural Costs and Prices, Ministry of Agriculture, New Delhi; c2012b.
- GoI (Government of India) Agricultural Statistics at a Glance 2013. Ministry of Agricultural, New Delhi; c2013a.
- GoI (Government of India) Agricultural and Processed Food Products Export Development Authority (APEDA). Ministry of Commerce and Industry, New Delhi; c2013b. Retrieved from http://agriexchange.apeda.gov.in.
- Joshi PV, Milind B, Bhujbal, Belanekar SB. Trends in area, production, productivity and export of rice from India. Int. Res. J of Agri. Eco. and Statstics. 2012;3(1):99-105.
- Joshi D, Singh HP, Gurung B. Stability Analysis of Indian Spices Export-A Markov Chain Approach. Economic Affairs. 2015;60(2):257-262.
- Leelavathi C, Reddy VK, Naidu B, Mishra, et al. An Econometric Analysis of Agricultural Trade in Rice Crop of Andhra Pradesh. Journal of International Academic Research for Multidisciplinary Impact Factor. 2014;2(5):597-608
- Mellor CJ. An application and extension of the Markov Chain model to cereal production. J of Agril. Econ. 1984;35(2):203-218.
- Nethrayini KR, Vinod R, Naik, Mallikariun HB, Siddayya S. Export Performance of Rice in India. Journal of Agricultural Sciences. 2012;6(4):125-133.
- Nguyen C, Baldeo S. Trend in Rice Production and Export in Vietnam, Omonrice. 2006;14:111-123.
- Raghuram G, Asopa VN. Issues in Infrastructure for Export of Rice from India, IIMA Working Papers No WP2008-07-03; c2008. p. 1-63.
- Rangi PS, Sidhu MS. W.T.O. vis-ã-vis export of basmati rice from India. Indian Journal of Agricultural Marketing. Conf. Spl; c2001. p. 113-119.
- Sadavatti PM. Export of basmati rice and its stability: Markov chain analysis. Ind. J Agri. Mktg. 2006;20:11-18.
- Sadavatti PM. Export Prospects of Indian Basmati Rice: Cointegration and Error Correction Approach. Agricultural Marketing. 2007;21(3):31-35.
- Thumar VM, Khunt KA, Thanki PM, Kumar K. Growth and export performance of major seed spices of India. Ind. J Agri. Mktg. 2012;26:21-35.
- Velmurugan M, Velavan C, Sivakumar SD. Growth, instability, and Structural Changes of Non-Basmati Rice