
Research article · 2023 · Full text
International Journal of Agriculture and NutritionEvaluation of hydraulic performance of three different emitters in drip irrigation systems for small vegetable farms, Gezira state, Sudan
Volume 5(2) · Pages 11–15 · DOI: 10.33545/26646064.2023.v5.i2a.123 ↗
Research areasIrrigation Practices and Water ManagementEngineering and Agricultural Innovations
Abstract
Author-writtenDrip irrigation system is the most efficient economical method for irrigation vegetable production. The objective of this study was to evaluate the hydraulic performance of three different types of emitter’s namely Regular gauge (RG), Compensating pressure (CP) and non-Compensating pressure (NCP) using eggplant (Solanum melonga L.) as a test of a crop. The experiment was conducted in a Faculty of Agricultural Science, University of Gezira during the period of October 2021 to march 2022. Parameters of hydraulic performance of drip emitters were average discharge (Qavg %), discharge variation (Qvar), coefficient uniformity (CU %), coefficient of manufacture variation (CV), emission uniformity (EU %) and statistical uniformity (US %). The treatments were laid out in a randomized complete block design (RCBD) with four replicates. The result showed that the values of (CU%), (CV), (EU%), (US%) and percentage emitters clogging (Pclog%) were 97.9%, 0.38, 40.7%, 58.6%, 1.9% and 96.4%, 0.43, 52.1%, 57.7%, 1.8% and 96.4%, 0.6, 28.3%, 47.5%, 1.3% for regular gauge (RG), compensating pressure (CP) and non-compensating pressure (NCP) respectively. It is considered coefficient uniformity (CU %), was excellent and found to be within the acceptable range while discharge variation (Qvar %), emission uniformity (EU %), coefficient of manufacture variation (CV), and statistical uniformity (Us %) were found to be within the range of poor and unacceptable. Result also showed significant differences among types of emitters on plant height, applied water, yield and water productivity of eggplant. The highest yield was obtained non-compensating pressure (NCP) (13279 kg/ha) while the lowest yield was obtained by regular gauge (RG) (8180 kg/ha). The highest water productivity was obtained by regular gauge (RG) (7.7 kg/m3), while the lowest value was obtained by compensating pressure (CP) (4.8 kg/m3). The study recommends that the best type of emitter was non-compensating pressure (NCP), because it produced the highest yield of eggplant.
Summary
Source-checkedPlain-language reading of the full paper, prepared with AI and checked against the text. Each point links to the authors' own words.
Why it matters
- Drip irrigation is considered the most economical and efficient method for producing vegetables. View evidence ↗
- Drip irrigation systems generally use 30% to 50% less water than conventional irrigation methods. View evidence ↗
- Benefits of drip irrigation include higher efficiency in using water, nutrients, and fertilizers, as well as reduced labor, soil erosion, and weed growth. View evidence ↗
The question
- The study aimed to evaluate the hydraulic performance of three emitter types, Regular gauge (RG), Compensating pressure (CP), and non-Compensating pressure (NCP), using eggplant as the test crop. View evidence ↗
What they did
- The research was conducted at the University of Gezira's Agricultural Experiment farm in Sudan. View evidence ↗
- The experimental period spanned from October 2021 to March 2022. View evidence ↗
- The study used a randomized complete block design (RCBD) with four replicates for the treatments. View evidence ↗
- Hydraulic performance was measured using average discharge, discharge variation, coefficient uniformity, coefficient of manufacture variation, emission uniformity, and statistical uniformity. View evidence ↗
What they found
- The average discharge rates were 1.8 L/h for RG, 2.2 L/h for CP, and 3.7 L/h for NCP emitters. View evidence ↗
- Coefficient uniformity (CU%) was excellent for all types, with RG at 97.9% and both CP and NCP at 96.4%. View evidence ↗
- Emission uniformity (EU%) was poor for all emitters, ranging from 28.3% (NCP) to 52.1% (CP). View evidence ↗
- The non-compensating pressure (NCP) emitter produced the highest eggplant yield at 13,279 kg/ha, while the regular gauge (RG) produced the lowest at 8,180 kg/ha. View evidence ↗
- Water productivity was highest for the regular gauge (RG) emitter at 7.75 kg/m³ and lowest for the compensating pressure (CP) emitter at 4.81 kg/m³. View evidence ↗
- The NCP emitter required the most applied water (2,114.7 m³/ha), whereas the RG emitter required the least (1,122.2 m³/ha). View evidence ↗
What it means
- The authors recommend the regular gauge (RG) emitter as the best choice due to its superior water productivity. View evidence ↗
- The authors state that further studies are needed to better understand how eggplants respond to drip irrigation. View evidence ↗
Visual summary
3 visualsIllustrations explain the paper; charts are replotted from the paper's own table values.
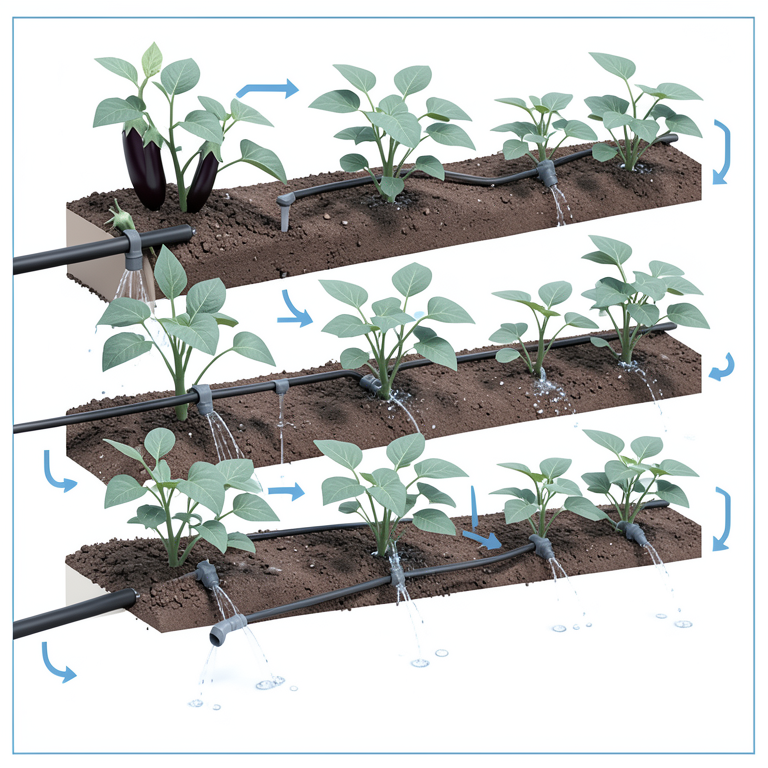
Comparison of Emitter Types
AI-generated conceptual illustration (eggplant plants and drip irrigation emitters). It explains the idea and does not show study data.
View source evidence ↗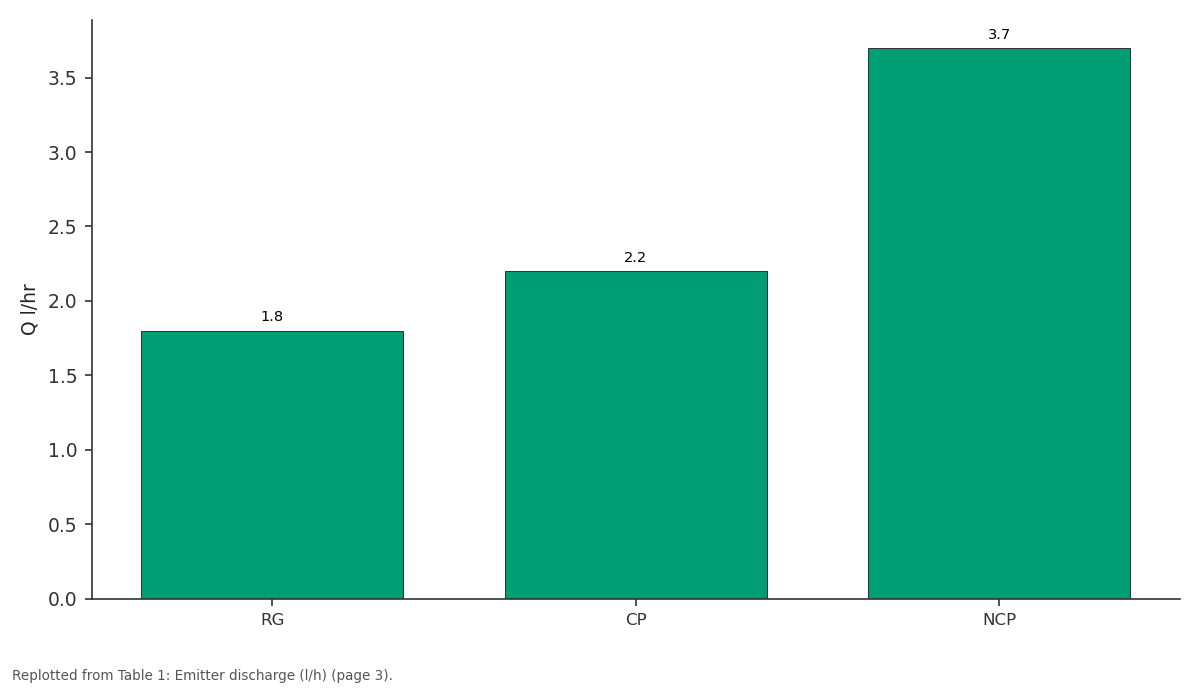
Q l/hr: RG vs CP vs NCP
Replotted from Table 1 (page 3) of the original paper. Every bar is the paper's own table value.
View source evidence ↗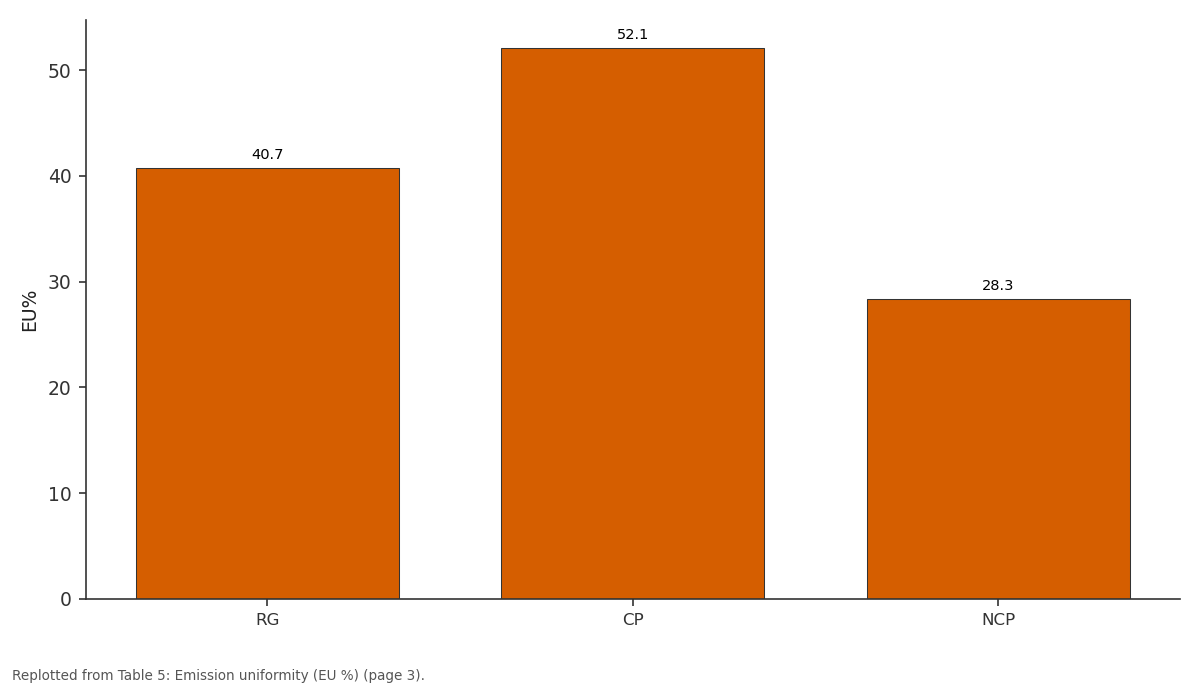
EU%: RG vs CP vs NCP
Replotted from Table 5 (page 3) of the original paper. Every bar is the paper's own table value.
View source evidence ↗Figures & tables
From the original paper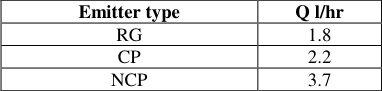 Table 1
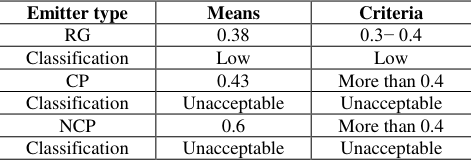 Table 4
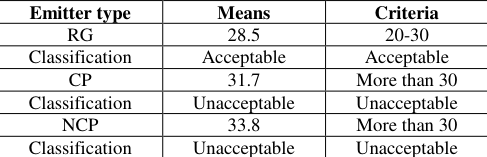 Table 2
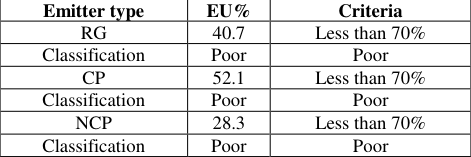 Table 5
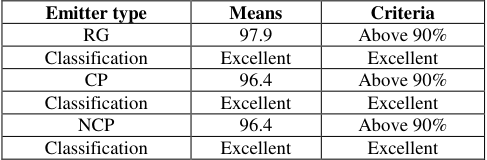 Table 3
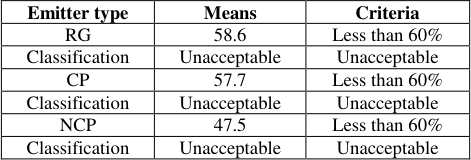 Table 6
 Table 7
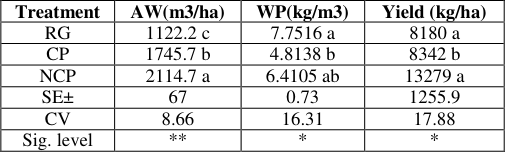 Table 9
 Table 8
Introduction
Drip irrigation sometimes referred to as trickling irrigation, micro-irrigation, or low-volume irrigation, is the ideal technique since it offers a high degree of regularity. Compared to conventional irrigation systems, drip irrigation systems typically consume 30 to 50 percent less water since they supply (Almajeed and Alabas, 2013) [2] . In drip irrigation, dripper emitters deliver small, frequent doses of water to each plant individually. It has the highest application efficiency of any irrigation technique (Phocaides, 2001) [15] . When it comes to high-value cash crops like greenhouse plants, ornamentals, and fruit, drip irrigation technology is gaining popularity and playing a significant role in agricultural output (Pescod, 1992) [14] . The most effective and cost-effective form of irrigation for vegetable production is drip irrigation (Sharu and Abrazak, 2020) [16] . The Advantage of drip irrigation system include: less water, fertilizer and nutrients can be used with high efficiency, reduction in weed growth, reduced labor requirement, less soil erosion. While its disadvantage includes: clogging of drip holes, high initial investment requirement, soil salinity hazard and easy damage of drip lines (Gruban and Denton, 2004) [8] . At the plant, field, farm, system, and basin levels, water productivity can be examined. Its worth would fluctuate with the analysis's scale (Molden et al., 2003) [12] . When calculating irrigation efficiency, water engineers traditionally ignored economic considerations and compared real evapo-transpiration (ET) to the total amount of water diverted for crop production (Kijne et al., 2003) [10] .
Agriculture has a substantially lower economic value of water than other industries, including manufacturing (Xie and Walther, 1993) [19] (Barker et al., 2003) [3] . Researchers were concerned with increasing the productivity of water use in agriculture in order to get the most production or value out of every unit of water used as a result of the growing physical shortage of water on the one hand, and the scarcity of economically accessible water due to increasing cost of production and supply of the resource on the other (Kijne et al., 2003) [10] . However, little information is available on hydraulic performance of different types of emitters in Somalia. The main objective of this research work is to evaluate of hydraulic performance of three different emitters in drip irrigation systems for small vegetable farm in Gezira sate, Sudan.
Materials and Methods
The experiment was carried out Agricultural Experiment farm owned by the University of Gezira Faculty of Agricultural Science, at latitude 14°21' N, longitude 29°33' E and altitude 405 m above mean sea level. The experimental site is clay, dark brown, deep cracking with very low permeability (Soil Survey Staff, 1999) [17] . The experiment started at the beginning of (fall) season during October 2021 up to the (Winter) season March 2022. The area of the experimental plot was 170 m 2 with dimensions of 17 m*10 m. Four replications of a randomized complete block design were used to set up the experimental plot. Three treatments were used which were regular gauge (RG), compensating pressure (CP) and non-compensating pressure (NCP).
Methods
Methods
Discharge of emitter
Average discharge rate was measured using graduated measuring cylinder, catch cans and stopwatch. The model was lifted to work until one of the catch cans was filled stopped the watch and then the collected water in catch cans measured. To determine the average capacity in liters, the test was conducted three times. To calculate the discharge, divide the average volume by the passage of time. q = V/t Where: q = Discharge (L/h) V = Volume collected (ml) t = Time taken (hours) Discharge variation (Qvar) Emitter flow variation (qvar) was calculated using the following equation: Qvar = (Qmax -Qmin)/Qmax Where Qvar = Flow variation q max = maximum emitter flow rate (L/h) q min = minimum emitter flow rate (L/h)
According to the equation established by Christiansen (1942) [6] , the coefficient of uniformity was calculated as follows:
Where CU = Uniformity coefficient (%) Sd = Standard deviation of observation Vavg = Average volume collected.
The Coefficient variation can be computed using the formula below (Burt and Styles, 200 Coefficient of manufacture variation (CV %). The Coefficient variation can be computed using the formula below (Burt and Styles, 2007) [5] . CV% = 100 * SD/q Where CV = the coefficient of variation of emitter discharge. SD = standard deviation of emitter discharge. q = average discharge in the same lateral lines (L/h).
According to (Keller and Blaisner 1990) [21] the emission uniformity is defined as follows: EU (%) = (qavg25%/q avg)*100 Where Qavg 25% = mean of the lowest 0.25 of emitter discharge. q avg = average discharge rate of all the emitters checked in the field (L/h).
The statistical uniformity was computed according to the following equation by (Bralts and Kesner, 1987) [4] .
Us= 100 (1 -Sq/q) Where Us = Statistical Uniformity (%) Sq = Standard deviation of emitters discharge (l/h). q = Discharge of emitters (l/h).
The following equation was used to calculatethe percentage of clogged emitters Where Pclog = Percentage of clogging emitters (%). Nesclog = Numbers of clogged emitters. Nestotal = total numbers of emitters.
Statistical analysis
Using an appropriate randomized complete block design analysis of variance MSTAT programme.
Results and Discussions Discharge (l/h):
The emitters discharges were measured and calculated and the Table 1 [9] who reported that the coefficient of uniformity Hydraulic design has an impact on drip irrigation system, although manufacture's variation. Bralts et al. (1987) [4] reported that the coefficient of uniformity greater than 90% is excellent. [11] and Soccol et al. (2002) [13] who found that the mean coefficient of variation was 0.28 for drip irrigation systems. [13] who reported that the statistical uniformity values less than 60% is unacceptable. Wetted diameter (cm) Table (8) shows the effect of hydraulic performance on wetted diameter of drip irrigation. The result obtained shows that the average wetted diameter of emitters was 8.9 cm, 8.8 cm, and 9.6 cm for Regular gauge (RG), compensating pressure (CP) and non-compensating pressure (NCP), respectively. The highest value was achieved by the noncompensating pressure emitter (9.6 cm) while the lowest value was obtained by the compensated pressure (8.8 cm).
| Emitter type | Q l/hr |
|---|---|
| RG | 1.8 |
| CP | 2.2 |
| NCP | 3.7 |
Table text extracted from the original PDF; superscript letters are shown inline. The original table image is below.
View original table image
The findings showed that the differences were highly significant differences (p≤ 0.01) in applied water between treatments of drip irrigation system. The results of the applied water obtained by the regular gauge emitter (RG), compensating pressure emitter (CP) and non-compensating pressure emitter (NCP). were1172.5 m 3 /ha, 151s1.7 m 3 /ha and 2165.6 m 3 /ha -1 , respectively. The significantly highest applied water was obtained by the none-compensating pressure emitter (2114.7 m 3 /ha), while the lowest was achieved by the regular gauge emitter (1122.2 m 3 /ha).
The water productivity associated with the different emitter's types is presented in Table (9). The results showed that there were significant differences (p≤0.05) between the different types of emitters. The range for water productivity (kg/m 3 ) for the emitter's type (RG, CP, NCP) was 7.75 kg/ m 3 , 4.81 kg/m 3 and 6.41 kg/m 3 , respectively. The significantly highest water productivity was obtained by the emitter regular gauge pressure. (7.7516 kg/m 3 ) while the lowest was achieved by the compensating pressure emitter (4.81 kg/m 3 ). Similar results were obtained by Yagoub (2018) [22] who reported that water productivity under full irrigation treatment was 7.5 kg/m 3 .
The results indicate that there was a significant difference (p≤0.05) between treatments under drip irrigation system. The yields obtained by the regular gauge emitter (RG), compensating pressure emitter (CP) and non-compensating pressure emitter (NCP) were 8627 kg/ha, 9313 kg/ha and 13477 kg/ha, respectively. The findings of the statistical study showed that were significant differences (p≤0.05) in yield between the different irrigation treatments. The highest crop yield was obtained by the non-compensating pressure emitter (13279 kg/ha), while the lowest yield was achieved by the regular gauge emitter (8180 kg/ha). There was a reduction in yield of 20, 29 and 44%, by the drip irrigation treatments compared to fully irrigated treatments. These results agree with the findings Karam et al., (2009) [20] and Topcu et al., (2007) [18] .
Conclusion and Recommendation Conclusion
Evaluation of drip irrigation system performance is required periodically to ensure that the right emitter discharge is maintained. Results of this study on the hydraulic performance in three types of emitters were conducted and can be drawn as the following points: The average discharge varied from 1.8 to 3.7 l/hr. The values of hydraulic performance of drip irrigation system under three types of emitters, including: coefficient uniformity (CU %), was quite good and found to be within the acceptable range while discharge variation (Qvar %), emission uniformity (EU %), coefficient of manufacture variation (CV), and statistical uniformity (Us %) were found to be within the range of poor and unacceptable. Regular gauge (RG) is the best one for all parameters of hydraulic performance except on average discharge, emission uniformity and clogging percent. The highest yield of eggplant was obtained by noncompensating pressure (13279 kg/ha), while the highest water productivity was obtained by regular gauge (7.75 kg/m³).
Recommendation
Hydraulic performance of this result was recommended as the following: The best one emitter type is the regular gauge (RG) because it has the highest water productivity as compared to other emitters, non-compensating pressure emitters (NCP) and compensating pressure emitters (CP). It's still necessary to have more studies studies for better understanding of eggplant respond to drip irrigation.
Acknowledgment
The study supported by Gezira University and Faculty of Agricultural Science. The success of this study would not have been possible without the cooperation and readiness of the herd owners. All assistance and support were much appreciated.
Figures and tables from the paper
| Emitter type | Means | Criteria |
|---|---|---|
| RG | 0.38 | 0.3− 0.4 |
| Classification | Low | Low |
| CP | 0.43 | More than 0.4 |
| Classification | Unacceptable | Unacceptable |
| NCP | 0.6 | More than 0.4 |
| Classification | Unacceptable | Unacceptable |
Table text extracted from the original PDF; superscript letters are shown inline. The original table image is below.
View original table image
| Emitter type | Means | Criteria |
|---|---|---|
| RG | 28.5 | 20-30 |
| Classification | Acceptable | Acceptable |
| CP | 31.7 | More than 30 |
| Classification | Unacceptable | Unacceptable |
| NCP | 33.8 | More than 30 |
| Classification | Unacceptable | Unacceptable |
Table text extracted from the original PDF; superscript letters are shown inline. The original table image is below.
View original table image
| Emitter type | EU% | Criteria |
|---|---|---|
| RG | 40.7 | Less than 70% |
| Classification | Poor | Poor |
| CP | 52.1 | Less than 70% |
| Classification | Poor | Poor |
| NCP | 28.3 | Less than 70% |
| Classification | Poor | Poor |
Table text extracted from the original PDF; superscript letters are shown inline. The original table image is below.
View original table image
| Emitter type | Means | Criteria |
|---|---|---|
| RG | 97.9 | Above 90% |
| Classification | Excellent | Excellent |
| CP | 96.4 | Above 90% |
| Classification | Excellent | Excellent |
| NCP | 96.4 | Above 90% |
| Classification | Excellent | Excellent |
Table text extracted from the original PDF; superscript letters are shown inline. The original table image is below.
View original table image
| Emitter type | Means | Criteria |
|---|---|---|
| RG | 58.6 | Less than 60% |
| Classification | Unacceptable | Unacceptable |
| CP | 57.7 | Less than 60% |
| Classification | Unacceptable | Unacceptable |
| NCP | 47.5 | Less than 60% |
| Classification | Unacceptable | Unacceptable |
Table text extracted from the original PDF; superscript letters are shown inline. The original table image is below.
View original table image
| Emitter type | Means |
|---|---|
| RG | 1.9 |
| CP | 1.8 |
| NCP | 1.7 |
Table text extracted from the original PDF; superscript letters are shown inline. The original table image is below.
View original table image
| Treatment | AW(m3/ha) | WP(kg/m3) | Yield (kg/ha) |
|---|---|---|---|
| RG | 1122.2 c | 7.7516 a | 8180 a |
| CP | 1745.7 b | 4.8138 b | 8342 b |
| NCP | 2114.7 a | 6.4105 ab | 13279 a |
| SE± | 67 | 0.73 | 1255.9 |
| CV | 8.66 | 16.31 | 17.88 |
| Sig. level | ** | * | * |
Table text extracted from the original PDF; superscript letters are shown inline. The original table image is below.
View original table image
| Emitter type | Wetted diameter (cm) |
|---|---|
| RG | 8.9 |
| CP | 8.8 |
| NCP | 9.6 |
Table text extracted from the original PDF; superscript letters are shown inline. The original table image is below.
View original table image
References
11 in the original paper- Bralts VF, Kesner CD. Drip irrigation field uniformity estimation. Transactions of the ASAE. 1987;26(5):1369-1374.
- Kirnak H, Douan E, Demur S, Yalcin S. Determination of hydraulic performance of trickle irrigation emitters used in irrigation systems in the Harran Plain. Turk Journal of Agricultural. 2014;28(4):223-230.
- Mohamed A, Alabas AA. Evaluation the hydraulic performance of drip irrigation system with Multi case. Global journal of researchers in engineering general engineering. Version 1.0. publisher: Global Journals Inc. (USA), 2014, 13(2).
- Molden D, Murray-Rust H, Sakthivadivel R, Makin I. A water-productivity framework for understanding and action. Water productivity in agriculture: Limits and opportunities for improvement. 2003;1:1-8.
- Soccol OJ, Ullmann MN, Frizzone JA. Performance analysis of trickle irrigation subunit installed in an apple orchard. Brazilian archives of biology and technology. An international Journal. 2002;45(4):625530.
- Sharu EH, Ab Razak MS. Hydraulic performance and modeling of pressurized drip irrigation system. Water (Switzerland). 2020;12(8):2295. https://doi.org/10.3390/w12082295.
- Topcu S, Kirda C, Dasgan Y, Kaman H, Cetin M, Yazici A, et al. Yield response and N-fertilizer recovery of tomato grown under deficit irrigation. European Journal of Agronomy. 2007;26(1):64-70.
- Xie Z, Walther JV. Quartz solubilities in NaCl solutions with and without wollastonite at elevated temperatures and pressures. Geochimica et Cosmochimica Acta. 1993;57(9):194.
- Karam F, Kabalan R, Breidi J, Rouphael Y, Oweis T. Yield and water-production functions of two durum wheat cultivars grown under different irrigation and nitrogen regimes. Agricultural water management. 2009;96(4):603-15.
- Keller B. Chain complexes and stable categories. Manuscripta Mathematica. 1990;67(1):379-417.
- Yu X, Bao X, Zhou C, Zhang L, Yagoub AE, Yang H, et al. Ultrasound-ionic liquid enhanced enzymatic and acid hydrolysis of biomass cellulose. Ultrasonics Sonochemistry. 2018;41:410-418.
Cited by 6
From OpenAlex, OpenCitations and reference lists read by Scinovex
- Role of hydroponics in paddy nursery for water conservation to promote food security and environmental sustainability ↗
Aparajita Das, Priya Kaur, Shivanshu Kaletha, Puneet Pathak, Anil Kanaujia, Anup Kalra et al. · South Asian Journal of Agricultural Sciences · 2024
Water and food are basic necessities of life with water being the vital key for food production. Paddy is a water-guzzling crop cultivated in more than 100 countries worldwide and consumed by over half of the global population. Paddy cultivation is mostly through traditional irrigation methods which leads to low water use efficiency coupled with many environmental problems. Paddy consumes
- Influence of drip irrigation on growth and yield of pigeon pea ↗
Chaudhari AV, Kale RD, Wankhade SV · International Journal of Chemical Studies · 2025
The field experiment was conducted during kharif season of 2016-2017 at the Experimental Farm of Agronomy at Agriculture Research Station, Badnapur, Jalna (Maharashtra), Vasantrao Naik Marathwada Krishi Vidyapeeth Parbhani using pegion pea as a test crop to studies on response of pegion pea to drip irrigation. The experiment was laid out on Vertisols with two factors, twelve treatment combination, replicated
- Physiological Evaluation of redgram-based cropping system on crop growth and competitiveness in Samai
K. Ananthi, K. Sivagamy, V Arunkumar, M. Gomathy, B Sivakumar, E. Jamuna · International Journal of Biology Sciences · 2025
The small millet with legume intercropping system benefits small farmers by reducing environmental risk and improving yield potential due to low input and enhanced soil fertility. Due to climate changes, the significant reduction in agricultural by-products is caused by water scarcity, increasing temperatures, and variations in solar interception, leading to yield reduction. Planting both cereal and legume intercrops on the same piece of land helps reduce cultivation costs and effectively utilize resources. The different plant heights improve light interception, enhancing photosynthetic effici
- Study of moisture distribution and wetting pattern with mulching under drip irrigation on bitter gourd crop ↗
Rosine Uwase, Georgie Mutuyimana, Meiyappan Valliammai, Eric Derrick Bugenimana, Augustin Nsengimana · The Pharma Innovation · 2025
Soil moisture management is crucial for efficient irrigation, especially in arid and semi-arid regions where water resources are limited. Mulching under drip irrigation has been shown to improve water use efficiency and crop yields. This study evaluated the impact of soil moisture distribution and wetting patterns with mulching under drip irrigation in bitter gourd cultivation. Experiments were carried out at
- Effect of drip irrigation uniformity and soil moisture on growth and yield of chilli (Capsicum annum L.)
L. B. Surnar, SA Ranpise, PK Pawar · International Journal of Horticulture and Food Science · 2025
The present study was conducted at All India Coordinated Research Project on Vegetable Crops, Department of Horticulture, Mahatma Phule Krishi Vidyapeeth, Rahuri, Dist. Ahmednagar during summer and late kharif 2018-19. The experiment was laid out in split plot design with three replications and sixteen treatment combinations, which comprises four levels of irrigation viz., I1-0.7ETc, I2-0.8 ETC, I3-0.9 ETC and I4-1.0ETc by drip irrigation as main plot treatments and four levels of fertigation viz., F1-125, F2-100, F3-75 and F4-50% of RDF through WSF as sub-plot treatments. The control treatmen
- Optimization of gravity-fed surface drip irrigation system for small farm under varying head and length of laterals
Sahu A, Agrawal P, Sahu B · International Journal of Agriculture Extension and Social Development · 2024
Gravity fed drip irrigation system is low-cost irrigation system which directly supply water from overhead tank which is kept at some specific height. Gravity provides the pressure needed for the system. The water source is situated above 10 m from ground level. With the process of siphoning, water is directly supplied from the water source from higher elevation to lower elevation. A small area of 10 x 12 m2 is chosen for the purpose of the project. Optimization of low head gravity fed drip irrigation system under variable operational head of 1m, 1.5m, 2 m along with varying length of laterals