
Research article · 2023 · Full text
International Journal of Statistics and Applied MathematicsResource use efficiency of super seeder technology: A comparative study in Haryana's wheat farming
Volume 8(5S) · Pages 1135–1138 · DOI: 10.22271/maths.2023.v8.i5sp.1341 ↗
Research areasAgricultural Economics and PracticesCrop Yield and Soil Fertility
Abstract
Author-writtenThe study explores wheat cultivation resource efficiency in Karnal and Kaithal districts of Haryana during 2021-22. These districts, chosen for their resource conservation techniques, used the Cobb-Douglas function for analysis. Seed and fertilizer costs significantly boost wheat production, while human labour, though influential, lacks statistical significance. Irrigation has a significant negative impact, while machine labour and plant protection, although influential, lack statistical significance. The coefficient of determination (R2) is 59%, showing a moderate relationship. For super seeder technology, machine labour and plant protection positively impact wheat yield, despite the negative effects of seed costs. Output elasticity shows resource underutilization. Human labour significantly reduces yield, while fertilizer costs and irrigation, though non-significant, boost it. In this context, R2 rises to 73%, indicating a stronger relationship. This research sheds light on wheat resource utilization and super seeder technology's potential for regional optimization.
Summary
Source-checkedPlain-language reading of the full paper, prepared with AI and checked against the text. Each point links to the authors' own words.
Why it matters
- Rice stubble burning in Punjab, India, is common due to a lack of machinery for residue incorporation, leading to air pollution, soil fertility loss, and greenhouse gas emissions. View evidence ↗
- Super Seeder technology was introduced to address the environmental and soil challenges associated with traditional rice stubble burning. View evidence ↗
- India's rice-wheat cropping system is currently facing sustainability issues such as soil degradation, groundwater depletion, and yield stagnation. View evidence ↗
The question
- The study aims to evaluate the economic advantages and disadvantages of Super Seeder technology compared to traditional tillage and straw burning. View evidence ↗
What they did
- The research was conducted in the Karnal and Kaithal districts of Haryana during the 2021-22 period. View evidence ↗
- Resource use efficiency was analyzed using the Cobb-Douglas production function. View evidence ↗
- The study used monetary values (Rs/ha) rather than physical quantities to measure inputs and outputs. View evidence ↗
- The study analyzed 50 samples for the conventional technique and 50 samples for the super seeder technology. View evidence ↗
What they found
- Conventional techniques showed decreasing returns to scale (0.078), indicating that resources were over-utilized. View evidence ↗
- In conventional techniques, irrigation had a significant negative impact (-0.045), suggesting its excessive use compared to super seeder technology. View evidence ↗
- For conventional techniques, seed costs (0.055) and fertilizer costs (0.096) significantly and positively influenced gross returns. View evidence ↗
- Super seeder technology showed increasing returns to scale (1.37), indicating that resources were under-utilized. View evidence ↗
- In super seeder technology, machine labor (1.32) and plant protection (0.05) had significant positive effects on wheat returns. View evidence ↗
- Seed costs had a significant negative impact (-0.002) on returns when using super seeder technology. View evidence ↗
- For super seeder technology, the MVP/MFC ratios for machine labor (1.67) and plant protection (0.090) were statistically significant. View evidence ↗
What it means
- The authors conclude that super seeder technology provides a more favorable return to scale than conventional farming methods. View evidence ↗
- The authors state that while conventional methods tend to overuse resources, super seeder technology tends to underutilize machinery. View evidence ↗
- A limitation noted is the unavailability of super seeder machinery during sowing, which may force farmers to use alternatives to avoid yield-reducing delays. View evidence ↗
Visual summary
2 visualsIllustrations explain the paper; charts are replotted from the paper's own table values.
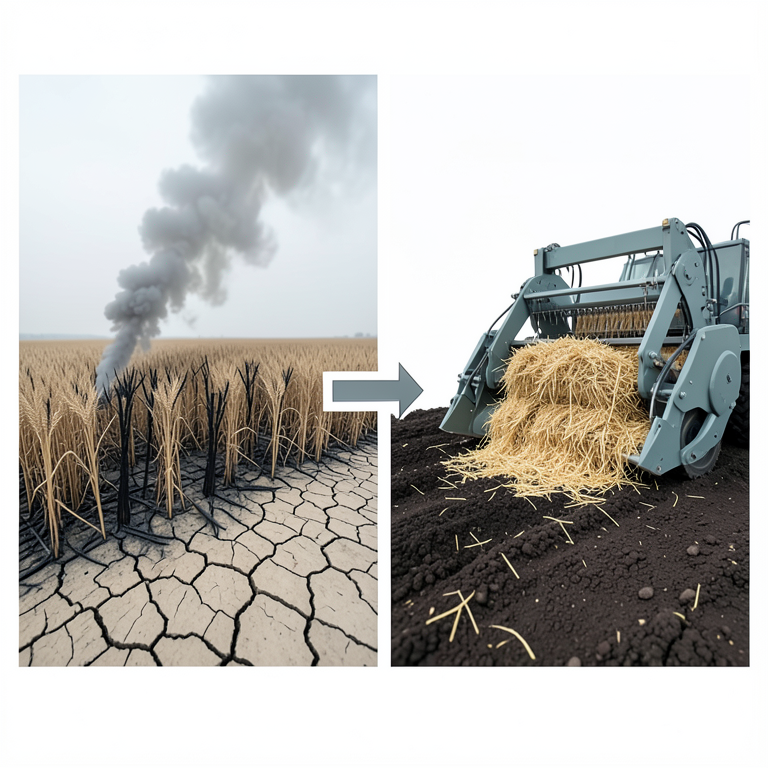
Environmental Impact Transition
AI-generated conceptual illustration (wheat fields with rice stubble). It explains the idea and does not show study data.
View source evidence ↗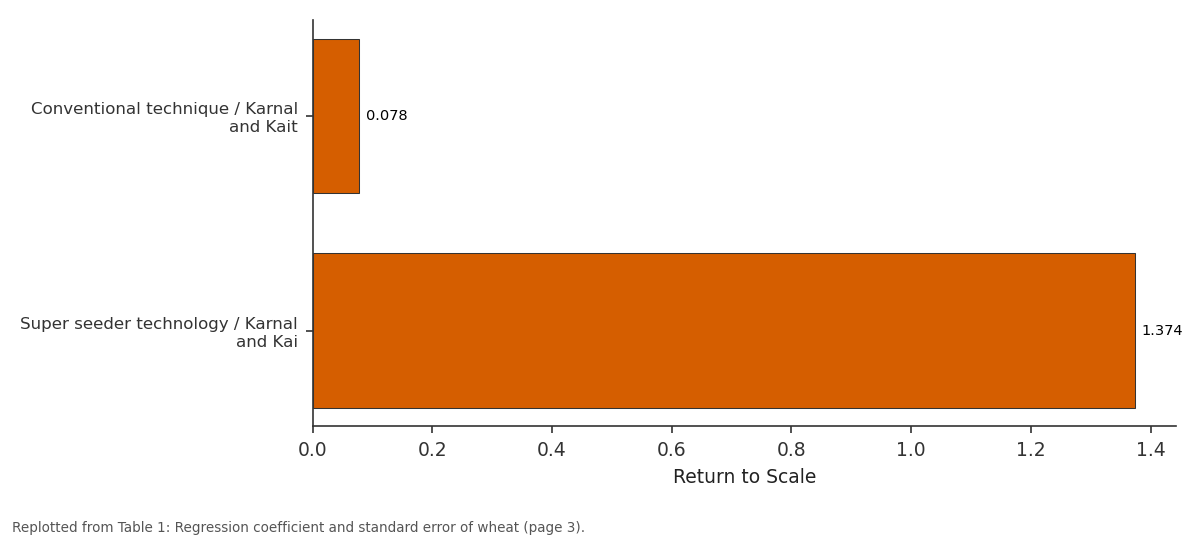
Return to Scale: Conventional technique... vs Super seeder technology...
Replotted from Table 1 (page 3) of the original paper. Every bar is the paper's own table value.
View source evidence ↗Figures & tables
From the original paper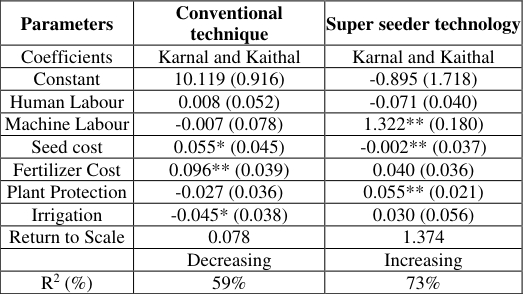 Table 1
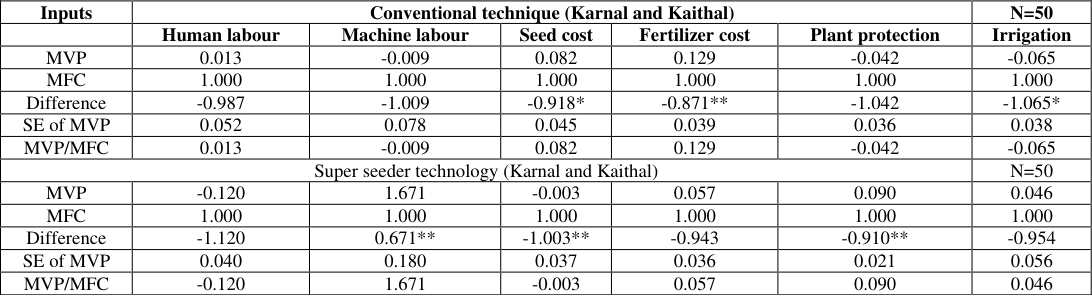 Table 2
Introduction
The term "efficiency" invokes minimizing energy, effort, money, and time while achieving desired outcomes. In agriculture, "resource use efficiency" pertains to the yield of a crop relative to the resources applied, considering specific soil and climatic conditions (Bera, 2021) [1] . This concept encompasses technical, allocative, and environmental efficiency. Forwardthinking farmers strategically allocate land, labor, water, and resources to maximize income while conserving resources at an optimal cost. However, research has highlighted suboptimal resource utilization by some farmers, with varying priorities, such as maximizing physical yield or profits per unit of resources, often overlooking adverse environmental impacts. For instance, in Punjab, India, the prevalent practice of burning rice stubble stems from the lack of suitable machinery to incorporate rice residues into the soil for wheat cultivation. While burning offers a quick turnover, it has severe consequences, including air pollution, soil fertility loss, and greenhouse gas emissions. The introduction of the Super Seeder addresses these challenges, and this study aims to assess its economic pros and cons compared to straw burning and traditional tillage. Sustainable intensification, which optimizes resource utilization for enhanced food production, holds promise (West et al., 2010; Ghasemi Mobtaker et al., 2020; Tilman et al., 2011; Bhatt et al., 2021) [12,5,10,2] . With improved seeds, fertilizers, and irrigation, India's Green Revolution significantly boosted food grain production. However, future challenges, such as a 70% rise in global wheat demand by 2050, necessitate further innovation. The rice-wheat cropping system in India faces sustainability issues, including yield stagnation, groundwater depletion, soil degradation, pest outbreaks, and environmental impacts. The coexistence of groundwater contamination and greenhouse gas emissions is linked to lower nutrient use efficiency (Bhatt et al., 2016; Tilman et al., 2002; Singh et al., 2020) [2,10,7] , increasing fertilizer-N and P requirements. Improving nutrient use efficiency depends on precise timing and fertilizer application rates to optimize crop yields while minimizing environmental risks (Singh et al., 2020) [7] . The coexistence of groundwater contamination and greenhouse gas emissions is linked to lower nutrient use efficiency (Bhatt et [2,11,7] , leading to increased fertilizer-N and P requirements.
Improving nutrient use efficiency depends on precise timing and rates of fertilizer application to optimize crop yields while minimizing environmental risks (Singh et al., 2020) [7] .
Materials and Methods
In the current study, the resource use efficiency of wheat was determined by using production function analysis. For this investigation, the Cobb-Douglas production function of the following form was fitted: Y = a X 1 . b1 X 2 . b2 X 3 . b3 X 4 . b4 X 5 . b5 X 6 b6
Where: Y = Gross returns (Rs/ha). X1 = Human labour (Rs/ha). X2 = Machine hours (Rs/ha). X3 = Seed (Rs/ha). X4 = Fertilizer (Rs/ha). X5 = Plant protection (Rs/ha). X6 = Irrigation (Rs/ha). 'A ' is the constant term bi's are the regression coefficients to be estimated.
In the above functional form, output (Y) and inputs (Xi's) should ideally be measured in physical units. However, this research chose monetary values of inputs and outputs above physical quantities. Cobb-Douglas production function was used to determine the return to scale from wheat, and a formula was used to compute it.
RTS = ∑bi
Where, bi = regression coefficient of i th variable.
Returns to Scale
Returns to scale can be categorized as increasing, constant, or decreasing based on the outcome of simultaneously increasing input factors. When a proportional increase in inputs leads to a more significant increase in output, it is considered increasing returns to scale. If the increase in output is proportional to the increase in inputs, it is a constant return to scale. Conversely, if the increase in output is less than the increase in inputs, it is decreasing returns to scale. To calculate this, one sums the production elasticities. However, it is essential to assess the significance of this value to determine whether returns to scale are increasing, decreasing, or constant. This determination is made by examining the sum of the bi coefficients derived from the Cobb-Douglas production function. These coefficients provide valuable insights into the nature of returns to scale in a more nuanced manner than a simple mathematical number can convey. The following is the return-to-scale decision rules: RTS < 1: Decreasing return to scale (Over-utilization of resources) RTS = 1: Constant return to scale (Efficient utilization of resources) RTS > 1: Increasing return to scale (Under-utilization of resources) The coefficient of multiple determination at t-test was used to test the analysis results.
Level of Significance
The regression coefficients (bi) were tested for their significance using the 't-test at the chosen level of significance.
t= bistandard error of bi
t= bistandard error of bi
Marginal Value Product
The ratio of Marginal Value Product (MVP) to Marginal Factor Cost is one approach to estimating the amount of resource usage efficiency in agricultural production (MFC). When using this methodology, the decision rules are as follows: MVP/MFC >1, the degree of resource consumption is less than optimal, signifying resource underutilization. MVP/MFC<1, the degree of resource usage is more than the optimum level, signifying resource overuse. MVP/MFC =1, the optimal resource consumption degree reflects effective resource utilization.
Where, MVP = value of change in output resulting from a unit change in variable input. MFC = price paid for the unit of variable input. In the Cobb-Douglas production function, the marginal value product (MVP) of Xi, the i th input factor, is given by the following formula.
MVP of Xi = YX
Where, Y = Geometric mean of yield (Y i) X = Geometric mean of input xi bi = production elasticity of xi After calculating each input's marginal value product, it must be compared against its marginal fixed cost. The marginal value of a product's fixed cost in monetary terms is one rupee. If the marginal value of the product is measured in a physical quantity, the marginal fixed cost will equal the cost of one unit of input.
Result and Discussion
Result and Discussion
Resource use efficiency of wheat under super seeder techniques (SST) and conventional technique (CT) of wheat cultivation in Haryana
One of the most crucial measures in agricultural production economics is estimating resource use efficiency. This makes it possible to allocate resources appropriately and effectively. The estimated input usage has been expressed in monetary terms (Rs. /ha). The following results are reported for resource usage efficiency about several explanatory variables of crop costs in conventional technique and super seeder technology. In this section, resource use efficiency is calculated concerning different explanatory variables of the cost of cultivation in conventional technique and super seeder technique of wheat in Karnal and Kaithal district of Haryana. The input-output relationship of wheat cultivation under Conventional technique and Super seeder technology in Haryana is given in Table 1. In the case of conventional technology, the coefficient of machine labour and plant protection was observed as negative (-0.007 and -0.027), respectively this indicates that a 10 percent increase in the machine usage and plant protection measures, keeping other inputs constant, the wheat productivity decreased by 0.7 percent and 2.7 percent, respectively, which means the excess of machine cost and plant protection cost. The negative coefficients and nonsignificant indicate that the resources are currently used in the production but could be dropped out without much impact on the returns. The irrigation coefficient was negative (-0.045*) and significant at a one percent probability level, indicating excess use of irrigation in conventional over the super seeder technology (0.030). The regression coefficient of seed cost (0.055*) and fertilizer cost (0.096**) was found to be positive and significant at one percent and five percent, respectively, indicating that a unit increase in any of the variable holding others constant will lead to a unit increase in the gross returns. However, it was discovered that human labour had a positive but insignificant effect on wheat output as measured by regression coefficients. As a result, the production elasticity was declining (0.078), indicating over-utilization of these resources and decreasing returns to scale, meaning that if these resources are increased by one percent, the output will be increased by less than one percent. The wheat cultivation dependent and independent variables showed a 59 percent variation. According to the coefficient of determination (R2), it was indicated that 59 percent of the total variation in the dependent variable is explained by variation the independent variables included in the model. Hence, results suggested that for optimum allocation of resources, there is a need to reduce the cost of machines, plant protection, and irrigation. The findings conformed to the findings of Kaur (2017) [6] . Machine labour and plant protection were shown to have a significant and positive effect on the wheat returns, and the coefficient were 1.32 and 0.05, respectively, and both were significant at a 5 percent level of probability in the case of the super seeder technology of the Karnal and Kaithal districts. This indicates that a 10 percent increase in the machine usage labour and plant protection, other constant inputs, increases wheat productivity by 132 percent and five percent, respectively, which means excess use of machine and plant protection costs. However, there are some constraints in the use of super seeder in the study area, such as the nonavailability of machinery at the time of sowing so the farmer can choose the next best alternative to super seeder because if he waits for the sowing then delay in wheat sowing arise directly affects the yield of the wheat. However, it is shown that seed costs were significant but negative (-0.002*). The output elasticity was discovered to be rising by 1.37, indicating the under-utilization of resources, meaning that if these resources are increased by one percent, the output will be increased by more than one percent. However, human labour has a significantly negative impact, but fertilizer costs and irrigation were observed to have a non-significant and positive impact on yield. The wheat cultivation dependent and independent variables showed a 73 percent variation, according to the coefficient of determination (R2), indicating that 73 percent of the total variation in the dependent variable is explained by variation in the independent variables included in the model. The findings conformed to the findings.
| Parameters | Conventional technique | Super seeder technology |
|---|---|---|
| Coefficients | Karnal and Kaithal | Karnal and Kaithal |
| Constant | 10.119 (0.916) | -0.895 (1.718) |
| Human Labour | 0.008 (0.052) | -0.071 (0.040) |
| Machine Labour | -0.007 (0.078) | 1.322** (0.180) |
| Seed cost | 0.055* (0.045) | -0.002** (0.037) |
| Fertilizer Cost | 0.096** (0.039) | 0.040 (0.036) |
| Plant Protection | -0.027 (0.036) | 0.055** (0.021) |
| Irrigation | -0.045* (0.038) | 0.030 (0.056) |
| Return to Scale | 0.078 | 1.374 |
| Decreasing | Increasing | |
| R2 (%) | 59% | 73% |
Table text extracted from the original PDF; superscript letters are shown inline. The original table image is below.
View original table image
Marginal value for productivity of different inputs used in wheat cultivation
As shown in Table 2 for wheat cultivation by conventional technique, the ratios of MVP to MFC for the cost of seed (0.082) and fertilizers (0.129) were statistically significant at a one and five percent level, respectively. MVP to MFC for labour (0.013) was also positive, but values were less than one. The positive values of MVP to MFC indicated a further opportunity to increase wheat production using more seed, fertilizers, and labour. In the case of a machine (-0.009), plant protection (-0.042), and irrigation (-0.065), the ratio of MVP to MFC was also negative. However, they were not statistically significant. These negative values indicated no further scope to increase wheat production using a machine, plant protection, and irrigation. The findings were similar to the findings. As shown in Table 2 for the wheat cultivation by super seeder, the ratios of MVP to MFC for the cost of the machine other than super seeder (1.67) and plant protection (0.090) were statistically significant at a five percent level. MVP to MFC for fertilizers (0.05) and irrigation (0.046) were also positive, but values were less than one. Positive values of MVP to MFC indicated that there was further opportunity to increase wheat production using more machines, fertilizer, irrigation, and pesticides. In the case of seed cost, the ratio of MVP to MFC was (-0.003), which was statistically significant at a five percent level, and the ratio of labour cost (-0.012) was also negative; however, they were not statistically significant. These negative values indicated no further scope to increase wheat production using seed and labour inputs. The findings were similar to the findings. Further, in the case of the super seeder technology, the difference between MVP with its unit price for machine labour was observed to be significant at a five percent level and positive. In contrast, human labour and irrigation are positive but insignificant, indicating that these inputs are under-utilized. The difference between marginal value productivity and marginal factor cost for fertilizer and seed cost was negative and non-significant, indicating overutilization these inputs. According to Singh et al., 2021 [9] , farmers generally apply a higher seed rate than the recommended rate to ensure good germination and proper crop stand. Singh et al. also reported that ~ 28% of farmers were using a higher seed rate than the recommended (100 kg ha-1), of which ~ 35% had stored the previous year's harvest for use as seed. Farmers used stored grains as a seed because it helps reduce the cost of cultivation. The difference between marginal value productivity and marginal factor cost for plant protection was negative and significant, indicating overutilization of these inputs; hence, there is a need to reduce the uses of these inputs for further enhancement in wheat profitability. According to Bhatt et al., 2021 [3] in northwestern India, farmers prefer chemical measures for effective weed control because they compete with the primary plants for light, water, and plant nutrients and, in turn, decrease the overall land productivity of the system. Being a major biotic constraint to sustainable agriculture in Asia, weeds caused complete grain yield losses in some cases. Brar and Walia, 2007 [4] also reported that conventional tillage for wheat establishment favored the germination of grassy weeds in wheat under a rice-wheat cropping system. Nevertheless, the application of insecticides and fungicides was highly site and situation-specific. The finding is consistent with.
| Inputs | Conventional technique (Karnal and Kaithal) | — | — | — | — | N=50 |
|---|---|---|---|---|---|---|
| Human labour | Machine labour | Seed cost | Fertilizer cost | Plant protection | Irrigation | |
| MVP | 0.013 | -0.009 | 0.082 | 0.129 | -0.042 | -0.065 |
| MFC | 1.000 | 1.000 | 1.000 | 1.000 | 1.000 | 1.000 |
| Difference | -0.987 | -1.009 | -0.918* | -0.871** | -1.042 | -1.065* |
| SE of MVP | 0.052 | 0.078 | 0.045 | 0.039 | 0.036 | 0.038 |
| MVP/MFC | 0.013 | -0.009 | 0.082 | 0.129 | -0.042 | -0.065 |
| Super seeder technology (Karnal and Kaithal) | N=50 | |||||
| MVP | -0.120 | 1.671 | -0.003 | 0.057 | 0.090 | 0.046 |
| MFC | 1.000 | 1.000 | 1.000 | 1.000 | 1.000 | 1.000 |
| Difference | -1.120 | 0.671** | -1.003** | -0.943 | -0.910** | -0.954 |
| SE of MVP | 0.040 | 0.180 | 0.037 | 0.036 | 0.021 | 0.056 |
| MVP/MFC | -0.120 | 1.671 | -0.003 | 0.057 | 0.090 | 0.046 |
Table text extracted from the original PDF; superscript letters are shown inline. The original table image is below.
View original table image
Conflict of interest
Authors have declared that no competing interests exist.
Acknowledgement
Authors wish to acknowledge Chaudhary Charan Singh Haryana Agricultural University and all the farmers who participated in the study and made the study successful.
Conclusion
When comparing conventional and super seeder technologies in the districts of Karnal and Kaithal, there are noteworthy distinctions in resource utilization patterns. Conventional methods exhibit resource overuse tendencies, whereas super seeder technology leans towards underutilizing machinery resources while possibly overemphasizing other resource inputs. A crucial observation is that super seeder technology demonstrates a more favourable return to scale than conventional approaches. Regression analysis shows that seed and fertilizer costs play a pivotal role in positively influencing wheat production. While positively impactful, human labor lacks statistical significance, and irrigation shows a statistically significant negative impact on wheat yield. Conversely, in the context of conventional techniques, machine labour and plant protection exhibit negative effects on the wheat yield that are not statistically significant. However, in the case of super seeder technology, these inputs display significantly positive effects. It is intriguing to note that seed inputs yield a negative impact despite their significant costs. The observed upward trend in output elasticity suggests potential resource underutilization. Specifically, human labour significantly and negatively affects wheat yield, while fertilizer costs and irrigation, although non-significant, positively influence wheat yield.
References
12 in the original paper- Bera A. Resource Use Efficiency and Optimization Techniques in Indian Agriculture. Agriculture food and E-newsletter. 2021;5(3):478-481.
- Bhatt R, Kukal SS, Busari MA, Arora S, Yadav M. Sustainability issues on rice wheat cropping system. International Soil and Water Conservation Research 2016;4(1):64-74.
- Bhatt R, Singh P, Hossain A, Timsina J. Rice-wheat system in the north-west IndoGangetic Plains of South Asia: issues and technological interventions for increasing productivity and sustainability. Paddy and Water Environment. 2021;19(3):345-65. https://doi.org/10.1007/s10333-021-00846-7.
- Brar AS, Walia US. Studies on composition of weed flora of wheat (Triticum aestivum L.) in relation to different tillage practices under rice-wheat cropping system. Indian. Journal of Weed Science. 2007;39:190-6.
- Ghasemi-Mobtaker H, Kaab A, Rafiee S. Application of life cycle analysis to assess environmental sustainability of wheat cultivation in the west of Iran. Energy. 2020;193:116768. https://doi.org/10.1016/j.energy.2019.116768.
- Singh G, Singh P, Sodhi GPS. Assessment and analysis of agriculture technology adoption and yield gaps in wheat production in sub-tropical Punjab. Indian Journal of Extension Education. 2017;53:70-7.
- Singh P, Benbi DK. Nutrient management impacts on net ecosystem carbon budget and energy flow nexus in intensively cultivated cropland ecosystems of northwestern India. Paddy and Water Environment. 2020;18(4):697-715. https://doi.org/ 10.1007/s10333020-00812-9.
- Singh P, Singh G, Sodhi GPS. Energy and carbon footprints of wheat establishment following different rice residue management strategies vis-a-vis ` conventional tillage coupled with rice residue burning in north-western India. Energy 2020;200:117554. https://doi.org/10.1016/j.energy.2020.117554.
- Singh G, Singh P, Sodhi GPS, Tiwari D. Energy auditing and data envelopment analysis (DEA) based optimization for increased energy use efficiency in wheat cultivation (Triticum aestivum L.) in North-Western India. Sustainable energy technologies and assessments. 2021;47:101453.
- Tilman D, Balzer C, Hill J, Befort BL. Global food demand and the sustainable intensification of agriculture. Proceedings of the National Academy of Sciences USA 2011;108(50):20260-4.
- Tilman D, Kenneth G, Cassman KG, Matson PA, Naylor R, Polasky S. Agricultural sustainability and intensive production practices. Nature. 2002;418:671-7.
- West PC, Gibbs HK, Monfreda C, Wagner J, Barford CC, Carpenter SR, et al. Trading carbon for food: Global comparison of carbon stocks vs. crop yields on agricultural land. Proceedings of the National Academy of Sciences USA. 2010;107(46):19645-8.