
Research article · 2023 · Full text
International Journal of Statistics and Applied MathematicsMortality graduation using a rating up approach
Volume 8(5) · Pages 130–134 · DOI: 10.22271/maths.2023.v8.i5b.1302 ↗
Research areasInsurance and Financial Risk ManagementInsurance, Mortality, Demography, Risk ManagementProbability and Risk Models
Abstract
Author-writtenModeling the risk profile of a heterogeneous life from unreported risks is complex. Insurance firms routinely disregard unreported risk factors perhaps because of difficulties in modeling. The scientific interest of the study is to account for unreported heterogeneity factors using a compound process. For comparison reasons the gamma (mostly applied in literature) and non-central gamma compound process are suggested with the generalized exponential and generalized Weibull baselines to account for unreported heterogeneity. In this study, maximum likelihood estimation is used to calibrate the base force of mortality distributions using a large Kenyan insurer term insurance data. Subsequently, the performance of the candidate models described above is compared following the criteria information values. The findings show that the non-central gamma generalized Weibull is significant to model the insurers’ claims events.
Summary
Source-checkedPlain-language reading of the full paper, prepared with AI and checked against the text. Each point links to the authors' own words.
Why it matters
- Ignoring unreported risk factors (heterogeneity) in life insurance can lead to biased pricing of products and incorrect allocation of reserves. View evidence ↗
- Rating up models are used in life insurance to quantify population-level heterogeneity that stems from risks not reported during underwriting. View evidence ↗
- The study aims to address unreported heterogeneity by utilizing a compound process to improve the underwriting process. View evidence ↗
The question
- The research aims to demonstrate that the gamma rating up distribution overestimates intensity rates compared to the non-central gamma (NCG) and to show that the NCG mixture is effective for graduating crude intensity rates. View evidence ↗
What they did
- The study analyzed 732 term insurance contracts from a large Kenyan insurance company spanning the years 2010 to 2015. View evidence ↗
- The dataset was used to calculate crude intensity rates and times-to-death for policyholders aged 22 to 64. View evidence ↗
- The researchers compared gamma and non-central gamma compound processes using generalized exponential and generalized Weibull baselines. View evidence ↗
- Maximum likelihood estimation (MLE) was employed to calibrate the base force of mortality distributions. View evidence ↗
What they found
- The gamma-generalized Weibull (G-GW) model overestimated intensity rates across all ages when compared to the non-central gamma-generalized Weibull (NCG-GW) model. View evidence ↗
- The NCG-GW model demonstrated a good fit to the crude intensity rates, with a chi-squared p-value of 0.2379, which is greater than 0.01. View evidence ↗
- The Kolmogorov-Smirnov (KS) test also indicated a good fit for the NCG-GW distribution, with a p-value of 0.06448. View evidence ↗
What it means
- The authors conclude that using a gamma rating up distribution can lead to inappropriate valuations and excessively high prices, which may harm the marketability of term contracts. View evidence ↗
- The non-central gamma (NCG) compound process is recommended for term assurance valuations because it accounts for time-varying unreported heterogeneity effects. View evidence ↗
Visual summary
1 visualsIllustrations explain the paper; they do not show study data.
Comparison of Rating Up Distributions
AI-generated conceptual illustration (Abstract mathematical curves representing mortality intensity over time). It explains the idea and does not show study data.
View source evidence ↗Figures & tables
From the original paper Table 1
 Table 2
 Table 3
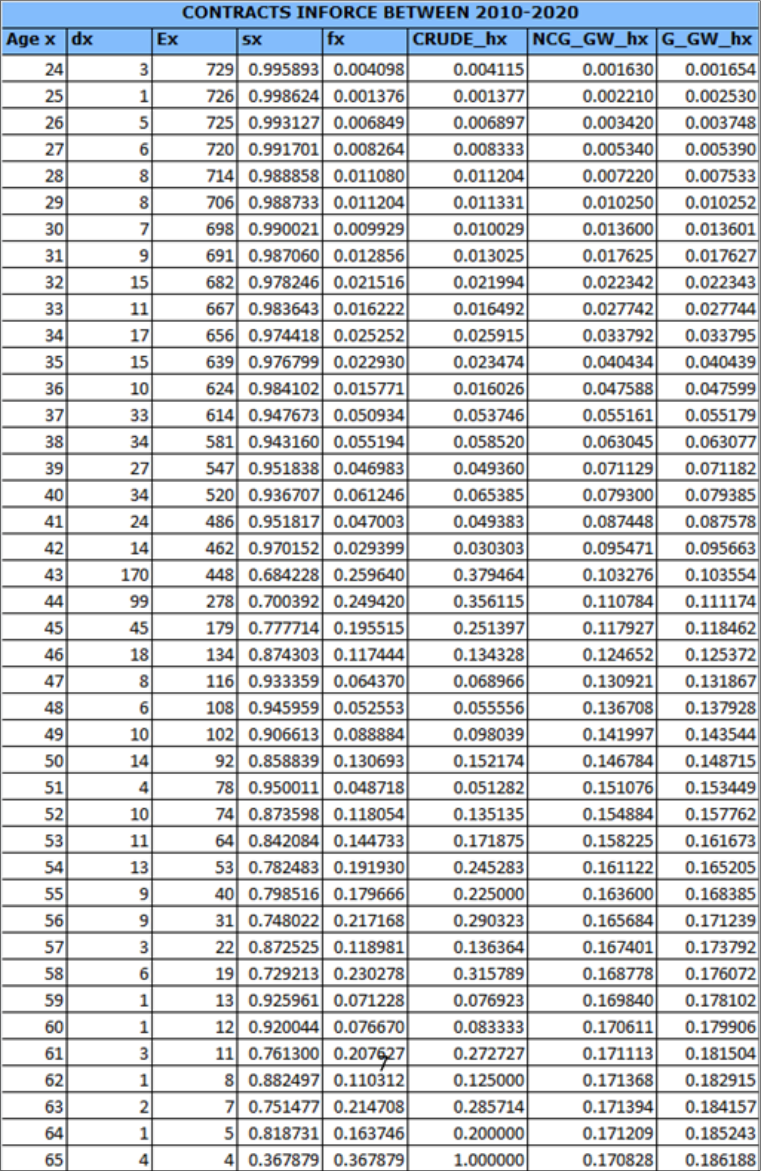 Figure 1
Introduction
Rating up theory was first proposed by Beard (1959) [2] to account for age-pattern of mortality, where the term "longevity factor" was used instead of rating up. Homogeneity is presumed with respect of reported risk factors in standard models. The implication is that study subjects are pooled in the same risk profile at a given age. However, statistical evidence suggest a different model as indicated by several researchers, such as Su & Sherris (2012) [12] ; Gatzert et al., (2012) [7] ; Onchere (2013) [10] ; Fong (2015) [6] ; Olivieri & Pitacco (2016) [9] and Pitacco (2018) [11] with references therein. To adequately price and allocate reserves that represent the insurance contracts all relevant factors affecting mortality needs to be considered. Neglecting unreported heterogeneity could result in biased insurance products pricing and reserves allocation. This research outlines a heterogeneous model that will improve the underwriting process to ensure fair pricing and reserving of life products consistent with the insured risk. The mortality model selected in valuation determines how term insurance and annuity products are priced (Batty et al., (2010) [1] ; Gildas et al., (2018) [8] . Life insurance-based rating up models measure population-level heterogeneity caused by unreported risks. On the other hand, heterogeneity caused by reported risk factors is determined during underwriting before issuing a policy to guarantee an optimal assignment of premium equivalent to insured risk for each contract. Excluding relevant factors or relying solely on age and sex may contribute to incorrectly priced assurance products. Term insurance contract is a policy in which a certain payment, say, KES A per annum, is provided if the insured passes on within a stated period, say m years. This benefit is determined from the EPV as 𝐴 ∫ 𝑣 𝑡 𝑆 𝑥 (𝑡)ℎ(𝑥 + 𝑡)𝑑𝑡 𝑚 0 (1) Where: 𝑥 is the insured's age, 𝑣 𝑡 represents the present value interest factor, 𝑆 𝑥 (𝑡)represents the survivor function and ℎ(𝑥 + 𝑡) the intensity rate. The type of mortality model applied to ℎ(𝑥 + 𝑡) influences how the policy is priced.
Methodology
For this study, we considered 732 term insurance contracts between calendar years 2010-2015 from a large Kenyan insurance company. Demographic information of policyholders includes; age, date of signing the contract and mortality date. This data-set will be used to compute the times-to-death and crude intensity rates experienced by the insured in the 22-64 age group. Our aims of study are firstly to show that when the gamma is applied as a rating up distribution the intensity rates are overestimated at all ages compared to the non-central gamma (NCG). Secondly, is to show the relevance of the NCG rating up mixture to graduate the insurance firm's crude intensity rates. Here, force mortality is presumed to be a pair-wise constant, assuming a fixed value across all ages consistent with Brouhns et al., (2002) [3] and Dodd et al., (2018) [5] assumption. We further assumed our rating up model has no observed covariates as only survival data was obtained for this analysis also in life insurance due to the underwriting procedures groups should be homogeneous with respect to observed covariates. Finally, and as given in the actual dataset we presumed that policyholders purchase term assurance policy at the age of 22-64 years.
The proposed model
The generalized Weibull (GW) density function is represented as
We can express the survivor, baseline hazard and cumulative hazard rates as
The generalized exponential (GE) function is derived from the GW distribution when 𝜌 = 1. Putting 𝜌 = 1 in Equations (2, 3) leads to
Firstly, using GE distribution as the baseline intensity for gamma rating up, we can generate an intensity rate for gamma-GE rating up mixture as follows
The NCG is further adapted as a rating up distribution resulting in the NCG-GE intensity rate given by
Where, 𝑏 < 1, 𝑏 > 1, 𝑎𝑛𝑑 𝑏 = 1 represent decreasing, increasing, and constant GE intensity rate, respectively.
Secondly, the GW distribution is proposed as the base force of mortality with the gamma rating up giving the gamma-GW (G-GW) intensity rate expressed as
Similarly, the NCG-GW intensity rate is described as
where (𝜌 ≤ 1) and (𝑏𝜌 ≤ 1) represent monotonically decreasing function and (𝜌 ≥ 1) and (𝑏𝜌 ≥ 1) represents monotonically increasing function; unimodal if (𝜌 < 1) and (𝑏𝜌 > 1) and bath-tub shaped if (𝜌 > 1) and (𝑏𝜌 < 1).
Data analysis, results and discussions 3.1 Parameter Estimation
Butt & Haberman (2004) [4] apply the rating up-based survival model to insurance. The authors first consider different choices of models and then apply them to two large life insurance mortality datasets. The results indicate a potential range 𝜎 2 ≈ (2.916, 14.444) in an insured population with 𝜎 2 = 14% for the heterogeneous case. From the findings of the investigation by Butt & Haberman (2004) [4] , in this study we consider 𝜎 2 = 14% for the heterogeneous case.
The MLE approach is concerned with obtaining parameter values say, (𝑏, 𝜆, 𝜌) that maximizes the probability of observing the data D given those parameters, 𝑝(𝐷| 𝑏, 𝜆, 𝜌). The likelihood function gives the probability of the observed sample generated by the model. Generally, maximization of the likelihood function to find the ML estimates is done algebraically, but can be computational intensive. In this study, the MLE algorithm is implemented using stats 4 package in R.
For the Generalized Weibull with PDF 𝑓 (𝑡) = 𝑏(1 -𝑒𝑥𝑝 (-𝜆𝑡 𝜌 )) 𝑏-1 • 𝜆𝜌𝑡 𝜌-1 • 𝑒𝑥𝑝 (-𝜆𝑡 𝜌 ); 𝑡 > 0, 𝜌, 𝑏, 𝜆 > 0.
The log-likelihood function is derived as
For the Generalized Exponential with PDF
The log-likelihood function is derived as
The parameter estimates and criteria values is shown in the table below;
Discussion
Stats 4 provides the AIC and BIC measures that penalizes both excessive use of parameters and poor data fitting. From the above results, the least AIC and BIC suggests that the GW gives a better fit. The G-GW and NCG-GW rating up models given in Equations ( 6) and ( 7) respectively are as shown in Figure 1 where t is the time-to-death, σ 2 = 0.14, λ = 0.031367, b = 80.3076, ρ = 1.3477; h0(t)~GW (0.031367, 80.3076, 1.3477).
In Figure 1 graduation is done using the G-GW and NCG-GW rating up model both calibrated on the real term assurance timesto-death data. This is compared with the real term assurance intensity rates. As shown the G-GW overestimates the intensity rate at all ages compared to the NCG-GW model. The NCG-GW is observed to fit well to the actual claims experience hazards. The chi-square test Table 2 and Kolmogorov-Smirnov (KS) hypothesis test Table 3 for overall goodness of fit is significant for NCG-GW. The chi-squared goodness-of-fit test has p-value greater than 0.01, indicating that the model fits well. Similarly, for KS goodness of fit test p-value > 0.01, indicating goodness of fit for the distribution.
| Name | Value |
|---|---|
| Chi-squared statistic | 1722 |
| Degree of freedom | 1681 |
| Chi-squared p-value | 0.2379 |
Table text extracted from the original PDF; superscript letters are shown inline. The original table image is below.
View original table image
Discussion
Our goal in this paper is to model unreported heterogeneity by applying the gamma and NCG rating up distributions. We applied our model to real term insurance times-to-death data. Based on maximum likelihood, the GW baseline fits better as the AIC & BIC is lower than the GE baseline. As shown in Figure 1 the G-GW model overestimates the intensity rates at all ages compared to the NCG-GW model. According to chi-squared goodness of fit test Table 2 and KS hypothesis test Table 3, the NCG-GW shows better fitness to insurer's claims experience.
Conclusion
Life Insurance-Based rating up models measure population-level heterogeneity caused by unreported risks. On the other hand, heterogeneity caused by reported risk factors is determined during underwriting before issuing a policy to guarantee an optimal
Figures and tables from the paper
| Baseline model | Parameter estimates | AIC | BIC |
|---|---|---|---|
| 1. Generalized Exponential | λ = 0.14537, b = 286.57 | 4995.128 | 5004.32 |
| 2. Generalized Weibull | λ = 0.031367, b = 80.3076, ρ = 1.3477 | 4960.588 | 4974.376 |
Table text extracted from the original PDF; superscript letters are shown inline. The original table image is below.
View original table image
References
10 in the original paper- Beard RE. Note on some mathematical mortality models. The Lifespan of Animals. In: Wolstenholme, G.E.W. and O Conner, M., Eds., Ciba Foundation Colloquium on Ageing, Little, Brown and Company, Boston. 1959;5:302-311. DOI:10.1002/9780470715253.app1
- Brouhns N, Denuit M, Vermunt KJ. A Poisson log-bilinear regression approach to the construction of projected life tables. Insurance: Mathematics and Economics. 2002;31:373-393.
- Butt Z, Haberman S. Application of frailty-based mortality models using generalized linear models: Astin Bulletin. 2004;34(1):175-197.
- Fong HJ. Beyond Age and Sex: Enhancing Annuity Pricing: The Geneva Risk and Insurance Review. 2015;40:133-170.
- Gatzert N, Gudrun SH, Hato S. Optimal Risk Classification with an Application to Substandard Annuities, North American Actuarial Journal. 2012;16(4):462-486.
- Gildas R, Francois D, Enkelejd H, Youssouf T. On age difference in joint lifetime modeling with life insurance annuity applications: Annals of Actuarial Science. 2018;12(2):350-371.
- Olivieri A, Pitacco E. Frailty for Life Annuity Portfolios: Risks. 2016;4:39.
- Onchere WO. Frailty models' applications in pension schemes. Masters Thesis, University of Nairobi, 2013.
- Pitacco E. Heterogeneity in mortality. A survey with an actuarial focus: Working research 2018/19. Australian Research Council Centre of Excellence in Population Ageing Research, University of New South Wales, Sydney; c2018.
- Su S, Sherris M. Heterogeneity of Australian population mortality and implications for a viable life annuity market. Insurance: Mathematics and Economics. 2012;51(2):322-332.