
Research article · 2023 · Full text
International Journal of Geography Geology and EnvironmentImpact of food and nutrition on health status of tribal community of north 24 Paraganas in West Bengal
Volume 5(2) · Pages 136–150 · DOI: 10.22271/27067483.2023.v5.i2b.183 ↗
Research areasChild Nutrition and Water Access
Abstract
Author-writtenThe paper represents the nutrition which integral to health promotion and disease prevention. Information from many disciplines, including anthropology, biology, biochemistry, economics, epidemiology, food science and technology, genetics, physiology, psychology, and sociology, are applied in nutritional studies. The paper also consider what people eat and drink, and take as dietary supplements, during different life stages and over time. Lama, Pravhat (2017)., They focus on interconnections to build evidence for public policy, health system, and environmental improvement strategies mostly the tribal and other back ward class people of north 24 paraganas in west Bengal According to research, it is needed for tribal people to sustain the Micronutrients which are vitamins and minerals that are required for our body in minute amounts to fight diseases, to support metabolic activities and protect against infections. These are essential for maintenance of health and longevity. The backward classes and tribal people works include sub caste people from primitive tribal groups, workers of closed industry, gardens, pavement dwellers of north affected people, drought affected of Purulia, residents of Darjeeling hill area and inhabitants of Jangalmahal. Singh, Abhishek (2020)., The paper also representes the facilities of Sufal Bangla, a competitive retail daily use prime vegetable outlet - is significantly important for ensuring food and nutritional security for the hundreds of millions of tribal people that still live below the poverty line in our state besides it also help for raising rural incomes and generating millions of on-farm and non-farm employment opportunities, eradication poverty and usher in a prosperity movement throughout beautiful rural Bengal.
Summary
Source-checkedPlain-language reading of the full paper, prepared with AI and checked against the text. Each point links to the authors' own words.
Why it matters
- Nutrition is considered essential for promoting health and preventing diseases. View evidence ↗
- Tribal populations require micronutrients, such as vitamins and minerals, to support metabolism, fight diseases, and protect against infections. View evidence ↗
- According to the National Nutrition Monitoring Bureau, approximately 50% of men and women in India experience chronic energy deficiency. View evidence ↗
The question
- The study aims to determine the impact of food and nutrition on the health status of the Santhal and Munda tribal communities in North 24 Paraganas, West Bengal. View evidence ↗
What they did
- The researchers used a survey-based method employing simple random sampling and stratified random sampling to analyze primary and secondary data. View evidence ↗
- The study focused on the Bagdah-I block and two Gram Panchayat regions (Koniarya-I and Koniarya-II), surveying 200 families. View evidence ↗
- Primary data was gathered from Mundari residents in the villages of Karanga, Jhupo, and Amdobe within the Bagdah block. View evidence ↗
What they found
- The mean availability of the measured foods was 41.6525% for the Santhal community and 19.605% for the Munda community. View evidence ↗
What it means
- The authors conclude that it is necessary to ensure sustainable health and nutrition levels, particularly for female tribal groups. View evidence ↗
Visual summary
2 visualsIllustrations explain the paper; charts are replotted from the paper's own table values.
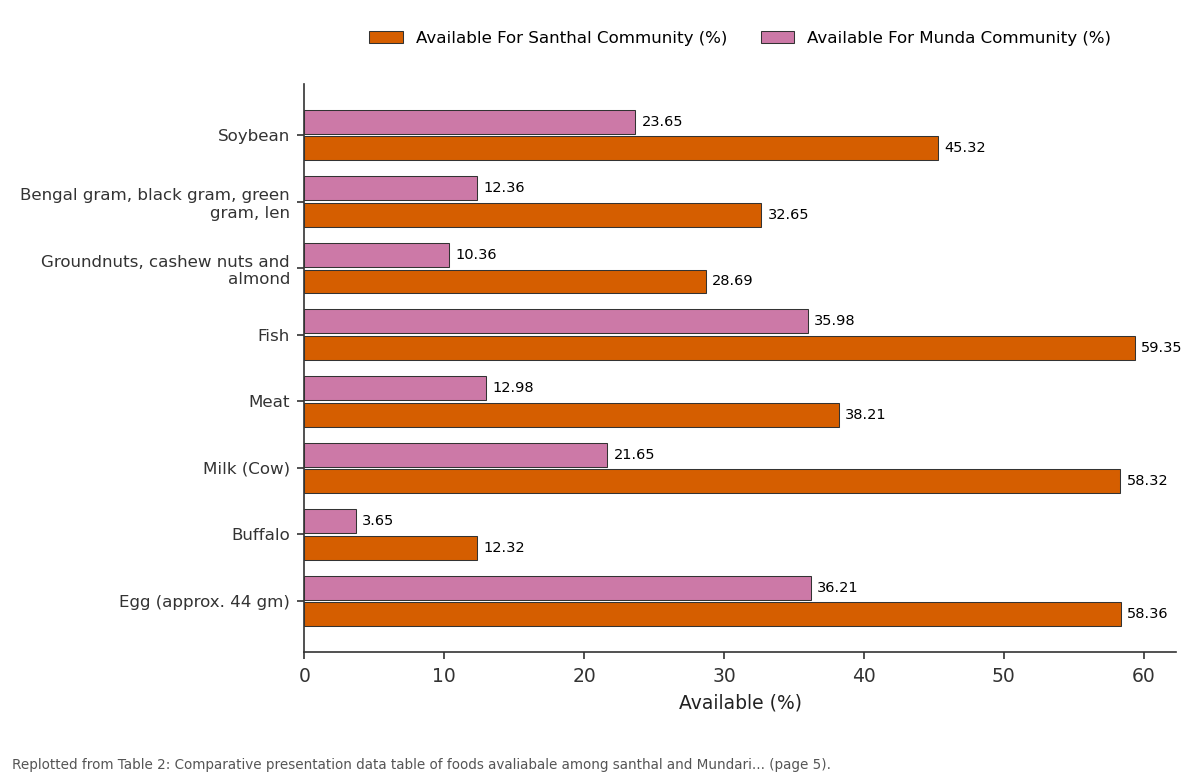
Available For Santhal Community (%) and Available For Munda Community (%): Soybean vs Bengal gram, black... vs Groundnuts, cashew nuts... vs Fish vs Meat
Replotted from Table 2 (page 5) of the original paper. Every bar is the paper's own table value.
View source evidence ↗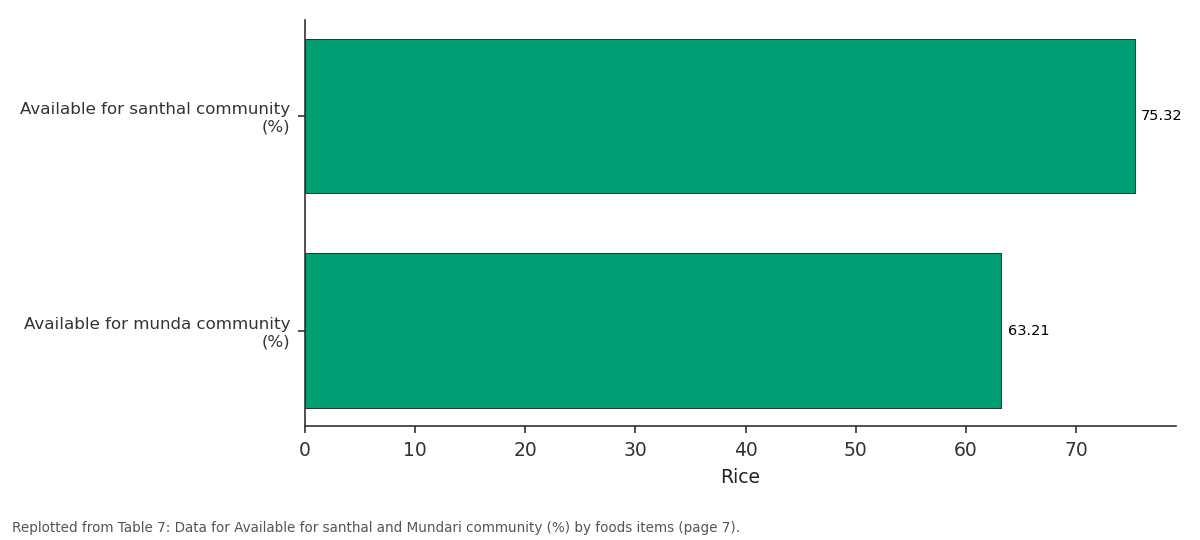
Rice: Available for santhal... vs Available for munda...
Replotted from Table 7 (page 7) of the original paper. Every bar is the paper's own table value.
View source evidence ↗Figures & tables
From the original paper Figure 1Page 2
 Figure 2Page 2
 Figure 3Page 3
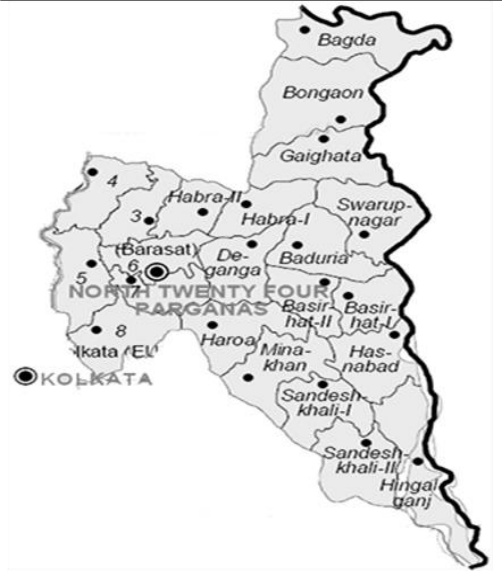 Figure 5Page 3
 Figure 4Page 3
 Figure 6Page 3
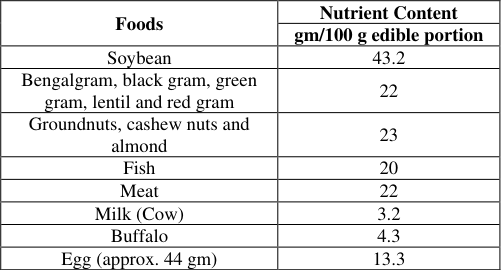 Table 1Page 4
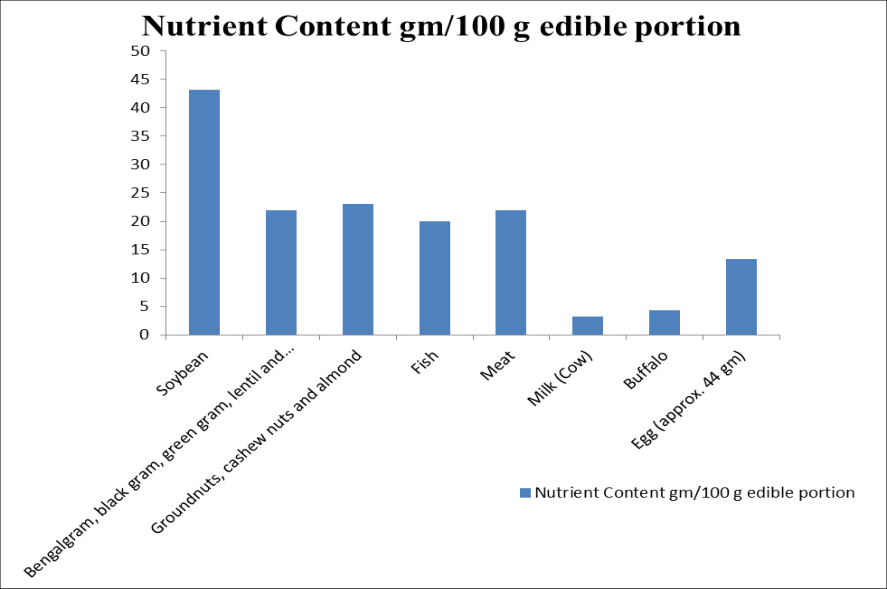 Figure 7Page 4
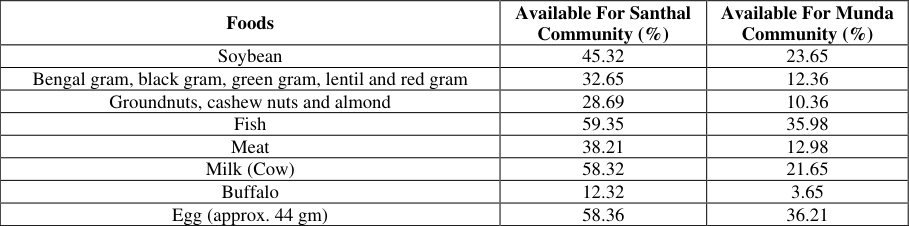 Table 2Page 5
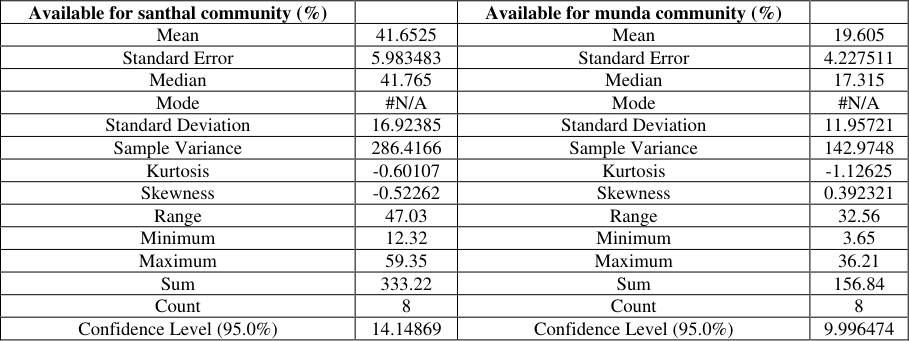 Table 3Page 5
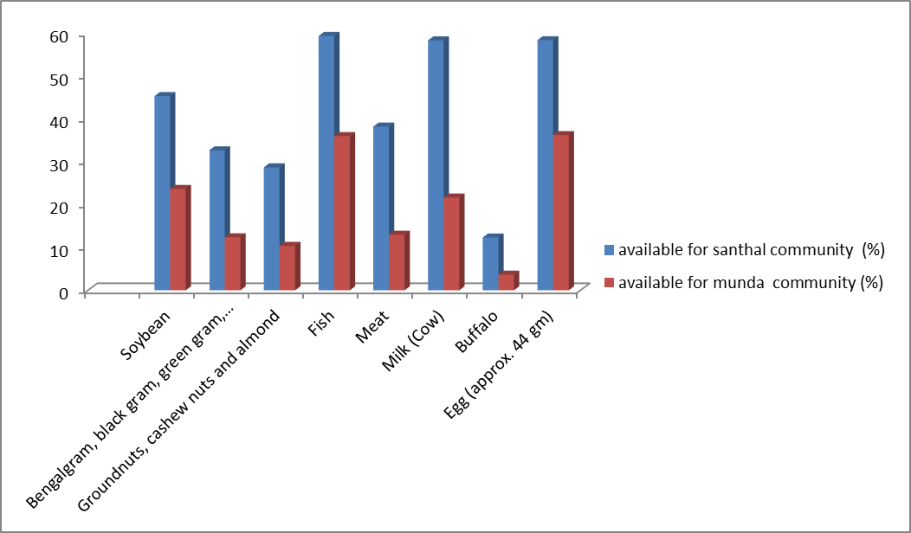 Figure 8Page 5
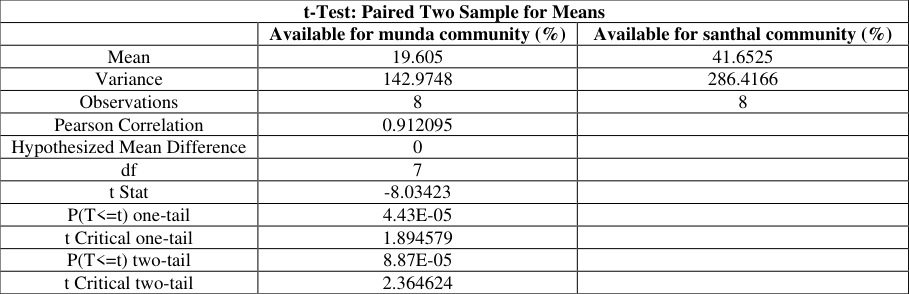 Table 4Page 6
 Table 5Page 6
 Figure 9Page 6
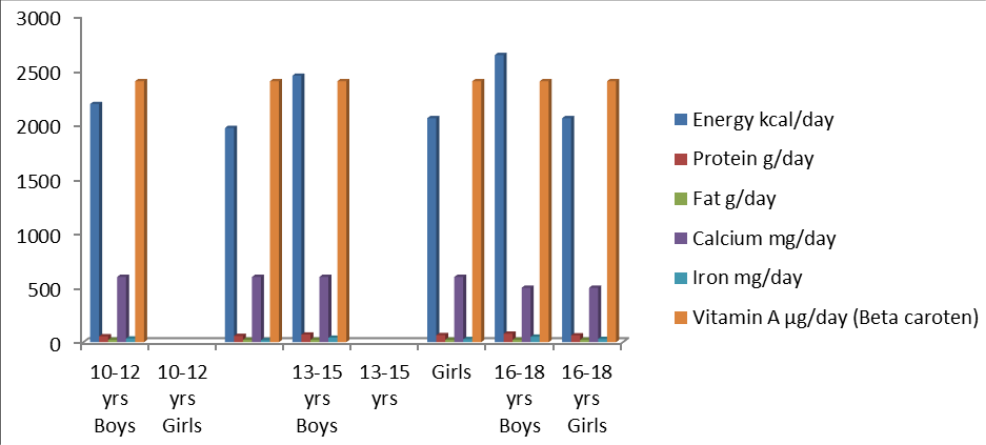 Figure 10Page 6
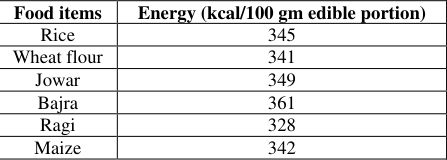 Table 6Page 7
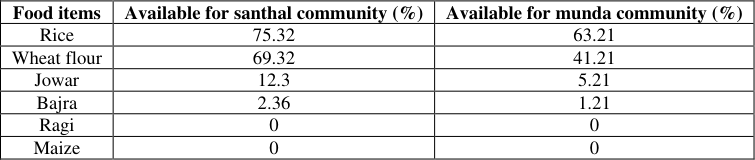 Table 7Page 7
 Figure 11Page 7
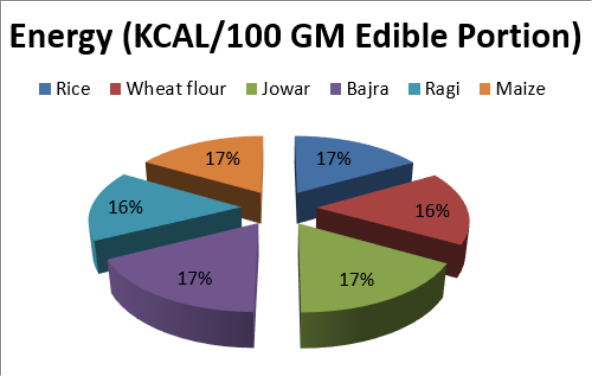 Figure 12Page 7
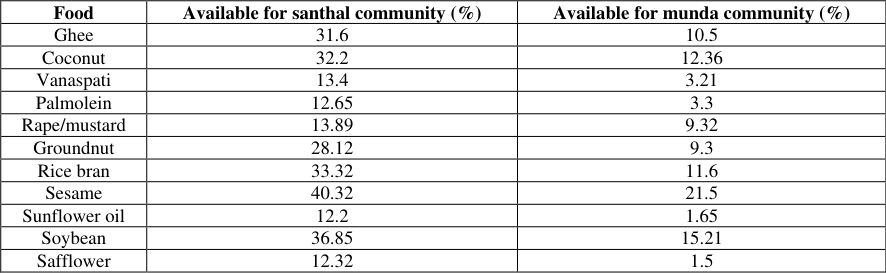 Table 8Page 8
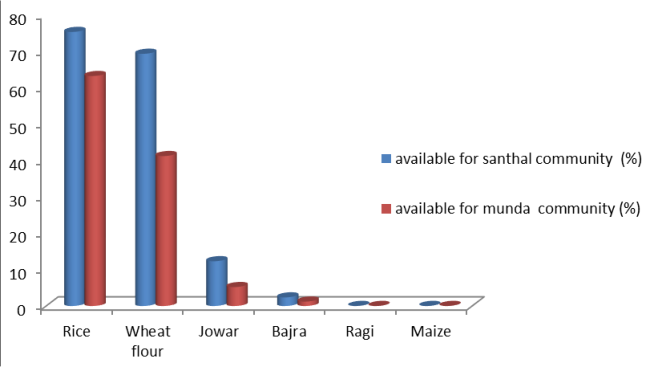 Figure 13Page 8
 Figure 14Page 8
 Table 9Page 9
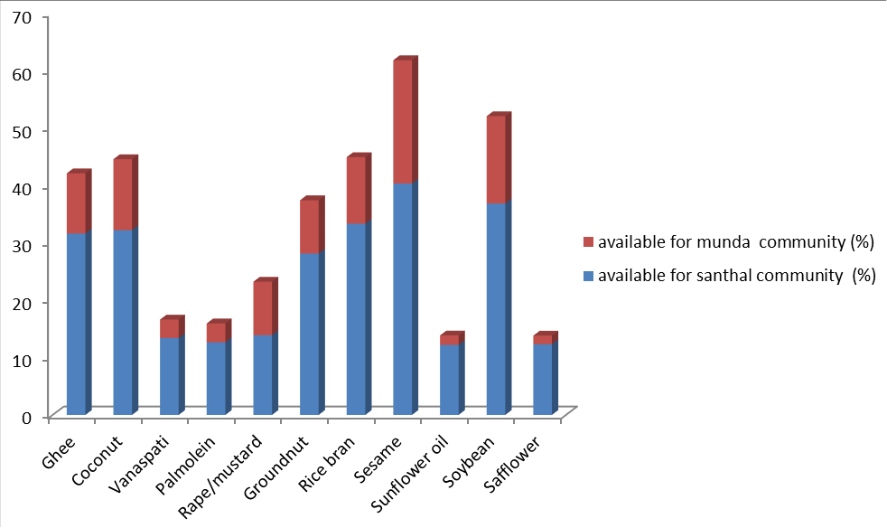 Figure 15Page 9
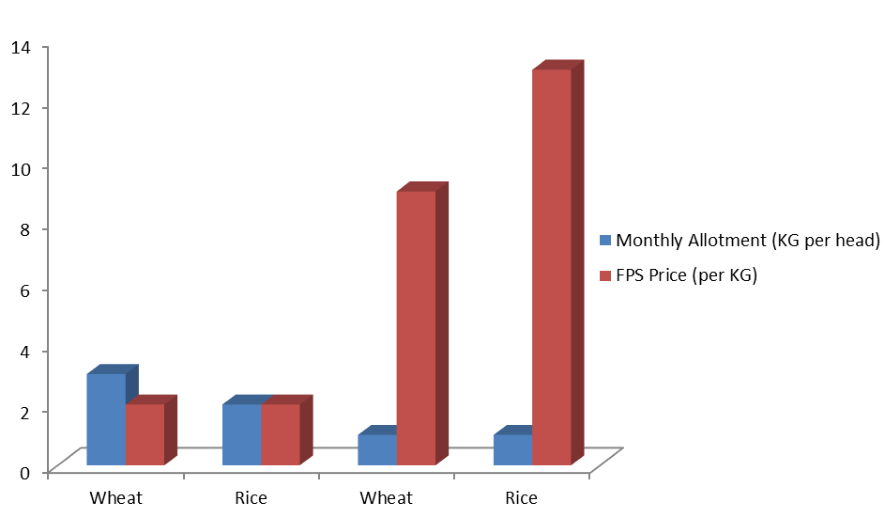 Figure 16Page 9
 Table 10Page 10
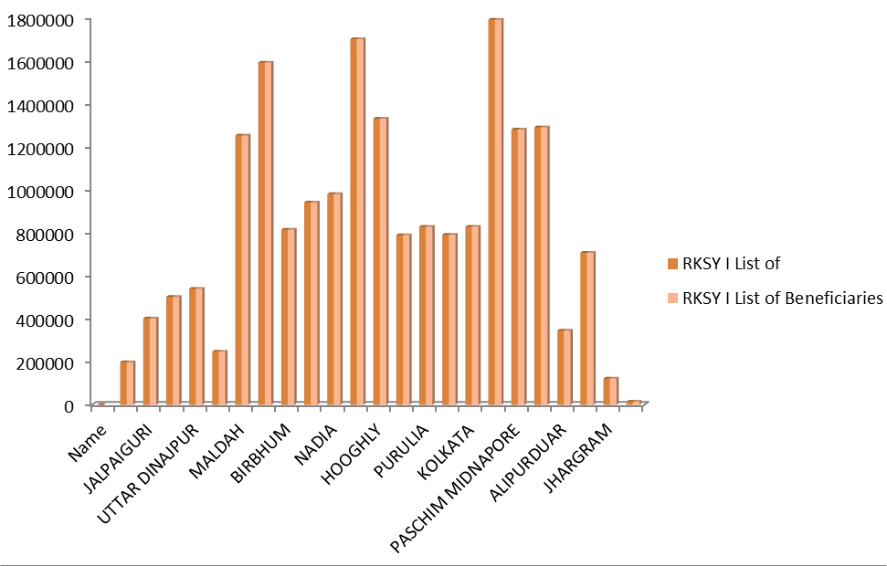 Figure 17Page 10
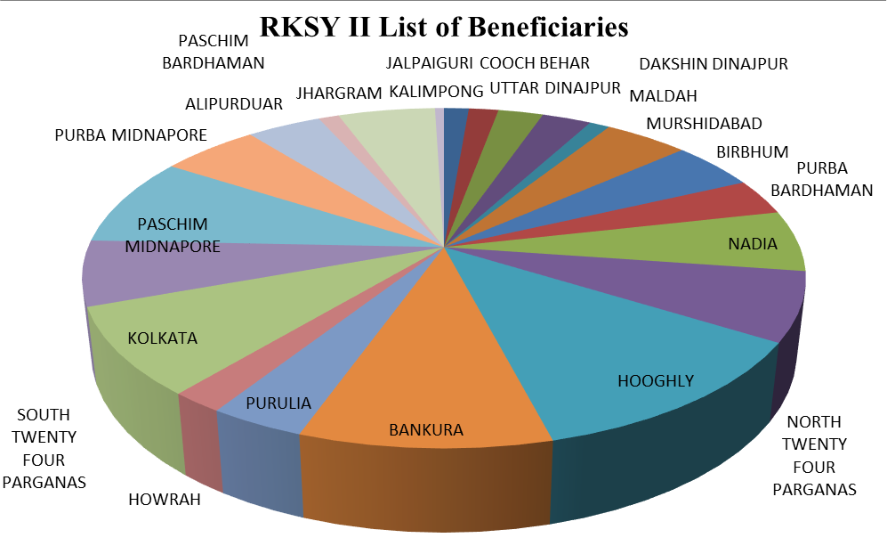 Figure 18Page 10
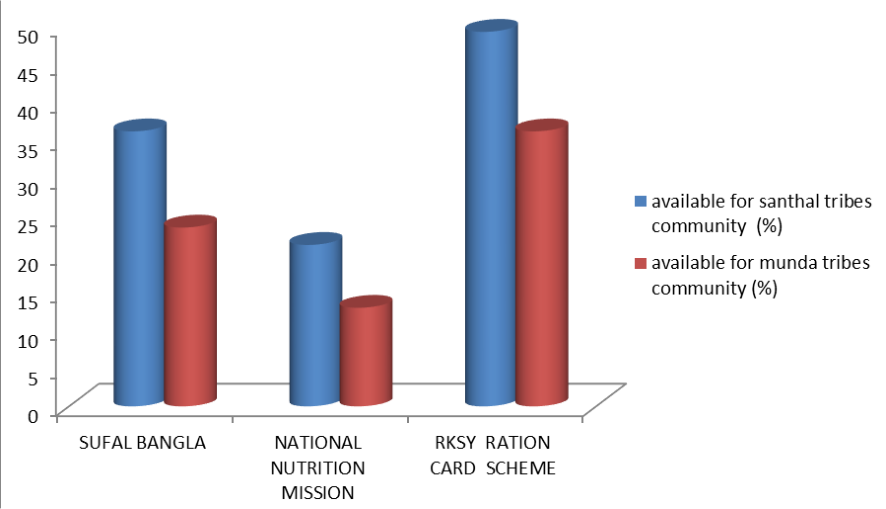 Figure 19Page 11
 Figure 20Page 12
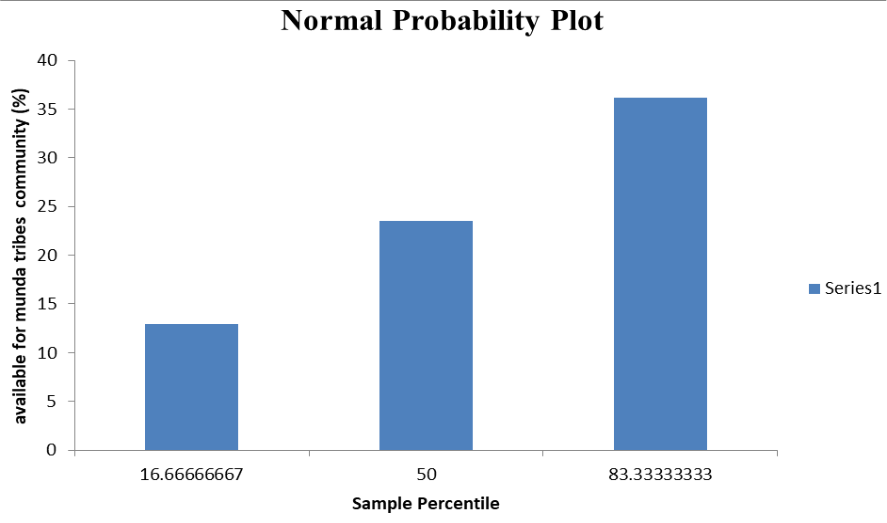 Figure 21Page 12
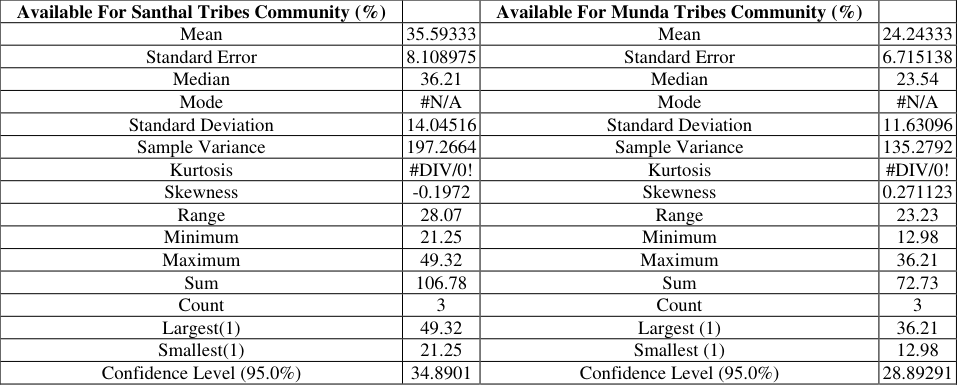 Table 11Page 13
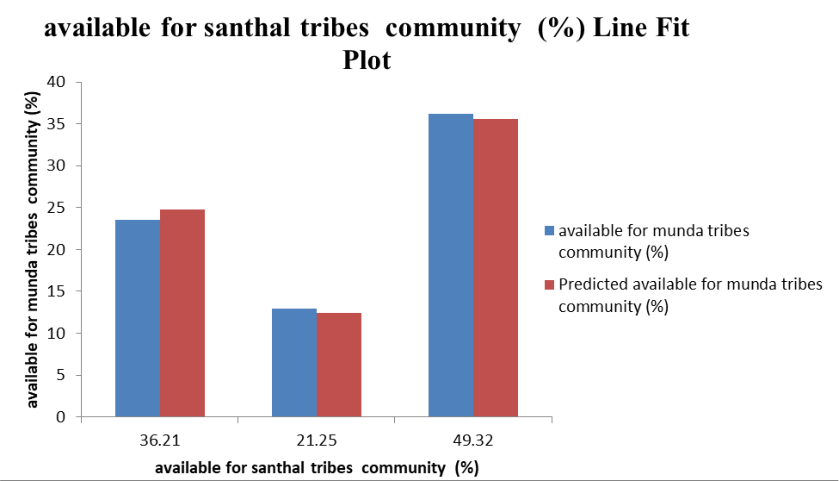 Figure 22Page 13
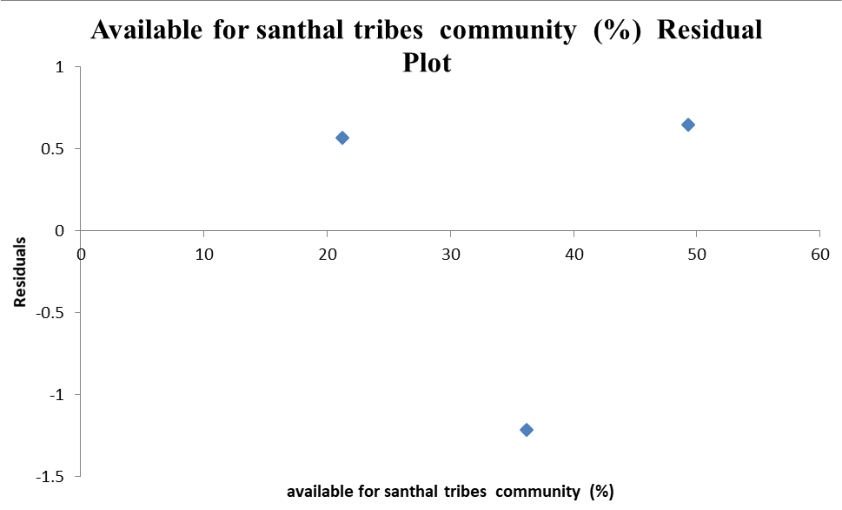 Figure 23Page 13
 Table 12Page 14
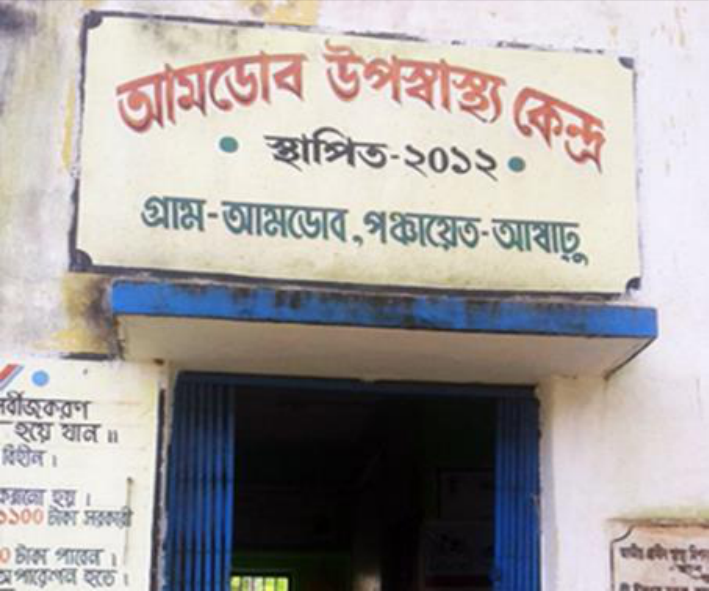 Figure 24Page 14
Introduction
The Ministry of Tribal Affairs is responsible for the overall development of the scheduled tribes in India. This Ministry was set up in 1999 after the bifurcation of the Ministry of Social Justice and Empowerment with the objective of providing a more focused approach on the integrated socio-economic development of the Scheduled Tribes (STs), the most underprivileged of the Indian Society, in a coordinated and planned manner. The district lies within the Ganga-Brahmaputra delta. The major distributary of river Ganga that is river Hooghly flows along the western border of the district. There are many other distributory branches, sub-branches of Ganga River and other local rivers, which include the Ichhamati, Jamuna, and Bidyadhari. Lama, Pravhat (2017) [14] . As a scientific field, nutrition is integral to health promotion and disease prevention. Information from many disciplines, including anthropology, biology, biochemistry, economics, epidemiology, food science and technology, genetics, physiology, psychology, and sociology, are applied in nutritional studies. Scientists consider what people eat and drink, and take as dietary supplements, during different life stages and over time. Bowden, Mitchell (2009) [10] . They focus on interconnections to build evidence for public policy, health system, and environmental improvement strategies. Human beings need adequate energy to carry out their daily routine physical work, maintain body temperature, metabolic activity and to support growth. The survey conducted by National Nutrition Monitoring Bureau (NNMB) revealed that in India nearly 50% of men and women suffer from chronic energy deficiency.
2. To know the impact of food and nutrition on health status of munda tribal community of north 24 paraganas in West Bengal.
Hypothesis 1. H01:
There exists no relation between the impact of food and nutrition and health status of santhal tribal community of north 24 paraganas in West Bengal. 2. H02: There exists no relation between the impact of food and nutrition on health status of munda tribal community of north 24 paraganas in West Bengal.
Research question
1. What is the impact of food and nutrition on health status of santhal tribal community of north 24 paraganas in west Bengal? 2. What is the impact of food and nutrition on health status of munda tribal community of north 24 paraganas in west Bengal?
Methodology/procedure to be followed Data collection and analysis Primary data was collected from Mundari people of Karanga, Jhupo, Amdobe villege of Bagdah block of north 24 paraganas. Secondary data was colleted from draft report -2021 n.24.pgs, health center, block office, co-oparative office, primary and high school of koniarya G.P of badgha block.
Sampling method
The research was conducted by survey based method and also use simple random sampling and stratified rndom sampling for analysis of primary and secondary data.
Population and sample
One block (bagdha-I) was observed and Two g.p region (koniarya -i and koniaryaii) was observed. Survey was conducted on 200 families. Sample size should be 1200 (public survey).
Delimitation of study
The area of research was delimited in only one block as bagdha block and two grame panchayate as a kaniyara -I and kaniyara -II GP.
The research was delimited only mundari ans santhal sub caste of Korongo, Jupo and Amdobe villeges under koniarya -I and II gram panchayat of Bagdah block.
The research was also delimited only 600 male and 600 female tribal resident of Korongo, Jupo, and Amdobe villege.
Socio-economic status
The Lal, Rattan (2017) [19] When it comes to child malnutrition, children in low-income families are more malnourished than those in high-income families. PDS system in India which account for the distribution of wheat and rice only, by which the proteins are insufficient by these cereals which leads to malnutrition also. One cultural belief that may lead to malnutrition is religion. Among these is the influence of religions, especially in India are restricted from consuming meat. Also, other Indians are strictly vegan, which means, they do not consume any sort of animal product, including dairy and eggs. This is a serious problem when inadequate protein is consumed because 56% of poor Indian households consume cereal to consume protein. It is observed that the type of protein that cereal contains does not parallel to the proteins that animal products contain. This phenomenon is most prevalent in the rural areas of India where more malnutrition exists on an absolute level. Whether children are of the appropriate weight and height is highly dependent on the socio-economic status of the population. Children of families with lower socioeconomic standing are faced with sub-optimal growth. While children in similar communities have shown to share similar levels of nutrition, child nutrition is also differential from family to family depending on the mother's characteristics, household ethnicity, and place of residence. It is expected that with improvements in socio-economic welfare, child nutrition will also improve.
Significance of nutrition
Bowden, Mitchell (2009) [10] for the body to function properly, grow appropriately, and keep healthy, one must consume enough macronutrients (proteins, carbs, fats, and water) and micronutrients (vitamins and minerals). As we have noticed, processed, sweet, fatty, and salted foods drain the body and cannot function properly. On the other hand, consuming fresh, whole-natural meals fuels the body by producing the necessary energy, metabolic activity, micronutrient shortages, chronic disease prevention, general health promotion and well-being. Proteins, carbs, fats, vitamins, minerals, fibre, and water are the seven main types of nutrients that the healthy human body requires to survive. We need a lot of macronutrients, although we can get by with fewer micronutrients (vitamins and minerals). Proteins: Our body's immune system and muscles are both strengthened by protein. Morales, Alfonso (2011) [7] Carbohydrates: Carbohydrates are considered to as energy providing foods. They give the body the energy it requires to function. Carbs account for up to 65% of our energy. Due to the ease of conversion into energy, they serve as the body's primary fuel source. Typically, this energy takes the form of glucose, which all of our body's tissues and cells can use immediately. Simple carbohydrates and complex carbohydrates are two different types of carbohydrates. Carbohydrates are the main reason for the production of ketones. Good examples of carbohydrates are bread, potatoes, pasta, soda, chips, cookies/biscuits, puddings, cakes, sugar, bananas, etc. Singh, Abhishek (2020) [16] , Fats: Including fats in your diet is crucial because they can give your body energy. While some forms of dietary fats (Monounsaturated fatty acids and Poly unsaturated fatty acids) may be better for you than others (Saturated fatty acids and Trans-fat), they are still a vital element of your diet and help your body produce hormones, grow cells, store energy, and absorb vitamins. Fat is essential for healthy skin and blood pressure regulation. Saturated fats and Unsaturated fats are the two different varieties of fats. Saturated fats are present in products like cream, butter, cheese, and some chocolates. Some of the unsaturated fats are sunflower, soybean, cardamon, and corn oils. Morales, Alfonso (2011) [7] on the other hand, trace minerals are needed in tiny amounts but have several vital roles in our bodies. Some of the crucial trace minerals required by the body are selenium, iodine, iodine salts, copper, zinc, manganese, copper, and iron.
Analysis and interpretation
Indian tribes are one of the oldest inhabitants of the subcontinent. The word tribes were introduced in the colonial era. For administrative convenience, the British colonists in India used a single term 'tribe' for a diverse set of communities. This article will throw light on the Indian tribes. One of the major causes for malnutrition in India is economic inequality. Due to the low economic status of some parts of the population, their diet often lacks in both quality and quantity. Dangol, Narendra (2018) [2] .
women who are malnourished are less likely to have healthy babies. Nutrition deficiencies inflict long-term damage to both individuals and society. Compared with their better-fed peers, nutrition-deficient individuals are more likely to have infectious diseases such as pneumonia and tuberculosis, which lead to a higher mortality rate. Besides, nutrition-deficient individuals are less productive at work. Low productivity not only gives them low pay that traps them in a vicious circle of under-nutrition, [2] but also brings inefficiency to the society, especially in India where labor is a major input factor for economic production. On the other hand, over-nutrition also has severe consequences.
In India national obesity rates in 2010 were 14% for women and 18% for men with some urban areas having rates as high as 40%. Obesity causes several non-communicable diseases such as cardiovascular diseases, diabetes, cancers and chronic respiratory diseases. Sufal Bangla is also making fruit producer's retail market competitive. Different Hubs at various Agro Climatic Zones of West Bengal will be set in motion for procurement of fruits at different seasons in future days. However, so far Dumps is concerned, it is an inevitable part of the Fresh Fruits and Vegetables trade. Managing Dump efficiently is a part and parcel of the trade which is done in this project very proficiently.
National nutrition mission
This project has launched in 2018 (although the programme was being implemented in 2017) by the Government of India with the aim of tackling the malnutrition problem prevalent in India.
The chief objective of the mission is to reduce the level of under-nutrition and also enhance the nutritional status of children in the country. The mission is a multi-ministerial initiative and aims at removing malnutrition from the country by 2022. Lal, Rattan (2017) [19] The mission also encompasses mapping of various other schemes related to malnutrition and enabling synergies through ICT-based real-time monitoring system, robust convergence between the schemes, incentivizing states and UTs for meeting the set targets, and optimising Anganwadi centres' functioning, apart from conducting social audits. These other schemes include the Pradhan Mantri Matru Vandana Yojana (PMMVY), Janani Suraksha Yojana, Scheme for Adolescent Girls (SAG), Swachh Bharat Abhiyaan, PDS, National Health Mission, etc. For Anganwadi centres, the mission envisages the following: Giving incentives to Anganwadi Workers (AWWs) for using IT-based tools. Elimination of registers used by AWWs. Measuring the height of children at Anganwadi centres.
RKSY ration card scheme
Raja Khadya Suraksha Yojana includes two types of ration cards that are issued to those people who belong to the financially underserved category and tribal groups are residents of West Bengal. West Bengal Ration Card 2023. Residents of West Bengal who belong to the Below Poverty Line (BPL) group or are just above the Above Poverty Line (APL) can apply for a ration card so that they can purchase food item at subsidised rates. Apart from that, the ration card can also act as a legitimate government document. Under the scheme, the Government of India will provide free foodgrains to all NFSA beneficiaries i.e. Antyodaya Ann Yojana (AAY) households & Priority Household (PHH) persons for the next one year through the widespread network of 5.33 lakhs Fair Price Shops across the country. Gender: Dangol, Narendra (2018) [2] The amount of nutrients needed is significantly influenced by gender as well. Compared to men, women require more calcium and iron. Additionally, women are frequently advised to take calcium and vitamin D together since vitamin D facilitates calcium absorption. During pregnancy, folate and other B vitamins, calcium, vitamin D, and iron are crucial nutrients for embryonic growth. Additionally, the need for several nutrients, such as calcium, iron, and zinc, rises during pregnancy.
Lifestyle:
The kind of lifestyle of tribal groups has influenced your nutritional needs. The most significant lifestyle aspect that affects health is diet. In urban societies, a poor diet and its effects, such as obesity, are prevalent health issues. BMI can be used to determine an unhealthy lifestyle. Urban living causes nutritional issues such as eating fast foods and unhealthy foods, which increases lifestyle diseases like diabetes, cholesterol etc.
Physical activity:
The level of physical activity that you engage in affects your nutritional needs. Electrolytes are a class of essential nutrients for preserving the body's fluid balance. While too much salt is bad for us, salt is necessary for health along with the electrolyte's magnesium, calcium, potassium, and chloride. Ensure that your food contains enough salt to recover your lost salt levels. While many energy drinks have electrolytes, they are not if you are trying to lose weight because they also have significant sugar content.
Cultural context: Cultural factors affect how people eat regularly, how food is prepared, and in some situations, whether or not they can impose restrictions like banning meat and dairy from the diet. However, cultural influences are changeable; when relocating to a new country, people frequently take on some local dietary customs.
Locally available foods: Lal, Rattan (2017) [19] Supermarkets in big cities offer a wide variety of products to choose from. However, if you live in a smaller city or town or tribal area, food choices may be highly influenced by what is available locally. Additionally, local foods like rice and chapati may be better carbohydrate sources for Indians when compared to oats or bread. This is because these foods are local staples and are better suited to Indian physiologies.
Dietary and food customs: People frequently use food to uphold their sense of cultural identity. People make different dishes from varied ethnic backgrounds. For instance, the fact that idli evokes images of South India and pasta reminds you of Italy is for this reason.
National plan of action for children
National plan of action for children
Conclusion
According to Dangol, Narendra (2018) [2] Food Environments -A systematic review published in 2020, partially funded by NIEHS, suggests that the health of some children may be affected by food environments near schools.
Researchers examined the presence of fast-food outlets, convenience stores, supermarkets, and grocery stores near schools along with measures of overweight/obesity by race/ethnicity, gender, grade, and income level of rural tribal community of 24 north paraganas in west Bengal. This review and result found that when fast food outlets were located near schools, obesity rates were generally higher among children in all grade levels. Additional research is needed to better understand this finding, especially for children at higher risk of obesity, such as those from socio-economically disadvantaged populations Food Packaging -PFAS are a group of more than 9,000 perfluoroalkyl and polyfluoroalkyl substances, a class of chemicals associated with harmful health effects, including liver damage, cancer, and impaired immunity. Due to widespread usage, PFAS are in the blood of nearly every American, according to the Centers for Disease Control and Prevention. Food Safety and tribal health -Food safety studies funded by NIEHS include contaminants in common foods. In particular, arsenic, a metal-like element that can harm many human organs, presents a global food contamination problem. The problem of contaminants in food led researchers funded by the Superfund Research objective to develop approaches for addressing soils used to grow crops. Some are working on phytoremediation approaches that are cost-effective and ecologically friendly. Phytoremediation is a process that uses fast-growing plants in engineered systems to degrade, extract, contain, or immobilize contaminants from soil or groundwater among the santhal and Mundari community in west Bengal. Food Gardening -The need for affordable, healthy foods has increased public interest in home, school, and community gardens. While rural and urban gardens provide numerous benefits, soil contamination may be an issue. According to Lama, Pravhat (2017) [14] Food Security -Diet is widely recognized as a key contributor to human gut microbiome composition and function.
A healthy gut microbiome can help the immune system develop, protect against pathogens, and enable proper food digestion. It is found the gut microbiome of adults tribes with food insecurity, a lack of access to healthy food, differed from those who were food secure. This study is significant because it focused on a social factor rather than dietary components the make the active impact on tribal health of study area.
In conclusion, factor meals offer numerous benefits for health-conscious individuals. They provide time-saving convenience, portion control made easy, balanced nutrition, and customization options. By incorporating factor meals into your routine, maintain a healthy lifestyle without the stress of meal planning and preparation. Remember to choose reputable factor meal providers that prioritize quality ingredients and have positive customer reviews. With the right approach, factor meals can be a valuable tool in achieving your health and wellness goals as well as female tribal groups should have to ensure the level of sustainable health and nutration.
Figures and tables from the paper
| Foods | Nutrient Content |
|---|---|
| gm/100 g edible portion | |
| Soybean | 43.2 |
| Bengalgram, black gram, green gram, lentil and red gram | 22 |
| Groundnuts, cashew nuts and almond | 23 |
| Fish | 20 |
| Meat | 22 |
| Milk (Cow) | 3.2 |
| Buffalo | 4.3 |
| Egg (approx. 44 gm) | 13.3 |
Table text extracted from the original PDF; superscript letters are shown inline. The original table image is below.
View original table image
| Foods | Available For Santhal Community (%) | Available For Munda Community (%) |
|---|---|---|
| Soybean | 45.32 | 23.65 |
| Bengal gram, black gram, green gram, lentil and red gram | 32.65 | 12.36 |
| Groundnuts, cashew nuts and almond | 28.69 | 10.36 |
| Fish | 59.35 | 35.98 |
| Meat | 38.21 | 12.98 |
| Milk (Cow) | 58.32 | 21.65 |
| Buffalo | 12.32 | 3.65 |
| Egg (approx. 44 gm) | 58.36 | 36.21 |
Table text extracted from the original PDF; superscript letters are shown inline. The original table image is below.
View original table image
| Available for santhal community (%) | — | Available for munda community (%) | — |
|---|---|---|---|
| Mean | 41.6525 | Mean | 19.605 |
| Standard Error | 5.983483 | Standard Error | 4.227511 |
| Median | 41.765 | Median | 17.315 |
| Mode | #N/A | Mode | #N/A |
| Standard Deviation | 16.92385 | Standard Deviation | 11.95721 |
| Sample Variance | 286.4166 | Sample Variance | 142.9748 |
| Kurtosis | -0.60107 | Kurtosis | -1.12625 |
| Skewness | -0.52262 | Skewness | 0.392321 |
| Range | 47.03 | Range | 32.56 |
| Minimum | 12.32 | Minimum | 3.65 |
| Maximum | 59.35 | Maximum | 36.21 |
| Sum | 333.22 | Sum | 156.84 |
| Count | 8 | Count | 8 |
| Confidence Level (95.0%) | 14.14869 | Confidence Level (95.0%) | 9.996474 |
Table text extracted from the original PDF; superscript letters are shown inline. The original table image is below.
View original table image
| t-Test: Paired Two Sample for Means | — | — |
|---|---|---|
| Available for munda community (%) | Available for santhal community (%) | |
| Mean | 19.605 | 41.6525 |
| Variance | 142.9748 | 286.4166 |
| Observations | 8 | 8 |
| Pearson Correlation | 0.912095 | |
| Hypothesized Mean Difference | 0 | |
| df | 7 | |
| t Stat | -8.03423 | |
| P(T<=t) one-tail | 4.43E-05 | |
| t Critical one-tail | 1.894579 | |
| P(T<=t) two-tail | 8.87E-05 | |
| t Critical two-tail | 2.364624 |
Table text extracted from the original PDF; superscript letters are shown inline. The original table image is below.
View original table image
| Age group | Energy kcal/day | Protein g/day | Fat g/day | Calcium mg/day | Iron mg/day | Vitamin A μg/day (Beta caroten) |
|---|---|---|---|---|---|---|
| 10-12 yrs Boys | 2190 | 54 | 22 | 600 | 34 | 2400 |
| 10-12 yrs Girls | 1970 | 57 | 22 | 600 | 19 | 2400 |
| 13-15 yrs Boys | 2450 | 70 | 22 | 600 | 41 | 2400 |
| 13-15 yrs Girls | 2060 | 65 | 22 | 600 | 28 | 2400 |
| 16-18 yrs Boys | 2640 | 78 | 22 | 500 | 50 | 2400 |
| 16-18 yrs Girls | 2060 | 63 | 22 | 500 | 30 | 2400 |
Table text extracted from the original PDF; superscript letters are shown inline. The original table image is below.
View original table image
| Food items | Energy (kcal/100 gm edible portion) |
|---|---|
| Rice | 345 |
| Wheat flour | 341 |
| Jowar | 349 |
| Bajra | 361 |
| Ragi | 328 |
| Maize | 342 |
Table text extracted from the original PDF; superscript letters are shown inline. The original table image is below.
View original table image
| Food items | Available for santhal community (%) | Available for munda community (%) |
|---|---|---|
| Rice | 75.32 | 63.21 |
| Wheat flour | 69.32 | 41.21 |
| Jowar | 12.3 | 5.21 |
| Bajra | 2.36 | 1.21 |
| Ragi | 0 | 0 |
| Maize | 0 | 0 |
Table text extracted from the original PDF; superscript letters are shown inline. The original table image is below.
View original table image
| Food | Available for santhal community (%) | Available for munda community (%) |
|---|---|---|
| Ghee | 31.6 | 10.5 |
| Coconut | 32.2 | 12.36 |
| Vanaspati | 13.4 | 3.21 |
| Palmolein | 12.65 | 3.3 |
| Rape/mustard | 13.89 | 9.32 |
| Groundnut | 28.12 | 9.3 |
| Rice bran | 33.32 | 11.6 |
| Sesame | 40.32 | 21.5 |
| Sunflower oil | 12.2 | 1.65 |
| Soybean | 36.85 | 15.21 |
| Safflower | 12.32 | 1.5 |
Table text extracted from the original PDF; superscript letters are shown inline. The original table image is below.
View original table image
| Scheme | Commodity | Monthly Allotment (KG per head) | FPS Price (per KG) |
|---|---|---|---|
| RKSY-I | Wheat | 3 | 2 |
| RKSY-I | Rice | 2 | 2 |
| RKSY-II | Wheat | 1 | 9 |
| RKSY-II | Rice | 1 | 13 |
Table text extracted from the original PDF; superscript letters are shown inline. The original table image is below.
View original table image
| Scheme | Available for santhal tribe’s community (%) | Available for munda tribe’s community (%) |
|---|---|---|
| Sufal Bangla | 36.21 | 23.54 |
| National nutrition mission | 21.25 | 12.98 |
| RKSY ration card scheme | 49.32 | 36.21 |
Table text extracted from the original PDF; superscript letters are shown inline. The original table image is below.
View original table image
| Available For Santhal Tribes Community (%) | — | Available For Munda Tribes Community (%) | — |
|---|---|---|---|
| Mean | 35.59333 | Mean | 24.24333 |
| Standard Error | 8.108975 | Standard Error | 6.715138 |
| Median | 36.21 | Median | 23.54 |
| Mode | #N/A | Mode | #N/A |
| Standard Deviation | 14.04516 | Standard Deviation | 11.63096 |
| Sample Variance | 197.2664 | Sample Variance | 135.2792 |
| Kurtosis | #DIV/0! | Kurtosis | #DIV/0! |
| Skewness | -0.1972 | Skewness | 0.271123 |
| Range | 28.07 | Range | 23.23 |
| Minimum | 21.25 | Minimum | 12.98 |
| Maximum | 49.32 | Maximum | 36.21 |
| Sum | 106.78 | Sum | 72.73 |
| Count | 3 | Count | 3 |
| Largest(1) | 49.32 | Largest (1) | 36.21 |
| Smallest(1) | 21.25 | Smallest (1) | 12.98 |
| Confidence Level (95.0%) | 34.8901 | Confidence Level (95.0%) | 28.89291 |
Table text extracted from the original PDF; superscript letters are shown inline. The original table image is below.
View original table image
References
9 in the original paper- Golam R, Abid H, Bidhubhusan M, Narendra D. Food and nutrition security in the Hindu Kush Himalayan region. Journal of the Science of Food and Agriculture. 2018;98(2):429-438.
- Terri B, Jennifer C, Anne S, Megan D. Household Hunger Scale: Indicator Definition and Measurement Guide (PDF). Washington DC: FANTA-2 Bridge, FHI 360. Archived from the original (PDF) on 7 September 2012; c2011. Retrieved 31 July 2013.
- Alfonso M. Public Markets as Community Development Tools. Journal of Planning Education and Research. 2009;28(4):426-440.
- Kirsten A, Diana L. Agricultural policy, climate change and food security in Mexico. Food Policy. 1994;19(2):149-164.
- Kulkarni Vani S, Kulkarni Veena S, Raghav G. Double Burden of Malnutrition. International Journal of Health Services. 2017;47(1):108-133.
- Ackerson LK, Subramanian SV. Domestic Violence and Chronic Malnutrition among Women and Children in India. American Journal of Epidemiology. 2008;167(10):1188-1196.
- Pravhat L. Japan's Food Security Problem: Increasing Self-sufficiency in Traditional Food. IndraStra Global. 2017;(7):7.
- Semenza JC. Climate Change and Human Health. International Journal of Environmental Research and Public Health. 2014;2(7):7347-7353.
- Yarlini B, Michael RR. Political economy of child nutrition policy: A qualitative study of India's Integrated Child Development Services (ICDS) scheme. Food Policy. 2016;162:88-98.