
Research article · 2023 · Full text
International Journal of Statistics and Applied MathematicsAdvances in soil fertility classification: Data mining approach
Volume 8(5S) · Pages 475–481 · DOI: 10.22271/maths.2023.v8.i5sg.1240 ↗
Research areasSmart Agriculture and AI
Abstract
Author-writtenAgriculture is as old as civilization. Indian agriculture heritage witnessed nomadic shifting cultivation to present precision agriculture feeding its ever-burgeoning population. Indeed a magical feat that no other country in the world can partake in India in terms of its agriculture production. Soil fertility, an important dimension of soil productivity braced up India from starvation to self-sufficiency. This paper focuses on soil fertility classification of soil dataset of Ranga Reddy district of Telangana using data mining techniques viz., Tree based – Random Forest, Random Tree and; Lazy based -IBK and K Star; and Bayesian-based Naïve Bayes. The soil fertility dataset extended to 2,408 instances comprising 12 attributes of soil parameters which included soil physicochemical properties, and macro, secondary and micronutrients of soil collected from selected model villages of the Ranga Reddy district. Soil the performance of each model was examined in terms of correctly classified instances, incorrectly classified instances, Receiver Operating Characteristic (ROC) Area, Kappa statistic., mean absolute error, Root mean squared error, Relative absolute error and Root relative squared error. The classification algorithm, the Random Forest model had achieved the highest prediction accuracy of 93.69%, sensitivity of 0.937 and precision of 0.902 and F1 score of as compared with the rest of the models.
Summary
Source-checkedPlain-language reading of the full paper, prepared with AI and checked against the text. Each point links to the authors' own words.
Why it matters
- Soil fertility is a critical component of soil productivity that has helped India move from starvation to self-sufficiency. View evidence ↗
- Traditional estimation of soil fertility is labor-intensive and slow, making data mining approaches valuable for improving decisions regarding irrigation, fertilization, and crop management. View evidence ↗
The question
- The study aims to classify soil fertility in the Ranga Reddy district of Telangana using various data mining techniques, including Tree-based, Lazy-based, and Bayesian-based models. View evidence ↗
What they did
- Soil fertility data were collected from twenty-two model villages in each mandal of the Ranga Reddy district, Telangana, via the Department of Agriculture. View evidence ↗
- The dataset comprised 2,804 instances with 13 attributes, including physicochemical properties and various nutrients, with the Fertility Index serving as the target variable. View evidence ↗
- Using the 'cfsSubsetEval' algorithm, the researchers narrowed the 12 predictors down to six that showed a strong positive association with the target variable: pH, EC, OC, N, P2O5, and K2O. View evidence ↗
- The classification of soil fertility was performed using the open-source data mining tool WEKA version 3.8.1. View evidence ↗
What they found
- The Random Forest model achieved the highest prediction accuracy, reported as 93.70% in the results table and 93.69% in the text. View evidence ↗
- Random Forest demonstrated superior performance with a sensitivity of 0.937 and a precision of 0.902. View evidence ↗
- Random Forest exhibited the lowest error rates, with a Mean Absolute Error (MAE) of 0.0001 and a Root Mean Squared Error (RMSE) of 0.013. View evidence ↗
- The Naïve Bayes model performed the worst among all tested algorithms, with a prediction accuracy of 70.36%, sensitivity of 0.704, and precision of 0.521. View evidence ↗
- Random Forest had the highest ROC Area (0.969), while Naïve Bayes had the lowest (0.938). View evidence ↗
What it means
- The authors conclude that the Random Forest model is the most appropriate and best-fitted model for classifying the soil fertility dataset. View evidence ↗
- The authors suggest that future work should focus on simplifying soil fertility prediction by developing a GUI toolbox based on the Random Forest algorithm. View evidence ↗
Visual summary
3 visualsIllustrations explain the paper; charts are replotted from the paper's own table values.
Soil Fertility Classification Workflow
AI-generated conceptual illustration (Agricultural soil samples from farmland). It explains the idea and does not show study data.
View source evidence ↗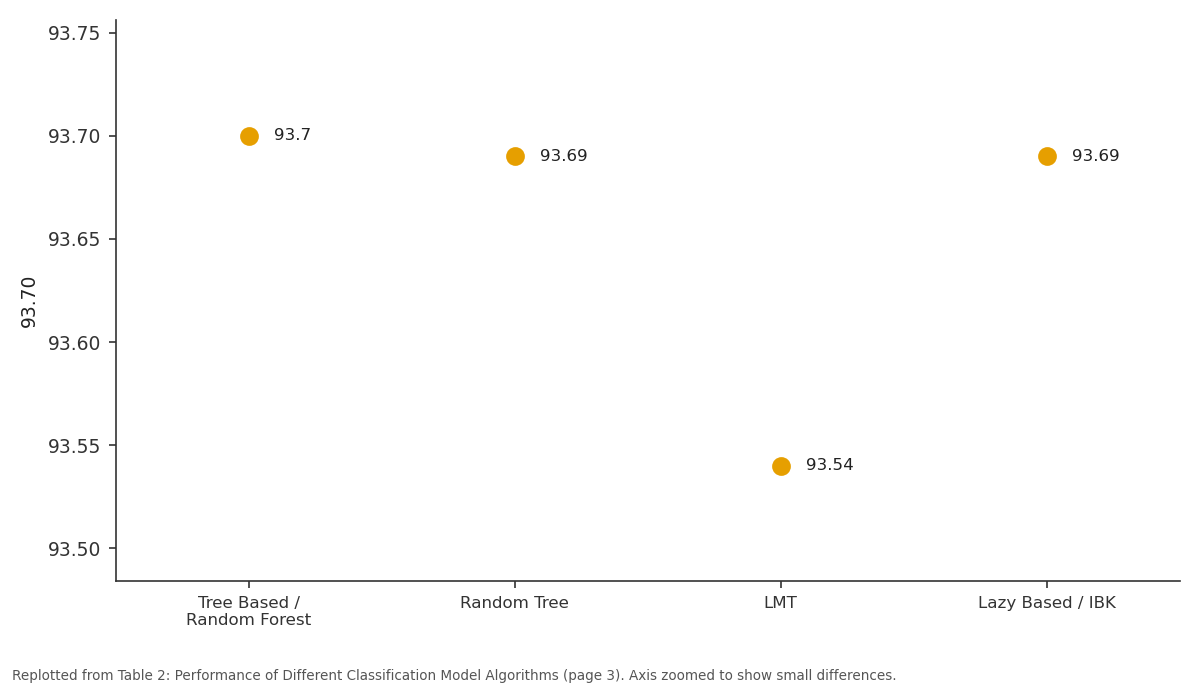
93.70: Tree Based / Random... vs Random Tree vs LMT vs Lazy Based / IBK
Replotted from Table 2 (page 3) of the original paper. Every bar is the paper's own table value.
View source evidence ↗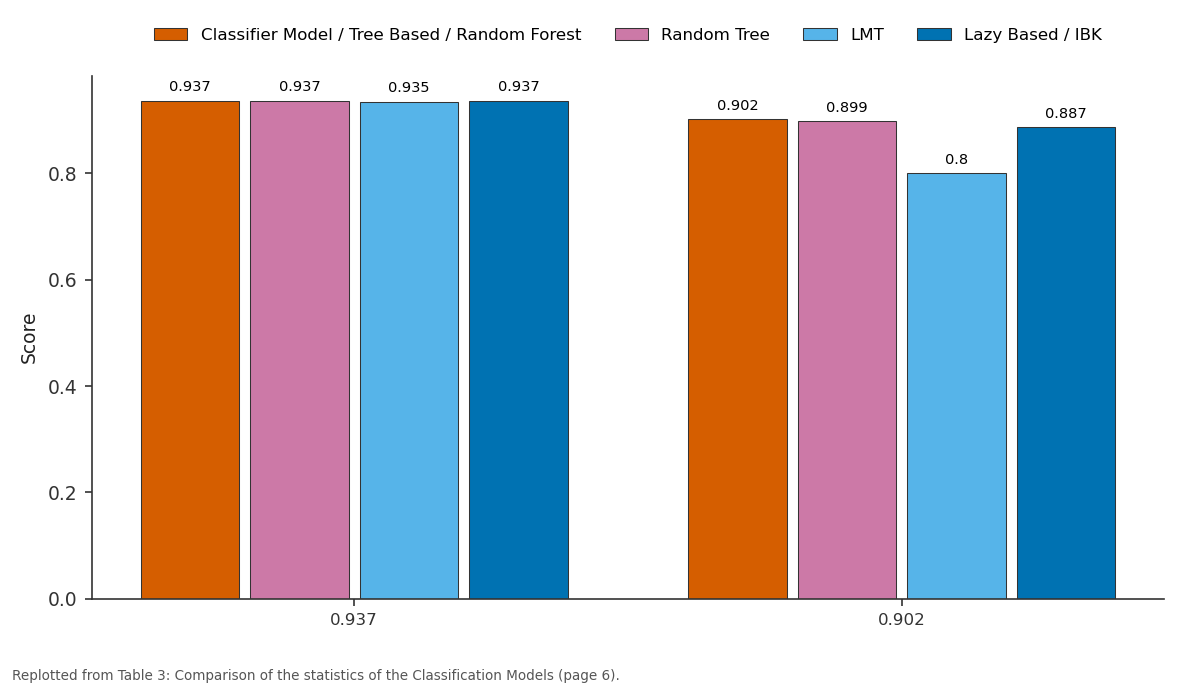
Classifier Model / Tree Based / Random Forest and Random Tree and more: 0.937 vs 0.902
Replotted from Table 3 (page 6) of the original paper. Every bar is the paper's own table value.
View source evidence ↗Figures & tables
From the original paper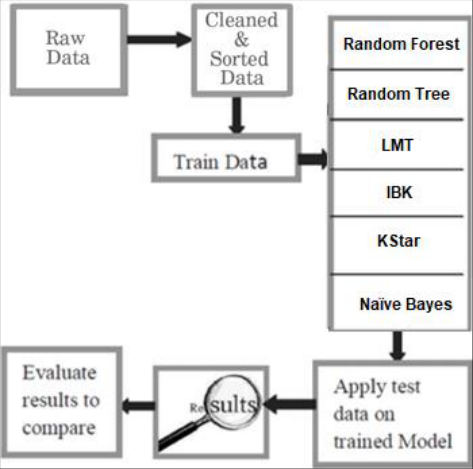 Figure 1
 Table 1
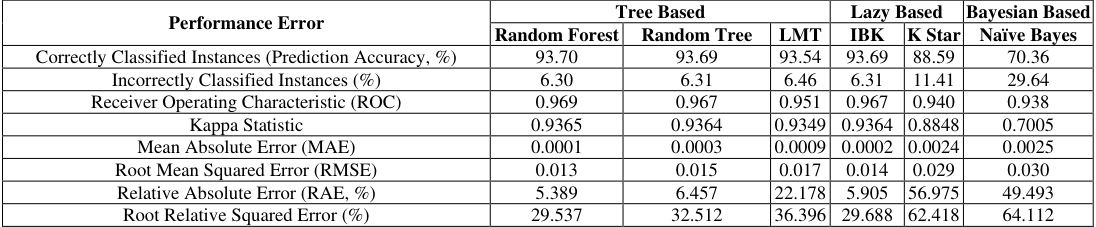 Table 2
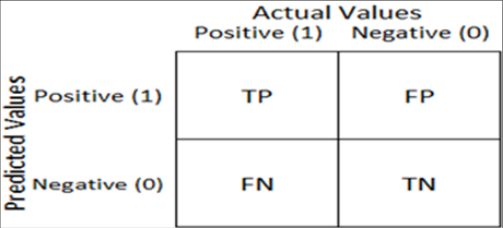 Figure 2
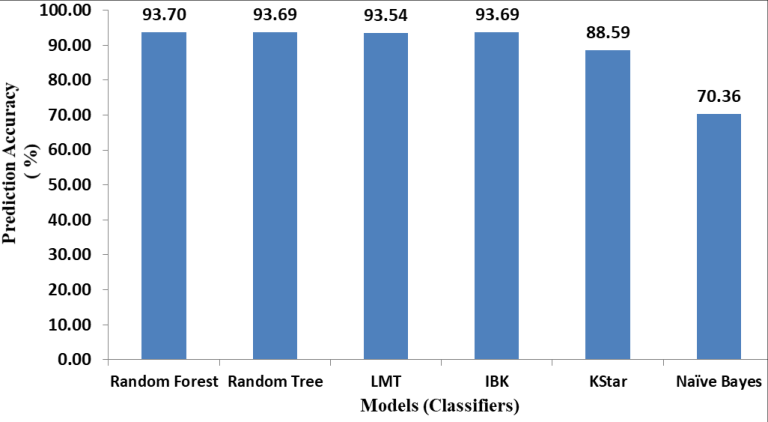 Figure 3
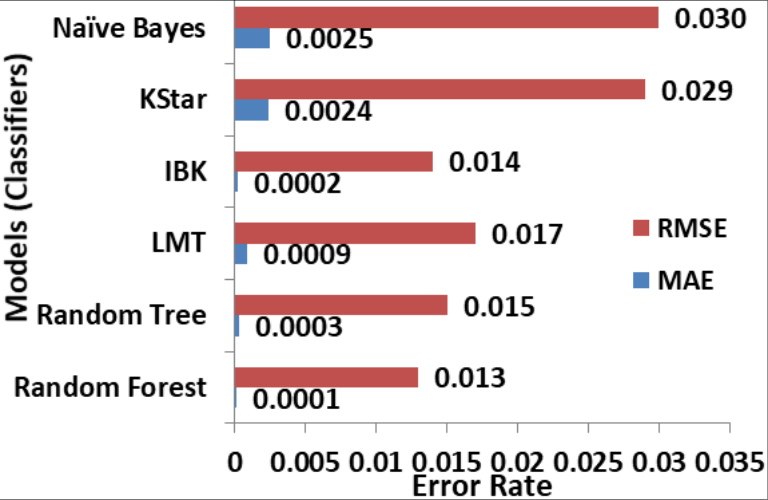 Figure 4
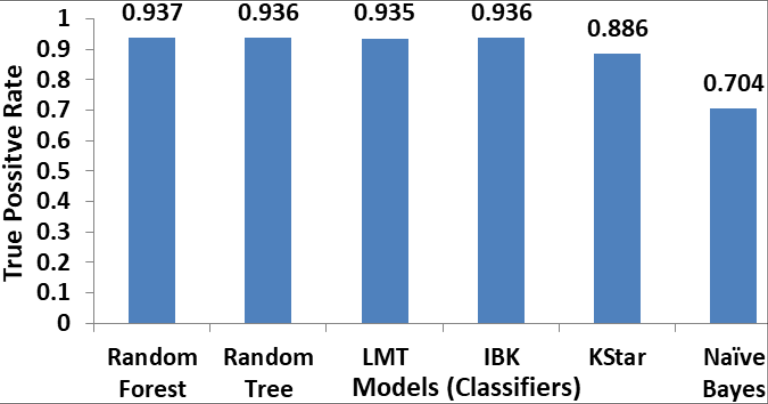 Figure 5
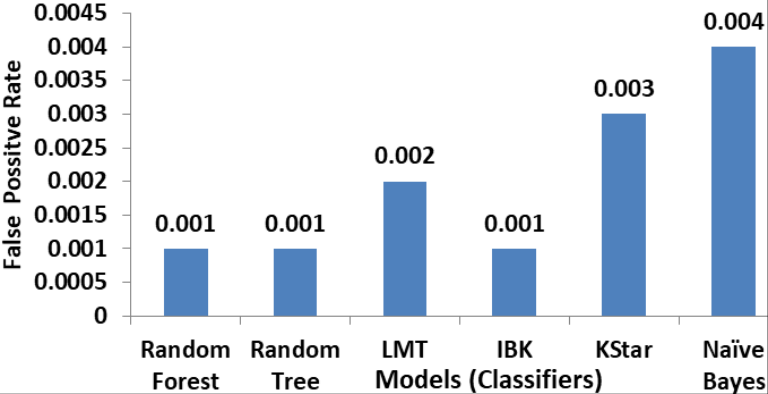 Figure 6
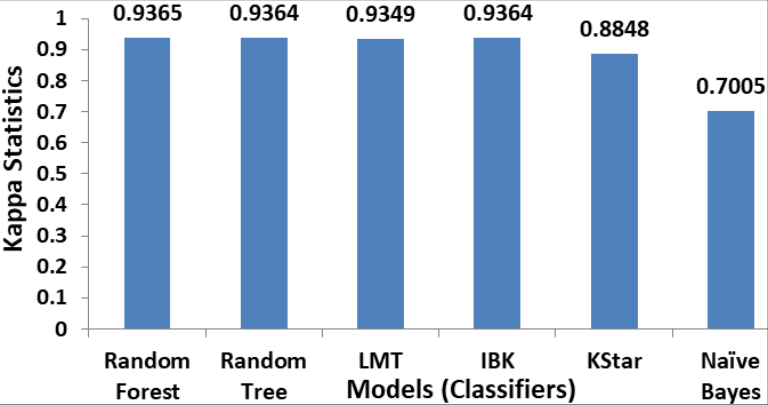 Figure 7
 Table 3
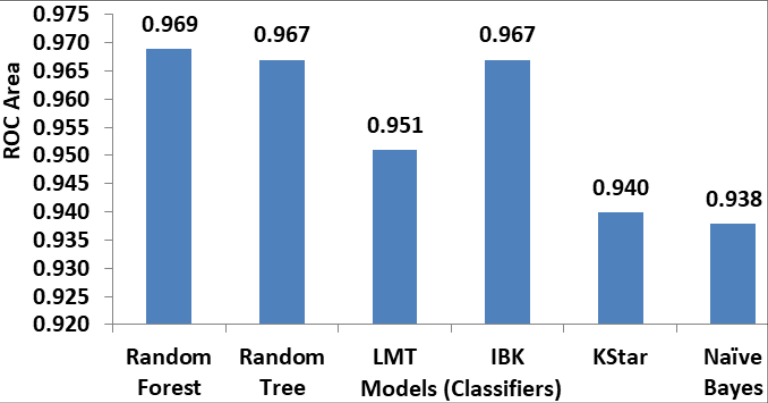 Figure 8
Introduction
Fundamentally, in a dense populous country like India, any effort that promotes agricultural development assumes significance just for the reason that no other country in the world can feed the mouths of India. Agriculture is as old as civilization in India. Since ages, different shades of cultivation practices including nomadic shifting cultivation to advanced precision agriculture were being practiced to meet huge food demand. During the entire saga of agriculture, soil fertility was the driving factor that enhanced food production disproving the Malthusian theory that India would starve to death. Estimation of soil fertility is back backbreaking and time-consuming process and thus data mining approach of soil fertility classification on which the present paper focuses, gains importance in better decision making about fertilization, irrigation and other crop management practices. In the future, data mining or machine learning techniques are Likely to continue as a key driver of agriculture development in India and elsewhere of the world. Data Mining is the process of analyzing, extracting and predicting meaningful information from enormous data to various patterns. Rajeswari and Arunesh (2016) [8] made a comparative analysis of three algorithms namely Naïve Bayes, JRip and J48. JRip correctly classified the maximum number of instances as compared with other two models. Chiranjeevi and Ranjana (2018) [2] conducted a comparative analysis of two algorithms namely Naive Bayes and J48. However, Raunak (2018) [9] recommended Naive Bayes to predict crop growing in particular soil types based on their studies. Kalekar et al. (2018) [5] suggested J48 decision tree algorithm as it showed an accuracy of 87.5% in classifying the soil fertility to use for fertilizer recommendation.
Jethva et al. (2018) [4] made a comparative analysis of algorithms like J48, Naïve Bayes, JRIP, and K-Means classifier algorithms and concluded that the decision tree algorithm performed the best to analyze soil fertility conditions. Prajapati et al. (2019) [7] proposed three approaches of nonparametric classifiers; fast K-nn (K-nearest neighbors), training set reduction techniques and hybrid approach. It was observed that K-nn classification technique was better than other approaches.
Methodology
In this research, soil fertility datasets were collected from the Department of Agriculture, Ranga Reddy District, and Telangana. The soil fertility parameters were collected from twenty-two model villages from each mandal of Ranga Reddy district which has geographic importance by virtue of its proximity to Hyderabad, the capital city of Telangana state, a newly formed 29 th state of India in 2014. Intensive peri-urban agriculture is way of life to the majority of farmer's hence high demand for fertilizers and other inputs. Farmers are tempted for misuse of fertilizers for higher productivity because of easy marketability and roadworthiness. The dataset consisted of soil fertility data having 13 attributes namely pH value of soil (pH), Electric conductivity (EC), Organic Carbon (OC), Nitrogen (N), Phosphorous (P 2 O 5 ), Potassium (K 2 O), Sulphur(S), Zinc(Zn), Iron(Fe), Copper(Cu), Manganese (Mn), Boron(B), Fertility Index (FI). And thus total soil fertility dataset had 2,804 instances. In Fig. 1, the structural design of soil fertility classification system is being given.
Min-Max normalization technique:
Where v is the respective value of the attribute V 1 is Min-Max Normalized data one min A is the respective Minimum of value of the attribute max A is the respective Maximum value of the attribute 6. As a next step, in data mining, feature selection was followed. It is also known as predictor selection. Feature selection techniques were used for the simplification of models to make them easier to interpret by researchers, shorter training times, to avoid the curse of dimensionality and to reduce over fitting. Thus, 12 factors were considered as the predictors and soil fertility index was taken as the target variable. As few predictors may be superfluous, affecting estimation of soil fertility index. So, from 12 predictors; only six (6) predictors namely pH value of soil (pH), Electric conductivity (EC), Organic Carbon (OC), Nitrogen (N), Phosphorous (P 2 O 5 ), Potassium (K 2 O) had positive and strong association with target variable were selected using feature selection algorithm namely "cfsSubsetEval". 7. Cross-validation procedure was used to assess machine learning models on a limited data sample. The k-fold cross-validation has a parameter called k that refers to the number of groups that a given data sample is to be split into. When a specific value for k is chosen, it may be used in place of k in the reference to the model, such as k=10 becoming a 10-fold crossThe learner focused on an instance utilizing an entropic distance scale.
Bayesian Based
Naïve Bayes Conventional Bayesian probabilistic classification 9. Confusion Matrix was calculated. A confusion matrix is a technique for summarizing the performance of a classification algorithm (Fig. 2).
TP: Number of instances where the system detects for a condition when it is present.
TN: Number of instances where system does not detect a condition when it is absent.
FN: Number of instances where the system does not detect a condition when it is present.
FP: Number of instances where the system detects a condition when it is really absent.
Results
The results presented in Table 2 indicated that the Tree-based and Lazy based models have better performance than Bayesian based model. In tree-based models among the three algorithms examined, RandomForest performed better as compared with RandomTree and LMT in terms of more numSSber of correctly classified instances and ROC. The kappa statistic was nearer to one and relatively less error percentage (MAE, RMSE, RAE) by RandomForest indicating its better performance as compared with than other fitted algorithms. In Lazy based models,among two algorithms that were studied namely IBK and KStar, IBK was found to be better over KStar as the former recorded less error in predicting soil fertility. The Bayesian based Naïve Bayes performance was least as compared with the rest of all the algorithms tested. The Fig. 3 shows the prediction accuracy of different classification models. Out of six models used in this research work, Random Forest showed maximum soil fertility predictability of 93.70% over the other classification models.
| Performance Error | Tree Based | — | — | Lazy Based | — | Bayesian Based |
|---|---|---|---|---|---|---|
| Random Forest | Random Tree | LMT | IBK | K Star | Naïve Bayes | |
| Correctly Classified Instances (Prediction Accuracy, %) | 93.70 | 93.69 | 93.54 | 93.69 | 88.59 | 70.36 |
| Incorrectly Classified Instances (%) | 6.30 | 6.31 | 6.46 | 6.31 | 11.41 | 29.64 |
| Receiver Operating Characteristic (ROC) | 0.969 | 0.967 | 0.951 | 0.967 | 0.940 | 0.938 |
| Kappa Statistic | 0.9365 | 0.9364 | 0.9349 | 0.9364 | 0.8848 | 0.7005 |
| Mean Absolute Error (MAE) | 0.0001 | 0.0003 | 0.0009 | 0.0002 | 0.0024 | 0.0025 |
| Root Mean Squared Error (RMSE) | 0.013 | 0.015 | 0.017 | 0.014 | 0.029 | 0.030 |
| Relative Absolute Error (RAE, %) | 5.389 | 6.457 | 22.178 | 5.905 | 56.975 | 49.493 |
| Root Relative Squared Error (%) | 29.537 | 32.512 | 36.396 | 29.688 | 62.418 | 64.112 |
Table text extracted from the original PDF; superscript letters are shown inline. The original table image is below.
View original table image
It was followed by Random Tree and IBK with 93.69% and 93.54% respectively. LMT followed by K Star exhibited lower accuracy of 93.69% and 88.59%, respectively, while, Naïve Bayes classification recorded lowest soil fertility predictability of 70.36%.These results can be corroborated with the findings of Keerthan et al. (2020) [6] And Elhamayed (2016) [3] who also stated that Random forest type classification algorithm scored highest accuracy in grading the soil, b based on its nutrient criteria. [1] in the Aurangabad region, India.
Conclusion
Model predictive approach of agriculture is a reality now with strides in information technology and data mining is such a scientific tool, which provided essential knowledge from the database such as soil fertility data of Range Reddy district of Telangana. Based on all the benchmarks used to measure the models employed in this study, it was discovered that Tree based Random Forest model with 93.69% accuracy, 0.937 sensitivity, 0.902 precision, 0.001 specificity, 0917 F1 score and 0.918 MCC is the most appropriate in terms of classification based on this data. Thus, it was observed that Random Forest is best fitted model to classify the soil fertility dataset.
Future Work
Soil fertility prediction can be much more simplified by developing a GUI toolbox based on the Random Forest algorithm.
Acknowledgement
6. Keerthan Kumar TG, Shubha C, Sushma A. Random Forest algorithm for soil fertility prediction and grading using Machine learning. International Journal of Innovative Technology and Exploring Engineering. 2020;9(1):1301-1303. 7. Prajapati BP, Kathiriya DR. A Hybrid Machine Learning Technique for Fusing Fast k-NN and Training Set Reduction: Combining Both Improves the Effectiveness of Classification. In Progress in Advanced Computing and Intelligent Engineering. Springer, Singapore. 2019;(174):229-240. 8. Rajeswari V, Arunesh K. Analysing Soil Data using Data Mining Classification Techniques. Indian Journal of Science and Technology. 2016;9(19):1-4. 9. Raunak J. Applying Naive Bayes Classification Technique for Classification of Improved Agricultural Land Soils. International Journal for Research in Applied Science & Engineering Technology. 2018;6(5):189-193.
Figures and tables from the paper
| Category | Algorithm | Classification Principle |
|---|---|---|
| Tree Based | Random Forest | Collection of decision trees focused on random features extracted from bootstrapped data |
| Random Tree | It is an ensemble learning algorithm that generates lots of individual learners. It employs a bagging idea to construct a random set of data for constructing a decision tree | |
| LMT | Classification trees with the method of logistic regression on the leaves. | |
| Lazy Based | IBK | Learner-based instance utilizes the class of the closest k instances. |
| K star | The learner focused on an instance utilizing an entropic distance scale. | |
| Bayesian Based | Naïve Bayes | Conventional Bayesian probabilistic classification |
Table text extracted from the original PDF; superscript letters are shown inline. The original table image is below.
View original table image
| Parameters | Classifier Model | — | — | — | — | — |
|---|---|---|---|---|---|---|
| Tree Based | Lazy Based | Bayesian Based | ||||
| Random Forest | Random Tree | LMT | IBK | K Star | Naïve Bayes | |
| Accuracy | 93.69% | 93.69% | 93.54% | 93.69% | 88.59% | 70.36% |
| Sensitivity | 0.937 | 0.937 | 0.935 | 0.937 | 0.886 | 0.704 |
| Precision | 0.902 | 0.899 | 0.800 | 0.887 | 0.799 | 0.521 |
| Specificity | 0.001 | 0.001 | 0.002 | 0.001 | 0.003 | 0.004 |
| F1 score | 0.917 | 0.916 | 0.850 | 0.910 | 0.837 | 0.594 |
| MCC | 0.918 | 0.917 | 0.849 | 0.911 | 0.839 | 0.602 |
Table text extracted from the original PDF; superscript letters are shown inline. The original table image is below.
View original table image
References
5 in the original paper- Bhuyar V. Comparative Analysis of Classification Techniques on Soil Data to Predict Fertility Rate for Aurangabad District. International Journal of Emerging Trends & Technology in Computer Science. 2014;3(2):200-203.
- Chiranjeevi MN, Ranjana BN. Analysis of Soil Nutrients using Data Mining Techniques. International Journal of Recent Trends in Engineering & Research. 2018;4(7):103-107.
- Elhamayed SA. Enhancement of Agriculture Classification by Using Different Classification Systems. International Journal of Computer Applications. 2016;3(1):08-12.
- Jethva JM, Gondaliya N, Shah V. A Review on Data Mining Techniques for Fertilizer Recommendation. International Journal of Scientific Research in Computer Science, Engineering and Information Technology. 2018;3(1):2456-3307.
- Kalekar A, Vispute S, Kokane P, Kamble M, Bokefode K. Automated Generation and Analysis of Soil Health Card and Calculation of the Village Soil Fertility Index. International Journal of New Technologies in Science and Engineering. 2018;5(3):118-125.
Cited by 1
From OpenAlex, OpenCitations and reference lists read by Scinovex
- A multi-task learning framework for soil fertility assessment and nutrient prediction using machine learning ↗
Halbast Rashid Ismael, Gheyath Mustafa Zebari, Ibrahim Mahmood Ibrahim, Adel Al-Zebari · Modeling Earth Systems and Environment · 2025
❝ 3