
Research article · 2023 · Full text
International Journal of Advanced Biochemistry ResearchGenetic variability, heritability and genetic advance for yield and yield contributing traits in Tomato (Solanum lycopersicum L.)
Volume 7(2S) · Pages 207–211 · DOI: 10.33545/26174693.2023.v7.i2sc.214 ↗
Research areasAgricultural Practices and Plant GeneticsGreenhouse Technology and Climate ControlSilkworms and Sericulture Research
Abstract
Author-writtenSixteen tomato genotypes were tested in order to quantify variability, heritability, and genetic progress in yield and yield contributing characteristics. The magnitude of the phenotypic coefficient of variation (PCV) was greater than the size of the genotypic coefficient of variation (GCV) for all traits. High PCV, GCV, and Heritability were observed, along with high genetic advance as a percentage of mean for both fruit yield/plant (kg) and fruit yield (kg/plot), number of clusters/plants, plant height (cm), number of primary branches/plants, number of fruits/plants, locule number, average fruit weight (g), and number of flower/clusters. These estimates demonstrated high heritability (broad sense) values were high for all traits viz, number of cluster/plants, plant height (cm), average fruit weight (g), number of fruits per plant, fruit yield (kg/plot), fruit yield per plant (kg), days to 50% flowering, polar diameter (mm), days to first fruit setting, days to first flowering, fruit equatorial diameter (mm), number of primary branches per plant, days to first fruit harvest, locule number. Highest estimate of genetic advance was noted in plant height (cm) followed by number of clusters per plant.
Summary
Source-checkedPlain-language reading of the full paper, prepared with AI and checked against the text. Each point links to the authors' own words.
Why it matters
- Tomato is a globally significant vegetable crop valued for its adaptability, high yield, and versatility in both fresh and processed food industries. View evidence ↗
- Tomatoes are nutritionally important, providing vitamins A and C, minerals like calcium, phosphorus, and iron, and antioxidants that may help prevent heart disease and cancer. View evidence ↗
- Identifying desirable tomato genotypes is necessary to develop open-pollinated cultivars or hybrids suitable for the production systems in Madhya Pradesh. View evidence ↗
The question
- The study aimed to investigate genetic diversity, heritability, and genetic gain across several tomato genotypes for various horticultural parameters. View evidence ↗
What they did
- Sixteen tomato genotypes were grown during the 2022-23 autumn-winter season at ITM University's Vegetable Research Farm in Gwalior, Madhya Pradesh. View evidence ↗
- The researchers measured nineteen different traits, including plant height, fruit yield per plant and plot, fruit weight, and quality parameters like pH, TSS, and TTA. View evidence ↗
- Genotypic and phenotypic coefficients of variance (GCV and PCV) were calculated using Comstock and Robinson's technique, while heritability and genetic advance were evaluated using methods by Lush and Johnson et al. View evidence ↗
What they found
- Analysis of variance showed highly significant mean squares for all nineteen characters, indicating significant variability and potential for selection among the genotypes. View evidence ↗
- For every trait measured, the phenotypic coefficient of variation (PCV) was larger than the genotypic coefficient of variation (GCV). View evidence ↗
- High genotypic variance was found for several traits, including plant height, number of clusters and fruits per plant, locule number, average fruit weight, and fruit yield. View evidence ↗
- Broad-sense heritability was high for all traits, ranging from 93.16% for locule number to 99.54% for number of clusters per plant. View evidence ↗
- The highest genetic advance was observed for plant height (79.63%) and number of clusters per plant (62.55%), while average fruit weight (36.62%) and fruit yield per plot (34.28%) showed moderate advance. View evidence ↗
- The lowest genetic advance estimates were recorded for total titrable acidity (0.20%), pH (0.68%), and total soluble solids (0.94%). View evidence ↗
What it means
- The authors conclude that the high genetic variability found across genotypes provides a significant opportunity to improve fruit quality and biochemical traits through hybridization and selection. View evidence ↗
- The combination of high heritability and moderate-to-high genetic advance suggests that additive gene action predominates, making selection an effective method for trait improvement. View evidence ↗
Visual summary
3 visualsIllustrations explain the paper; charts are replotted from the paper's own table values.
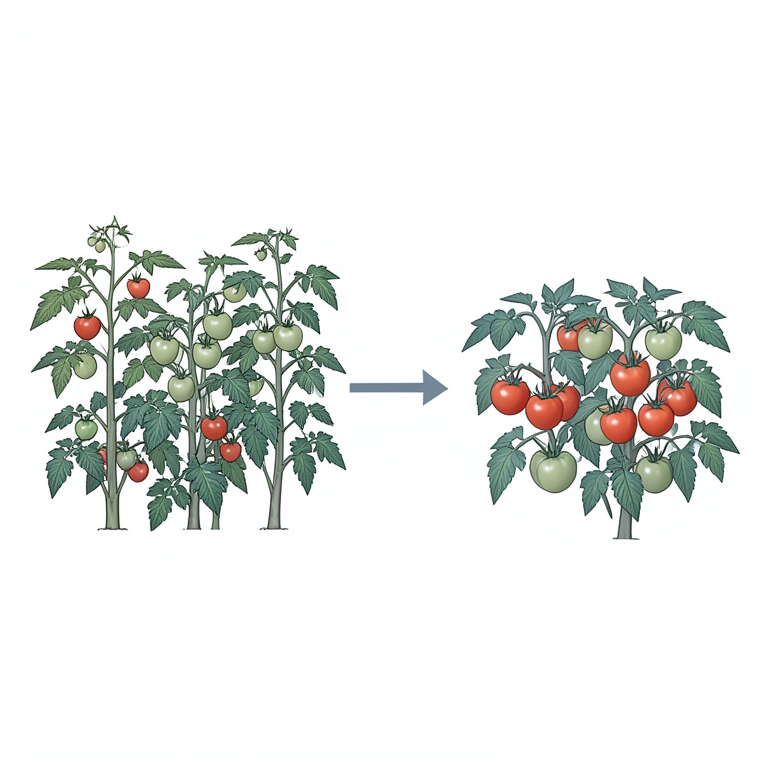
Selection Effectiveness Model
AI-generated conceptual illustration (Tomato plants (Solanum lycopersicum L.)). It explains the idea and does not show study data.
View source evidence ↗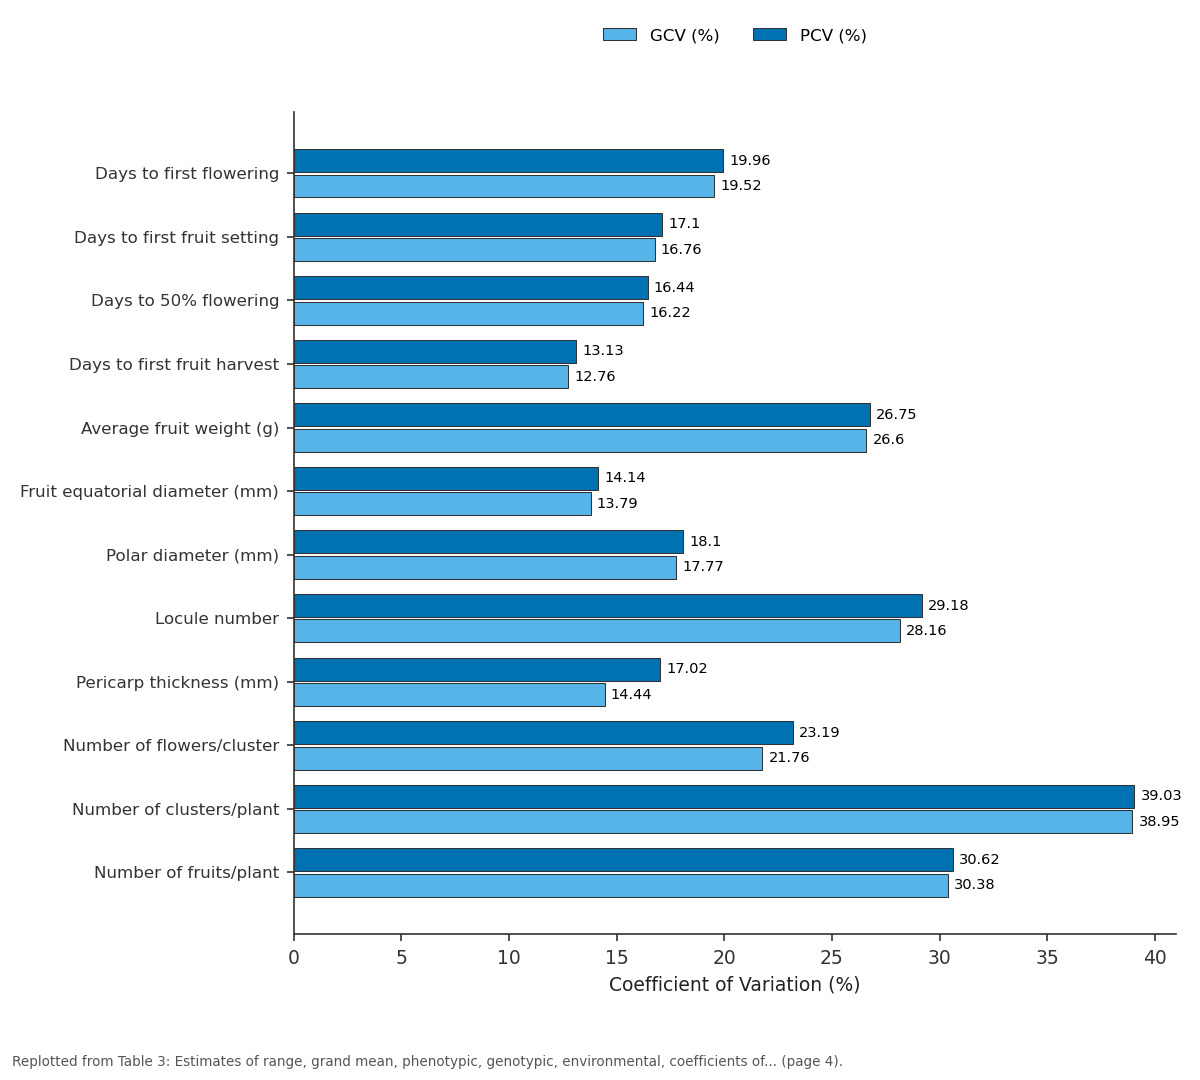
GCV (%) and PCV (%): Days to first flowering vs Days to first fruit... vs Days to 50% flowering vs Days to first fruit... vs Average fruit weight (g)
Replotted from Table 3 (page 4) of the original paper. Every bar is the paper's own table value.
View source evidence ↗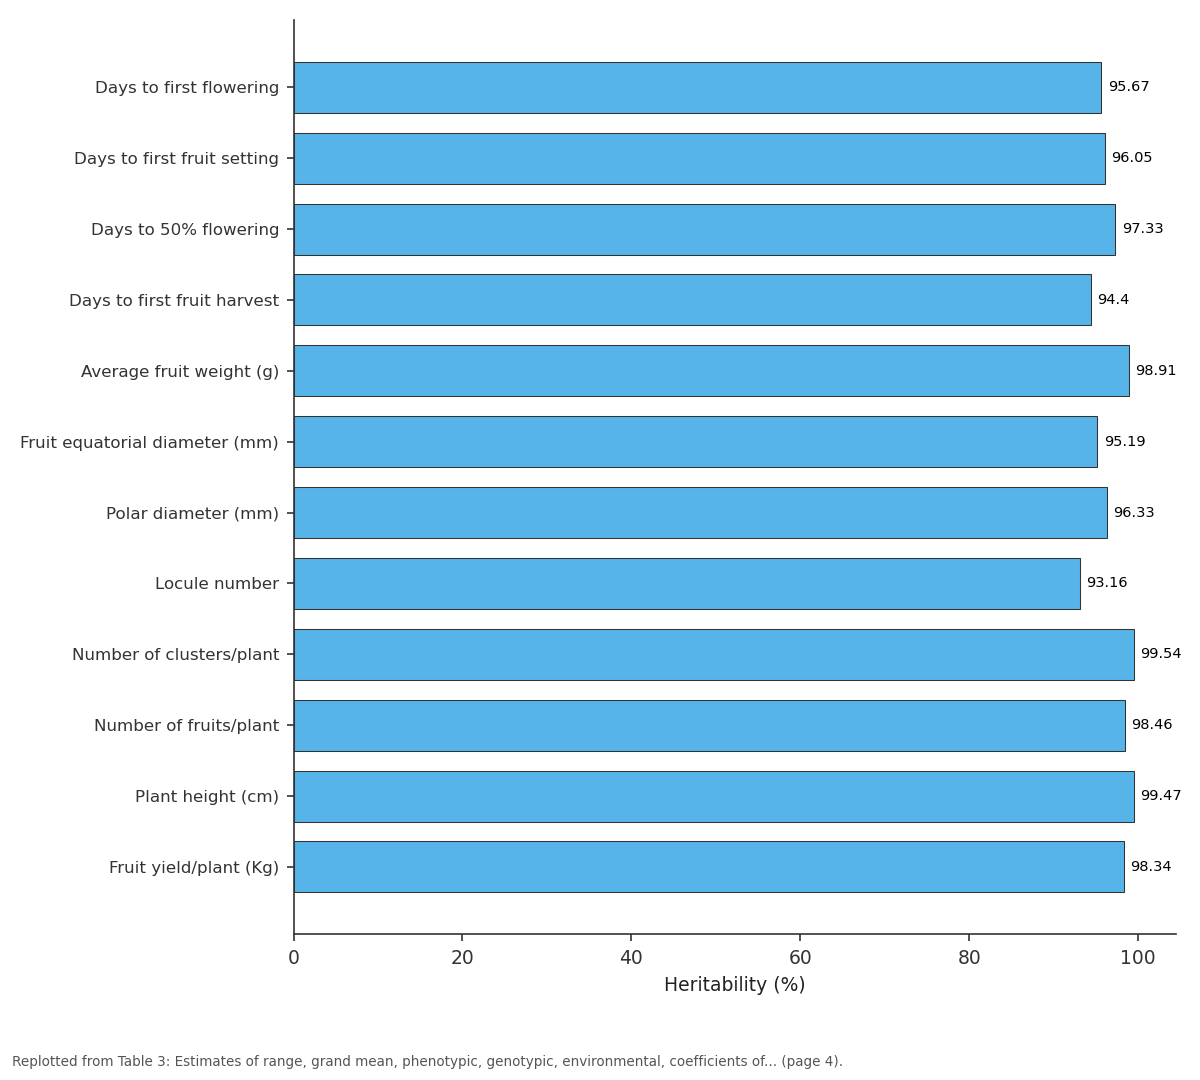
Heritability (%): Days to first flowering vs Days to first fruit... vs Days to 50% flowering vs Days to first fruit... vs Average fruit weight (g)
Replotted from Table 3 (page 4) of the original paper. Every bar is the paper's own table value.
View source evidence ↗Figures & tables
From the original paper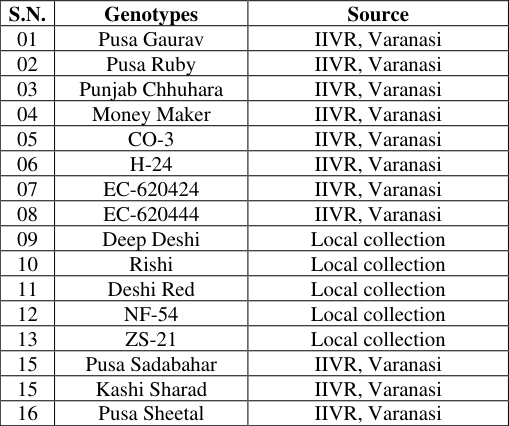 Table 1
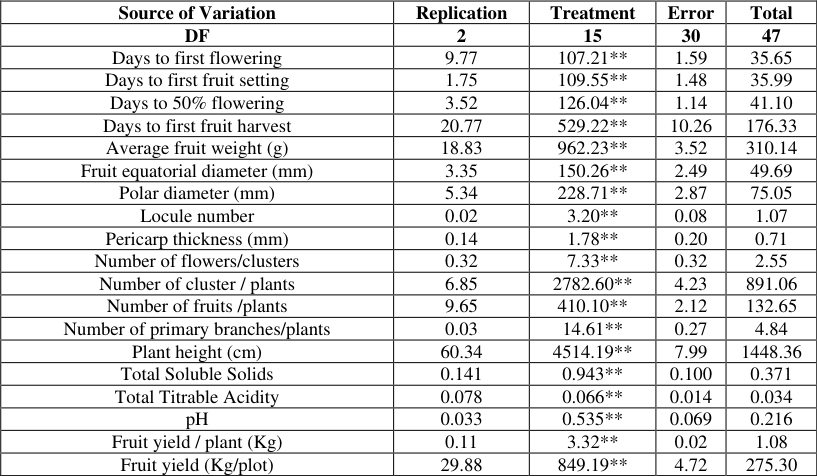 Table 2
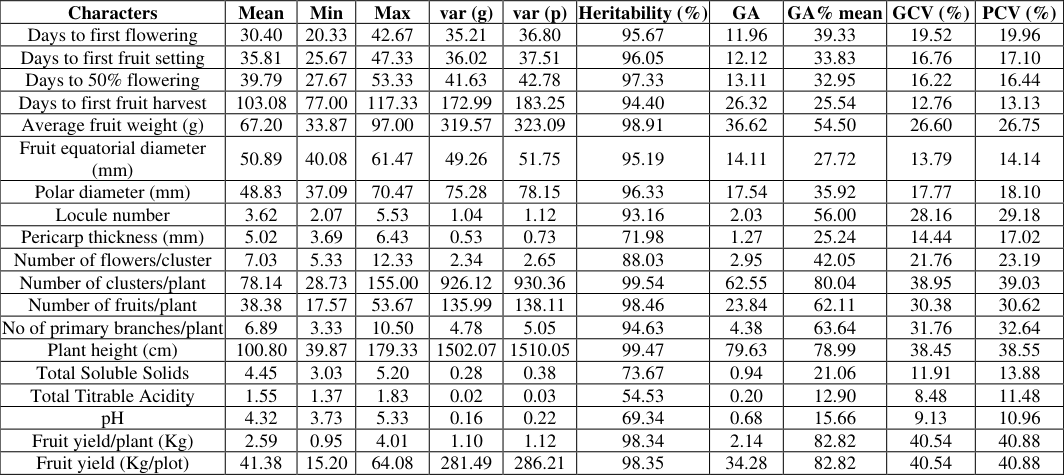 Table 3
Introduction
Tomato (Solanum lycopersicum L.) is one of the most significant vegetable crops grown worldwide due to its great adaptability, high yielding capacity, and suitability for a multitude of uses in both fresh and processed food industries. This species is native to South America, likely Peru and Ecuador, but it was domesticated in Mexico for the first time. In many countries it is considered as "poor man's orange" because of its attractive appearance and nutritive value while in England, it is known as the "love of apple". Tomato is also a significant component of the cocktail known as "Blood Marry" (Meena et al., 2014) [22] . Tomato belongs to a family Solanaceae, with other important crops such as pepper, eggplant and potato. It is a significant warm-season self-pollinated vegetable farmed for both fresh and processed markets (Das et al., 2011) [12] . It is a self-pollinated diploid with twelve pairs of chromosomes (2n=2x=24). The evolutionary classification of the Solanaceae family was recently modified, and the genus Lycopersicum was reintegrated into the genus Solanum with its new nomenclature (Peralta et al., 2008) [24] . It is an herbaceous, annual to perennial crop plant with bisexual flowers that is sexually propagated. Tomato is a day neutral plant that is largely self-pollinated with some cross-pollination. Tomatoes are classified as determinate or indeterminate, and they can be cultivated in open fields or greenhouses. The Solanum genus contains over 3000 species, with tomatoes being the most lycopeneproducing of them all. It is a good source of lycopene and ascorbic acid, as well as antioxidants and chemo-protective compounds, and hence qualifies as a functional food (Akhtar and Hazra 2013; Maurya et al. 2022) [3,21] . Section lycopersicum includes the only cultivated tomato species, Solanum lycopersicum, as well as a dozen more wild cousins (Kalloo 2012) [17] . Tomatoes are one of the most important vegetable crops grown around the world. It is ranked second among vegetable crops and seventh overall. In India, it is next only to potato and onion among vegetables in terms of production. The crop has gained popularity among farmers due to its short duration, high yield potential, high profitability, and economic feasibility, as well as its strong nutritional and protective properties (Chauhan et al., 2014) [8] . The current studies focus on these characteristics, as well as other factors researched by other researchers. As a result, the study will go a long way towards identifying desirable genotypes suitable for distribution as an open pollinated cultivar or involving favourable genotypes in the development of hybrids fit for the vegetable production system widespread in Madhya Pradesh. The crop is farmed in the country on an area of 0.841 million hectares, yielding 20.34 million metric tonnes with an average national productivity of 24.36 metric tonnes per hectare (Anonymous, 2022) [4] . India ranks second in area (11280 thousand ha) and production (204613 MT) next to China, while its productivity (25.6 ton/ha) is quite lower many of the major producing countries. Andhra Pradesh is the largest producer of tomatoes in India. Tomatoes are another common vegetable in M.P, with an area of 46.27 thousand ha, a production of 1011MT, and a productivity of 21.85 tons/ha (Anonymous, 2022) [4] . The main tomato producing states in India include Andhra Pradesh, Madhya Pradesh, Karnataka, Telangana, and Gujarat. Tomato includes minerals, vitamins, and phytochemicals, they are an important part of the human diet. Tomatoes are high in vitamins (A and C), minerals (Ca, P, and Fe), and are a powerful antioxidant that can help prevent cancer and heart disease. It's output has skyrocketed because to its numerous applications, including fresh for salad, cooked as vegetables, and processed in a variety of forms such as soup, sauces, ketchups, preserves, paste, and puree. Tomato's red pigment is currently regarded as the "World's most powerful antioxidant". It also plays an important role in boosting poor people's nutrition resources when compared to meat, milk, fruits, and other high-priced food goods (Saleem et al., 2013) [27] . It is classified as a 'Protective food' because it contains lycopene and flavonoids, which have specific nutritional and antioxidant qualities (Sepat et al., 2013) [28] . In the human diet, tomatoes and their derivatives are the principal source of lycopene and other antioxidants. Tomatoes' antioxidants, notably lycopene, beta-carotene, ascorbic acid, vitamin E, phenolic compounds, and flavonoids, are responsible for their health advantages (Frusciante, 2007) [14] . Lycopene is an important dietary component since it reduces the risk of a variety of cancers and heart attacks (Dorgan et al., 1998; Clinton, 2005) [13,9] . As a result, an attempt was made to investigate the genetic diversity, heritability, and genetic gain among several tomato genotypes for various horticultural parameters.
Materials and Methods
In the autumn-winter season of 2022-23, sixteen tomato genotypes were grown. The field experiment was conducted at ITM University's Vegetable Research Farm (CRC-1), School of Agriculture, Department of Horticulture, Gwalior (MP). It is located in India's Grid area at 26 ̊ 21̓ N latitude and 78 ̊ 20' E longitude, with an elevation of 211.5 m above sea level. It may be found southwest of Gwalior. Tomato genotypes were planted in the nursery bed as part of the experimental material. Tomato seedlings were transplanted in a Randomized Block Design with three replications. In our trial, we transplanted thirty-day-old seedlings on raised beds at a 5050 cm spacing to optimize crop growth. The details of the plant materials are presented in Table 1. [16] .
| S.N. | Genotypes | Source |
|---|---|---|
| 01 | Pusa Gaurav | IIVR, Varanasi |
| 02 | Pusa Ruby | IIVR, Varanasi |
| 03 | Punjab Chhuhara | IIVR, Varanasi |
| 04 | Money Maker | IIVR, Varanasi |
| 05 | CO-3 | IIVR, Varanasi |
| 06 | H-24 | IIVR, Varanasi |
| 07 | EC-620424 | IIVR, Varanasi |
| 08 | EC-620444 | IIVR, Varanasi |
| 09 | Deep Deshi | Local collection |
| 10 | Rishi | Local collection |
| 11 | Deshi Red | Local collection |
| 12 | NF-54 | Local collection |
| 13 | ZS-21 | Local collection |
| 15 | Pusa Sadabahar | IIVR, Varanasi |
| 15 | Kashi Sharad | IIVR, Varanasi |
| 16 | Pusa Sheetal | IIVR, Varanasi |
Table text extracted from the original PDF; superscript letters are shown inline. The original table image is below.
View original table image
Results and discussion
The recorded data on all quantitative characters were subjected to analysis of variance to test whether there was significant variation among the genotypes. Analysis of variance has been presented in Table 2. It shows that the mean square due to the genotypes were highly significant for all the characters suggesting significant variability among all the traits under study and indicates the presence of ample scope for selection.
| Source of Variation | Replication | Treatment | Error | Total |
|---|---|---|---|---|
| DF | 2 | 15 | 30 | 47 |
| Days to first flowering | 9.77 | 107.21** | 1.59 | 35.65 |
| Days to first fruit setting | 1.75 | 109.55** | 1.48 | 35.99 |
| Days to 50% flowering | 3.52 | 126.04** | 1.14 | 41.10 |
| Days to first fruit harvest | 20.77 | 529.22** | 10.26 | 176.33 |
| Average fruit weight (g) | 18.83 | 962.23** | 3.52 | 310.14 |
| Fruit equatorial diameter (mm) | 3.35 | 150.26** | 2.49 | 49.69 |
| Polar diameter (mm) | 5.34 | 228.71** | 2.87 | 75.05 |
| Locule number | 0.02 | 3.20** | 0.08 | 1.07 |
| Pericarp thickness (mm) | 0.14 | 1.78** | 0.20 | 0.71 |
| Number of flowers/clusters | 0.32 | 7.33** | 0.32 | 2.55 |
| Number of cluster / plants | 6.85 | 2782.60** | 4.23 | 891.06 |
| Number of fruits /plants | 9.65 | 410.10** | 2.12 | 132.65 |
| Number of primary branches/plants | 0.03 | 14.61** | 0.27 | 4.84 |
| Plant height (cm) | 60.34 | 4514.19** | 7.99 | 1448.36 |
| Total Soluble Solids | 0.141 | 0.943** | 0.100 | 0.371 |
| Total Titrable Acidity | 0.078 | 0.066** | 0.014 | 0.034 |
| pH | 0.033 | 0.535** | 0.069 | 0.216 |
| Fruit yield / plant (Kg) | 0.11 | 3.32** | 0.02 | 1.08 |
| Fruit yield (Kg/plot) | 29.88 | 849.19** | 4.72 | 275.30 |
Table text extracted from the original PDF; superscript letters are shown inline. The original table image is below.
View original table image
The genetic variability estimates for several qualities such as genetic coefficient of variation (GCV), phenotypic coefficient of variation (PCV), heritability, genetic advance, and genetic advance as a percentage of mean (Table 3). The coefficient of genotypic and phenotypic variability is a useful measure for measuring the degree of variation in a particular trait. They can also be used to compare the degree of variability among different quantitative features. The magnitude of the phenotypic coefficient of variation (PCV) was greater than the size of the genotypic coefficient of variation (GCV) for all traits (Table 3). Higher values of PCV compared to GCV was reported by Ahirwar et al.
| Characters | Mean | Min | Max | var (g) | var (p) | Heritability (%) | GA | GA% mean | GCV (%) | PCV (%) |
|---|---|---|---|---|---|---|---|---|---|---|
| Days to first flowering | 30.40 | 20.33 | 42.67 | 35.21 | 36.80 | 95.67 | 11.96 | 39.33 | 19.52 | 19.96 |
| Days to first fruit setting | 35.81 | 25.67 | 47.33 | 36.02 | 37.51 | 96.05 | 12.12 | 33.83 | 16.76 | 17.10 |
| Days to 50% flowering | 39.79 | 27.67 | 53.33 | 41.63 | 42.78 | 97.33 | 13.11 | 32.95 | 16.22 | 16.44 |
| Days to first fruit harvest | 103.08 | 77.00 | 117.33 | 172.99 | 183.25 | 94.40 | 26.32 | 25.54 | 12.76 | 13.13 |
| Average fruit weight (g) | 67.20 | 33.87 | 97.00 | 319.57 | 323.09 | 98.91 | 36.62 | 54.50 | 26.60 | 26.75 |
| Fruit equatorial diameter (mm) | 50.89 | 40.08 | 61.47 | 49.26 | 51.75 | 95.19 | 14.11 | 27.72 | 13.79 | 14.14 |
| Polar diameter (mm) | 48.83 | 37.09 | 70.47 | 75.28 | 78.15 | 96.33 | 17.54 | 35.92 | 17.77 | 18.10 |
| Locule number | 3.62 | 2.07 | 5.53 | 1.04 | 1.12 | 93.16 | 2.03 | 56.00 | 28.16 | 29.18 |
| Pericarp thickness (mm) | 5.02 | 3.69 | 6.43 | 0.53 | 0.73 | 71.98 | 1.27 | 25.24 | 14.44 | 17.02 |
| Number of flowers/cluster | 7.03 | 5.33 | 12.33 | 2.34 | 2.65 | 88.03 | 2.95 | 42.05 | 21.76 | 23.19 |
| Number of clusters/plant | 78.14 | 28.73 | 155.00 | 926.12 | 930.36 | 99.54 | 62.55 | 80.04 | 38.95 | 39.03 |
| Number of fruits/plant | 38.38 | 17.57 | 53.67 | 135.99 | 138.11 | 98.46 | 23.84 | 62.11 | 30.38 | 30.62 |
| No of primary branches/plant | 6.89 | 3.33 | 10.50 | 4.78 | 5.05 | 94.63 | 4.38 | 63.64 | 31.76 | 32.64 |
| Plant height (cm) | 100.80 | 39.87 | 179.33 | 1502.07 | 1510.05 | 99.47 | 79.63 | 78.99 | 38.45 | 38.55 |
| Total Soluble Solids | 4.45 | 3.03 | 5.20 | 0.28 | 0.38 | 73.67 | 0.94 | 21.06 | 11.91 | 13.88 |
| Total Titrable Acidity | 1.55 | 1.37 | 1.83 | 0.02 | 0.03 | 54.53 | 0.20 | 12.90 | 8.48 | 11.48 |
| pH | 4.32 | 3.73 | 5.33 | 0.16 | 0.22 | 69.34 | 0.68 | 15.66 | 9.13 | 10.96 |
| Fruit yield/plant (Kg) | 2.59 | 0.95 | 4.01 | 1.10 | 1.12 | 98.34 | 2.14 | 82.82 | 40.54 | 40.88 |
| Fruit yield (Kg/plot) | 41.38 | 15.20 | 64.08 | 281.49 | 286.21 | 98.35 | 34.28 | 82.82 | 40.54 | 40.88 |
Table text extracted from the original PDF; superscript letters are shown inline. The original table image is below.
View original table image
(2013) [2] , Kumar et al. (2016) [18] and Pandey et al. (2018) [23] , Maurya et al. (2022) [21] . According to Dar and Sharma (2011) [11] , the greater PCV values in comparison to the GCV values indicated that there was some influence of environment on all of the qualities under consideration.
Sivasubramanyan and Madhavamenon (1973) [29] defined GCV and PCV as low when less than 10%, moderate when 10-20%, and high when greater than 20%. Estimates of high genotypic variance were recorded for both fruit yield per plant and fruit yield (kg per plot), number of clusters per plant, plant height (cm), number of primary branches per plant, number of fruits per plant, locule number, average fruit weight, number of flower per cluster; whereas, days to first flowering, polar diameter, days to first fruit setting, days to 50% flowering, pericarp thickness, fruit equatorial diameter, days to first fruit harvest, total soluble solids, showed moderate genotypic variation, whereas pH, total titrable acidity showed low genotypic variation. Dar and Sharma (2011) [11] previously observed high GCV and PCV values for fruit number per plant and overall yield, whereas Prema et al. (2011) [25] saw the same for fruit polar and equatorial diameter, as well as fruit TSS. Critical selection qualities are heritability and genetic advancement. Estimating heritability is especially important when genotypic coefficients of variation provide information on the variance present across genotypes for a certain trait. The proportion of a trait's variability that can be handed down to children is referred to as heritability. Johnson et al. (1955) [16] classed heritability estimates as low (less than 30%), moderate (30-60%), or high (greater than 60%). The heritability of all variables evaluated in this study was found to be high, indicating a predominance of additive gene activity. This observation is consistent with the findings of Ara et al. (2009), Agarwal et al. (2014) [1] , and Bhandari et al. (2017) [6] , who reported similar results in previous studies. When heritability estimates are accompanied by the genetic advance, it becomes more accurate to predict genetic gains through selection (Johnson et al. 1955) [16] . Johnson et al. (1955) [16] also proposed a classification of genetic advance as a percentage of mean, with low (less than 10%), moderate (10-20%), and high (greater than 20%) categories. High heritability combined with high genetic progress shows that additive gene action has a significant influence, making selection successful in such instances. High heritability mixed with little genetic progress, on the other hand, shows non-additive gene activity, rendering selection ineffectual. Low heritability combined with high genetic progress suggests additive gene effects in trait inheritance, but significant environmental influence on trait expression, rendering early-generation selection ineffectual. In such instances, though, selection in later generations may be effective. If both low heritability and poor genetic progress are seen, the trait is driven mostly by environmental variables, rendering selection ineffectual. Burton and De Vane (1953) [7] reported that, when combined with heritability estimates, genetic coefficients of variability can be used to forecast the degree of improvement feasible by selection. High heritability values (in the broad sense) were observed in this study for all traits, including number of clusters per plant (99.54%), plant height (99.47%), average fruit weight (98.91%), number of fruits per plant (98.46%), fruit yield (kg/plot) (98.35%), fruit yield per plant (98.34%), days to 50% flowering (97.33%), polar diameter (96.33%), days to first fruit setting (96.05%), days to first flowering(95.67%), fruit equatorial diameter (95.19%), number of primary branches per plant (94.63%), days to first fruit harvest (94.40%), and locule number (93.16%). (Table 3). Heritability was high for all the traits under study suggesting predominance of additive gene action for the traits. Kumar et al. (20018) [23] , Ara et al. (2009), Agarwal et al. (2014) [1] , Bhandari et al. (2017) [6] and Maurya et al. (2022) [21] also reported similar findings earlier. The estimate of genetic advance is combined with heritability, it leads to more accurate predictions of genetic gain under selection reported by Johnson et al. (1955) [16] . Highest estimate of genetic advance was recorded in plant height (79.63%) followed by number of cluster per plant (62.55%), whereas, average fruit weight (36.62%), fruit yield kg/plot (34.28%), days to first fruit harvest (26.32%), showed moderate genetic advance and number of fruits/plant (23.84%), polar diameter (17.54%), fruit equatorial diameter (14.11%), days to 50% flowering (13.11%), days to first fruit setting (12.12%), days to first flowering (11.96%), number of primary branches per plant (4.38%), number of flower per cluster (2.95%), fruit yield per plant (2.14%), locule number (2.03%), pericarp thickness (1.27%), total soluble solids (0.94%), pH (0.68%), total titrable acidity (0.20%) showed lowest estimate of genetic advance. Golani et al. (2007) [15] previously showed high heritability for fruit weight, number of locules/fruit, and fruit production. Rai et al. (2016) [26] discovered strong heritability with high genetic gain for fruit yield per plant, average fruit weight, and number of fruits per plant.
Conclusion
Therefore, based on the results of the current study, it can be inferred that a high genetic variability for various fruit quality and biochemical traits was produced using a variety of tomato genotypes, indicating the existence of a significant opportunity for these genotypes to be improved for these traits through selection and hybridization. Furthermore, for all characters under study, moderate to high GCV, high heritability, and moderate to high genetic advance as a percentage of mean were reported, indicating a predominance of additive gene action and ample opportunity for the improvement of the concerned traits through selection.
References
26 in the original paper- Agarwal A, Arya DN, Ahmed Z. Genetic variability studies in tomato (Solanum lycopersicum L.). Progressive Horticulture. 2014;46(2):358-361.
- Ahirwar CS, Vijay B, Vinay P. Genetic variability, heritability and correlation studies in tomato genotypes (Solanum lycopersicum L.). Int. J. Agric. Sci. 2013;9(1):172-176.
- Akhtar S, Hazra P. Sampling technique for optimum worth of the fruit characters in tomato (Solanum lycopersicum L.). Indian J Agric. Sci. 2013;83(11):1179-1183.
- Ara A, Narayan R, Ahmed N, Khan SH. Genetic variability and selection parameters for yield and quality attributes in tomato. Indian J Hort. 2017;66(1):73-78.
- Bhandari HR, Srivastava K, Eswar Reddy G. Genetic variability, heritability and genetic advance for yield traits in tomato (Solanum lycopersicum L.). Int. J Curr. Microbiol. Appl. Sci. 2009;6(7):4131-4138.
- Burton GW, De Vane EH. Estimating heritability in tall fescue (Festuca arundinacea) from replicated clonal material. Agronomy J. 1953;45(10):478-481.
- Chauhan VBS, Kumar R, Behera TK, Yadav RK. Studies on Heterosis for yield and its Attributing Traits in Tomato (Solanum lycopersicum L.). International Journal of Agriculture, Environment and Biotechnology. 2014;7(1):95-100.
- Clinton SK. Tomatoes or lycopene: A role in prostate carcinogenesis. The Journal of nutrition. 2005;135(8):2057S-2059S.
- Comstock RE, Robinson HF. Genetic parameters, their estimations and significance. Proc. 6 th Int. Garssland Cong. 1952;1:284-291.
- Dar RA, Sharma JP. Genetic variability studies of yield and quality traits in tomato (Solanum lycopersicum L.). Int. J Plant Breeding Genet. 2011;5(2):168-174.
- Das MR, Hossain T, Sultana MM, Sarwar SHMG, Hafiz MHR. Effect of different sowing time on the quality of tomato varieties. Bangladesh Research Publications Journal. 2011;6(1):46-51.
- Dorgan JF, Sowell A, Swanson CA, Potischman N, Miller R, Schussler N, et al. Relationships of serum carotenoids, retinol, αtocopherol, and selenium with breast cancer risk: results from a prospective study in Columbia, Missouri (United States). Cancer Causes & Control. 1998;9:89-97.
- Frusciante L, Carli P, Ercolano MR, Pernice R, Di Matteo A, Fogliano V, et al. Antioxidant nutritional quality of tomato. Molecular nutrition & food research. 2007;51(5):609-617.
- Golani IJ, Mehta DR, Purohit VL, Pandya HM, Kanzariya MV. Genetic variability, correlation and path coefficient studies in tomato. Ind. J Agric. Res. 2007;41:146-149.
- Johnson HW, Robinson HF, Comstock RE. Estimates of genetic and environmental variability in soyabean. Agronomy J. 1955;47:314-318.
- Kumar PP, Sathish V, Ramesh D, Bhutia ND, Koundinya AVV, Hazra P. Assessment of genetic variability, correlation and path coefficients for yield components and quality traits in tomato. Int. J Agric. Sci. 2016;8(54):2870-2873.
- Lush JL. Inter-size correlation regression of offspring on dairy as a method of estimating heritability of characters. Proc. Amer. Soc. Animal Prod. 1940;33:293-301.
- Maurya D, Akhtar S, Chattopadhyay T, Kumar R, Sahay S, Sangam S, et al. Genetic Variability and Character Association in Tomato (Solanum Lycopersicum L.). Bangladesh Journal of Botany. 2022;51(4):747-757.
- Meena OP, Bahadur V. Genetic association analysis for fruit yield and its contributing traits of indeterminate tomato (Solanum lycopersicum L.) germplasm under open field condition. J Agric. Sci. 2014;7(3):148-163.
- Pandey RP, Kumar N, Mishra SP. Study on genetic variability, heritability and genetic advance in tomato (Solanum lycopersicum L). J. Pharmacog. Phytochem. 2018;7(3):3387-3389.
- Peralta IE, Spooner DM, Knapp S. Taxonomy of wild tomatoes and their relatives (Solanum sect. Lycopersicoides, sect. Juglandifolia, sect. Lycopersicon; Solanaceae). Syst. Bot. Monogr. 2008;84:1-186.
- Prema G, Indiresh KM, Santhosha HM. Studies on genetic variability in cherry tomato (Solanum lycopersicum var. Cerasiforme). Asian J. Hort. 2011;6(1):207-209.
- Rai AK, Vikram A, Pandav A. Genetic variability studies in tomato (Solanum lycopersicum L.) for yield and quality traits. Int. J Agric. Environ. Biotech. 2016;9(5):739-744.
- Saleem MY, Iqbal Q, Asghar M. Genetic variability, heritability, character association and path analysis in F 1 hybrids of tomato. Pakistan Journal of Agricultural Sciences. 2013;50(4):649-653.
- Sepat NK, Sepat SR, Sepat S, Kumar A. Energy use efficiency and cost analysis of tomato under greenhouse and open field production system at Nubra valley of Jammu and Kashmir. International Journal of Environmental Sciences. 2013;3(4):1233-1241.
- Sivasubramanian S, Madhavamenon P. Combining ability in rice. Madras Agric. J. 1973;60:419-421.
Cited by 1
From OpenAlex, OpenCitations and reference lists read by Scinovex
- Evaluation of genetic variability, heritability and genetic advance in forty genotypes of tomato (Solanum lycopersicum L.) for yield and yield contributing traits
Pushpendra Singh, Aastik Jha, Ashish Kumar Singh, CN Ram, Anil Kumar, Sanjeev Singh · International Journal of Research in Agronomy · 2026
The Present Investigation involved Forty genotypes of tomato (Solanum lycopersicum L.) evaluated for genetic variability, heritability, and genetic advance in yield and yield-contributing traits. The trial was laid out in a Completely Randomized Block Design at the Main Experimental Station, Department of Vegetable Science, Acharya Narendra Deva University of Agriculture and Technology, Ayodhya, Uttar Pradesh, during the year 2024-25. The phenotypic coefficient of variation (PCV) values were slightly higher than the genotypic coefficient of variation (GCV) values for all characters, indicating