
Research article · 2023 · Full text
International Journal of Statistics and Applied MathematicsDesigning of quality interval skip-lot sampling plan with multiple deferred state sampling plan
Volume 8(5) · Pages 90–93 · DOI: 10.22271/maths.2023.v8.i5b.1222 ↗
Research areasAdvanced Statistical Process MonitoringManufacturing Process and OptimizationIndustrial Vision Systems and Defect Detection
Abstract
Author-writtenThe Importance of this paper is to account for the possibility of dependence among the items of a sample. The development of new method for designing sampling plans based on range of quality instead of point-wise description of quality by invoking a novel approach called Quality Regions. This method seems to be versatile and can be adapted to the elementary production process where the stipulated quality level is advisable to fix at a later stage and provides a new procedure meant for designing of Quality interval skip-lot sampling plan with multiple deferred state sampling plan MDS (0, 2). (MAPD) is also considered for the selection of parameters for Skip-lot sampling plan. New quality descriptors called operating ratios are introduced to design the sampling plan.
Summary
Source-checkedPlain-language reading of the full paper, prepared with AI and checked against the text. Each point links to the authors' own words.
Why it matters
- Sampling inspection is used in statistical quality control to lower inspection costs while ensuring products meet a required quality level. View evidence ↗
- This research aims to address the potential dependence between items within a sample. View evidence ↗
- The authors propose using 'Quality Regions' to design sampling plans based on a range of quality rather than a single point-wise description. View evidence ↗
The question
- The study seeks to develop a new procedure for designing a quality interval skip-lot sampling plan that utilizes a multiple deferred state sampling plan MDS (0, 2) as its reference. View evidence ↗
What they did
- The proposed SkSP-R (i, f, s, m) plan is defined by the fraction of lots inspected (f), the normal inspection clearance number (i), the re-inspection clearance number (s), and the number of re-inspection submissions (m). View evidence ↗
- The MDS (0, 2) reference plan accepts a lot if zero defectives are found, rejects it if more than two are found, and defers acceptance if exactly two are found, pending the acceptance of the next m lots. View evidence ↗
- The authors used MS-Excel software to simulate tables for various parameter combinations (n, i, s, f, m1, m2, k) to design the plan. View evidence ↗
- The authors defined a Quality Decision Region (QDR) as the quality interval (p1 < p < p*) where products are accepted at the engineer's quality average. View evidence ↗
- A Probabilistic Quality Region (PQR) is defined as the interval (p1 < p < p2) where acceptance probability ranges from 0.10 to 0.95. View evidence ↗
What they found
- For parameters f=1/3, I=1, K=1, m1=1, m2=1, the simulated quality ranges were d1=0.4286, d2=2.6037, d3=3.0323, and d4=1.1413. View evidence ↗
- When the inspection fraction f is reduced to 1/7 (with other parameters I=1, K=1, m1=1, m2=1), the quality ranges increase to d1=0.6648, d2=3.0603, d3=3.7251, and d4=1.4069. View evidence ↗
- With f=3/5 and a higher clearance number I=5 (K=2, m1=1, m2=1), the quality ranges are d1=0.3014, d2=1.8243, d3=2.1257, and d4=0.6167. View evidence ↗
- For parameters f=1/2, I=3, K=2, m1=5, m2=1, the resulting quality ranges are d1=0.3593, d2=1.9706, d3=2.3299, and d4=0.8732. View evidence ↗
What it means
- The authors conclude that the primary benefit of skip-lot sampling is the reduction of total inspection costs by decreasing the frequency of sampling. View evidence ↗
- The authors state they have successfully evolved a new procedure combining the SkSP-R skip-lot sampling plan with the MDS (0,2) reference plan. View evidence ↗
Visual summary
3 visualsIllustrations explain the paper; charts are replotted from the paper's own table values.
Sampling Plan Workflow
AI-generated conceptual illustration (Industrial manufactured metal components on a conveyor belt). It explains the idea and does not show study data.
View source evidence ↗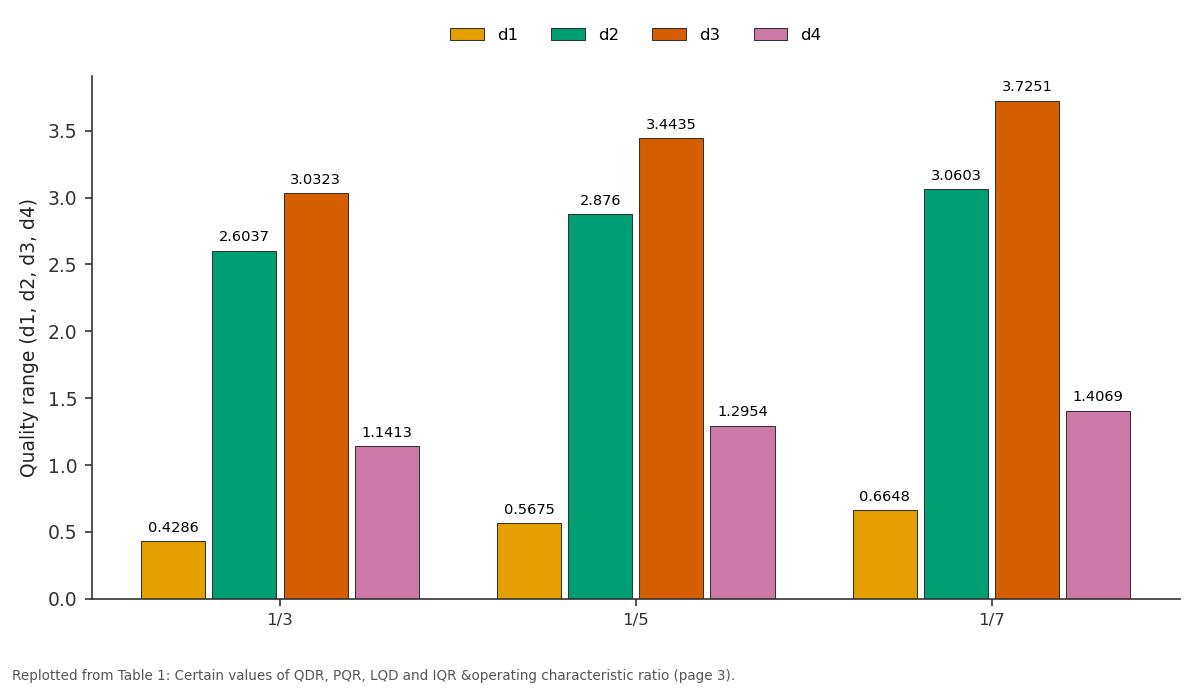
d1 and d2 and more: 1/3 vs 1/5 vs 1/7
Replotted from Table 1 (page 3) of the original paper. Every bar is the paper's own table value.
View source evidence ↗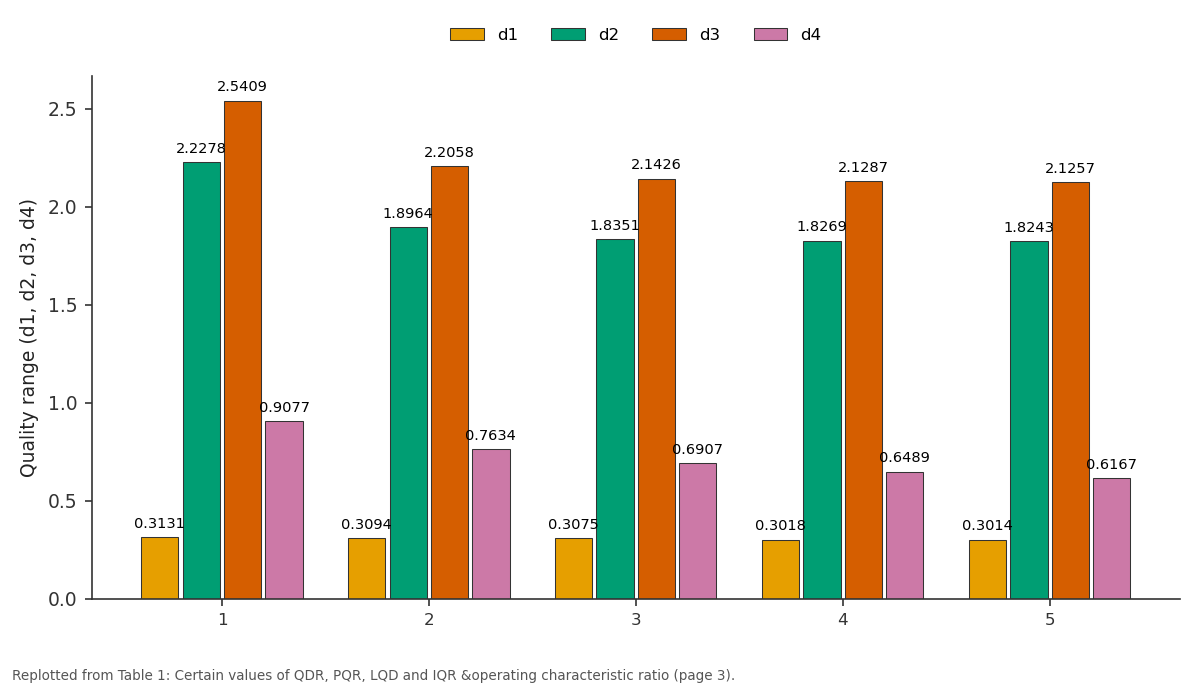
d1 and d2 and more: 1 vs 2 vs 3 vs 4 vs 5
Replotted from Table 1 (page 3) of the original paper. Every bar is the paper's own table value.
View source evidence ↗Figures & tables
From the original paper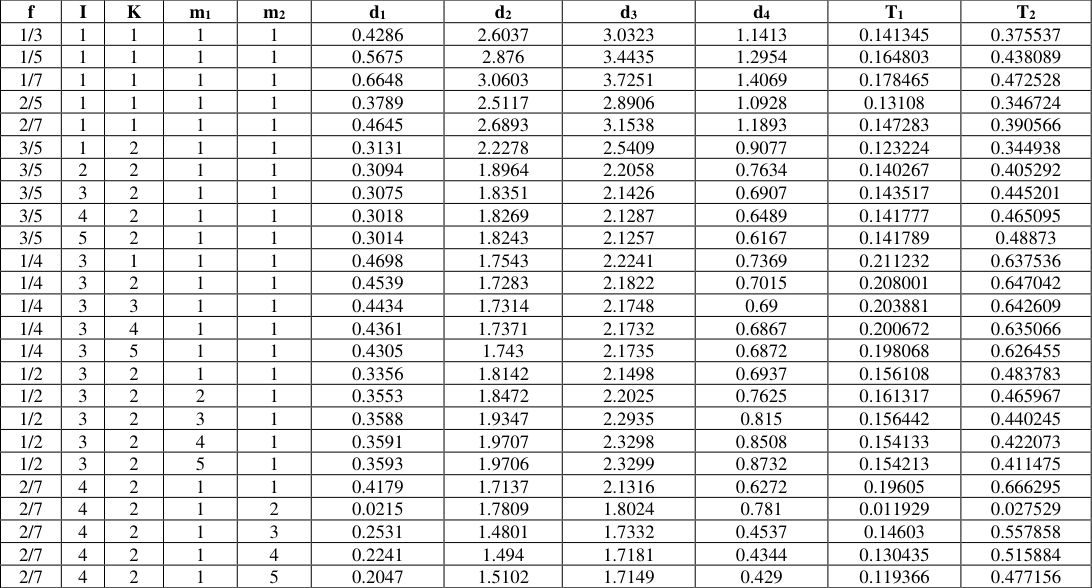 Table 1
Introduction
Acceptance sampling is an important field of statistical quality control that was popularized by Dodge and Roming. The important of sampling inspection is reduce the cost of inspection while at the same time assuring the customer to satisfy an adequate level of quality on item being inspected. Dodge [1] has introduced the concept of skip-lot sampling, by applying the principles of a continuous sampling plan of type CSP-1 to a series of lots or batches of material. Perry [2] has developed a system of sampling inspection plan known as SkSP-2. This plan involves inspection of only some fraction 'f' of the submitted lots when quality of the submitted product is good as demonstrated by the quality of the product. Suresh [3] has given for the selection of Skip-lot Sampling Plan of type SkSP-2 with reference plans SSP(c=0), SSP (c≠0) and DSP (0, 1) using consumer and producer quality levels. Recently Balamurali [4] has studied optimal designing of skip-lot sampling plan V with Double Sampling Plan as the reference plan. The design parameters are determined so as to minimize the average sample number while the specified producers risk and the consumer's risks are satisfied. Perry (1973) [7] formalized the application of skip-lot sampling to the situation in which each lot to be inspected and sampled according to lot inspection plan called the reference plan. This plan is designed as the SkSP-2 plan. Vijayaraghavan (2000) [9] introduced designing and evaluation method of skip-lot sampling plan of type SkSP-3 plan and the operating characteristic function is derived using the Marcov-chain approach. Balamurali and Chi-Hyuck jun (2006) [3] have developed SkSP-V plan based on the principles of CSP-V plan. Aslam et al. (2010) [1] have established the designing methodology to determine the parameters for syaytem of skip-lot sampling plan (2012) developed Optimal designing of skip-lot sampling plan of type SkSP-2 with double sampling plan as the reference plan. Further Kavithamani (2014) [6] has studied SkSP-V with various attribute reference plans towards acceptable and limiting quality levels of inspection lots. Recently, a new tpe of skip-lot sampling plan called SkSP-R was developed by Balamurali, et al. (2014) [3] based on the principle of continuous sampling procedure and resampling scheme for the quality inspection of continuous flow of bulk products.
Operating procedure for SkSP-R plan
The operating procedures of SkSP-R are as follows ▪ Begin the procedure with normal inspection by applying specified reference plan (For instance MDS (0, 2). During normal inspection, lots are inspected one by one in order of being submitted. ▪ When consecutive lots are accepted based on the reference plan under normal inspection, discontinue the normal inspection and switch to skipping inspection. during the skipping inspection, inspect only a fraction f of lots selected at random by applying reference plan. The skipping inspection is continued until a sampled lot is rejected. ▪ When a lot is rejected, after s consecutively sampled lot have been accepted, then go for re-inspection procedure for the immediate next lot as in step (5) given below.
▪
During re-inspection procedure, perform the inspection using the reference plan. If the lot is accepted, then continue the skipping inspection. On non-acceptance of the lot, re-inspection is done m times and the lot is rejected if it has been accepted on (m-1) st resubmission. ▪ If a lot is rejected on the re-inspection scheme, then we immediately revert to normal inspection.
▪
Replace or correct all non-conforming units found with conforming units in the rejected lots.
The proposed plan involves the reference plan with parameters, namely f, (0<f <1), the fraction of lots inspected in skipping inspection mode, i, the clearance number of normal inspection, s, the clearance number for re-inspection procedure and m, the number of time the lots are submitted for reinspection. In general, i, s and m are positive integers. So, the plan is designated as SkSP-R (i, f, s, m).
Operating procedure for MDS(r, b) plan
▪ For each lot select a sample of n units and test each unit for conformance to specified requirements ▪ Accept the lot if d (the observed number of observation of defectives) is less than or equal to r, reject the lot if d greater than or equal to r+b. ▪ If r+1≤d≤r+b, accept the lot if the forthcoming m lots in succession are all accepted.
Operating Procedure for MDS (0, 2)
A multiple deferred State sampling plan of Wortham and Baker (1976) with r=0 and b=2 is operated as follows: ▪ From each lot, take a random sample of n units and observe the non-conforming units d. ▪ If d=0, accept the lot; if d>2, reject the lot. If d=2, accept the lot, provided the forthcoming m lots in succession are all accepted (previous m lots in case of multiple dependent state sampling)
Operating procedure for SkSP-R with Multiple Deferred Sampling plan MDS (0, 2) as reference plan
Step 1: Begin the procedure with normal inspection following the procedure of Multiple Deferred State Sampling plan MDS (0, 2) as the reference plan. During normal inspection, lots are inspected one by one in order of being submitted satisfying the conditions of MDS (0, 2).
Step 2: From each lot submitted for inspection, take a random sample of size n and measure the number of defectives d. If d=0, accept the lot; if d>2, reject the lot. If d=2, accept the lot, provided the forthcoming m lots in succession are all accepted (previous m lots in case of multiple dependent state sampling).
Step 3: When i consecutive lots are accepted based on the reference plan under normal inspection, discontinue the normal inspection and switch to skipping inspection. During the skipping inspection, inspect only a fraction f of lots selected at random by applying Multiple Deferred Sampling plan MDS (0, 2) as the reference plan. The skipping inspection is continued until a sampled lot is rejected.
Step 4: When a lot is rejected, after s consecutively sampled lot have been accepted, then go for re-inspection procedure for the immediate next lot as in step (5) given below.
Step 5: During re-inspection procedure, perform the inspection using the reference plan. If the lot is accepted, then continue the skipping inspection. On non-acceptance of the lot, reinspection is done m times and the lot is rejected if it has been accepted on (m-1)st resubmission. If a lot is rejected on the reinspection scheme, then we immediately revert to normal inspection. Replace or correct all non-conforming units found with conforming units in the rejected lots.
Designing of SkSP-R with MDS (0, 2) for given n, i, f, k, m1 and m2
The procedure for designing SkSP-R with MDS (0, 2) as reference plan indexed through Acceptable and Limiting Quality Level is drawn and Tables are simulated for various combinations of parameter values n, i, s, f, m 1 , m 2 and k using MS-Excel Software.
Quality Decision Region (QDR)
This is an interval of quality (p 1 < p < p * ) in which product is accepted at Engineer's quality average. The quality is maintained up to p*. (MAPD) and sudden decline in quality is expected. This region is also called Reliable Quality Region (RQR).
Quality decision
Quality decision
Probabilistic Quality Region (PQR)
This is an interval of quality (p 1 < p < p 2 ) in which a product is accepted with a minimum probability 0.10 and maximum probability 0.95. Probabilistic Quality Range denoted as d 2 = (p 2 -p 1 ) is derived using the probability of acceptance expression.
Where, e -np +npe -np e-npm 2p,
Where P is the operating characteristic function of quality intervals 𝑑 1 < 𝑑 0 < 𝑑 3 < 𝑑 2
Limiting Quality Region (LQR)
It is an interval quality ((p * < p < p 2 ) in which product is accepted with a minimum probability 0.10 and maximum probability 0.95. Limiting Quality Range denoted as d 3 = (p 2p * ) is derived from the average acceptance Where, P is the probability of acceptance for reference plan and Q=1-P. The reference plan is with conditional repetitive group sampling plan and its parameters fixed. The Operating ratio for the selection of sampling plan are given the parameters. For example when n=100, f=1/2, i= 1, k=1, m 1 =1, m 2 =1 each of the entries by n and leads to the values given below
Conclusion
Acceptance sampling plan have been widely used in industry to determine whether the manufactured item satisfy the prespecified quality levels or not. This paper provide a new procedure has been evolved involving two methodologies namely Skip-lot Sampling Plan of type SkSP-R and Multiple Deferred Sampling plan MDS (0,2) as reference plan. This plan evolves the Quality decision region (QDR), Probabilistic Quality Region (PQR), Limiting Quality Region (LQR) and Indifference Quality Region (IQR) has been studied. Under Skip-lot sampling inspection, samples may be drawn from only a fraction of the submitted lots. The main purpose for Skip-lot sampling is to decrease the frequency of sampling inspection and reduce the total inspection costs.
Figures and tables from the paper
| f | I | K | m1 | m2 | d1 | d2 | d3 | d4 | T1 | T2 |
|---|---|---|---|---|---|---|---|---|---|---|
| 1/3 | 1 | 1 | 1 | 1 | 0.4286 | 2.6037 | 3.0323 | 1.1413 | 0.141345 | 0.375537 |
| 1/5 | 1 | 1 | 1 | 1 | 0.5675 | 2.876 | 3.4435 | 1.2954 | 0.164803 | 0.438089 |
| 1/7 | 1 | 1 | 1 | 1 | 0.6648 | 3.0603 | 3.7251 | 1.4069 | 0.178465 | 0.472528 |
| 2/5 | 1 | 1 | 1 | 1 | 0.3789 | 2.5117 | 2.8906 | 1.0928 | 0.13108 | 0.346724 |
| 2/7 | 1 | 1 | 1 | 1 | 0.4645 | 2.6893 | 3.1538 | 1.1893 | 0.147283 | 0.390566 |
| 3/5 | 1 | 2 | 1 | 1 | 0.3131 | 2.2278 | 2.5409 | 0.9077 | 0.123224 | 0.344938 |
| 3/5 | 2 | 2 | 1 | 1 | 0.3094 | 1.8964 | 2.2058 | 0.7634 | 0.140267 | 0.405292 |
| 3/5 | 3 | 2 | 1 | 1 | 0.3075 | 1.8351 | 2.1426 | 0.6907 | 0.143517 | 0.445201 |
| 3/5 | 4 | 2 | 1 | 1 | 0.3018 | 1.8269 | 2.1287 | 0.6489 | 0.141777 | 0.465095 |
| 3/5 | 5 | 2 | 1 | 1 | 0.3014 | 1.8243 | 2.1257 | 0.6167 | 0.141789 | 0.48873 |
| 1/4 | 3 | 1 | 1 | 1 | 0.4698 | 1.7543 | 2.2241 | 0.7369 | 0.211232 | 0.637536 |
| 1/4 | 3 | 2 | 1 | 1 | 0.4539 | 1.7283 | 2.1822 | 0.7015 | 0.208001 | 0.647042 |
| 1/4 | 3 | 3 | 1 | 1 | 0.4434 | 1.7314 | 2.1748 | 0.69 | 0.203881 | 0.642609 |
| 1/4 | 3 | 4 | 1 | 1 | 0.4361 | 1.7371 | 2.1732 | 0.6867 | 0.200672 | 0.635066 |
| 1/4 | 3 | 5 | 1 | 1 | 0.4305 | 1.743 | 2.1735 | 0.6872 | 0.198068 | 0.626455 |
| 1/2 | 3 | 2 | 1 | 1 | 0.3356 | 1.8142 | 2.1498 | 0.6937 | 0.156108 | 0.483783 |
| 1/2 | 3 | 2 | 2 | 1 | 0.3553 | 1.8472 | 2.2025 | 0.7625 | 0.161317 | 0.465967 |
| 1/2 | 3 | 2 | 3 | 1 | 0.3588 | 1.9347 | 2.2935 | 0.815 | 0.156442 | 0.440245 |
| 1/2 | 3 | 2 | 4 | 1 | 0.3591 | 1.9707 | 2.3298 | 0.8508 | 0.154133 | 0.422073 |
| 1/2 | 3 | 2 | 5 | 1 | 0.3593 | 1.9706 | 2.3299 | 0.8732 | 0.154213 | 0.411475 |
| 2/7 | 4 | 2 | 1 | 1 | 0.4179 | 1.7137 | 2.1316 | 0.6272 | 0.19605 | 0.666295 |
| 2/7 | 4 | 2 | 1 | 2 | 0.0215 | 1.7809 | 1.8024 | 0.781 | 0.011929 | 0.027529 |
| 2/7 | 4 | 2 | 1 | 3 | 0.2531 | 1.4801 | 1.7332 | 0.4537 | 0.14603 | 0.557858 |
| 2/7 | 4 | 2 | 1 | 4 | 0.2241 | 1.494 | 1.7181 | 0.4344 | 0.130435 | 0.515884 |
| 2/7 | 4 | 2 | 1 | 5 | 0.2047 | 1.5102 | 1.7149 | 0.429 | 0.119366 | 0.477156 |
Table text extracted from the original PDF; superscript letters are shown inline. The original table image is below.
View original table image
References
8 in the original paper- Aslam M, Balamurali S, Jun CH, Ahmad M. Optimal designing of a Skip lot Sampling Plan by two point method, Pakistan Journal of Statistics. 2010;26(4):585592.
- Balamurali S, Subramani J. Optimal designing of Skip-lot Sampling plan of type SkSP-2 with double sampling plan as the reference plan, Journal of Statistical Theory and Practice. 2012;6:354-36.
- Balamurali S, Jun CH. Repetitive group sampling procedure for variables inspection, Journal of Applied Statistical Science. 2006;33(3):327-338.
- Dodge HF. Skip-lot Sampling Plan, Industrial Quality control. 1955;11(5):3-5.
- Perry RL. Skip-lot Sampling Plans, Journal of Quality Technology. 1973;5(3):123-130.
- Rambert Vaerst R. A procedure of construct multiple deferred state sampling plans. Methods of Operations Research. 1982;37:477-485.
- Vijayaraghavan R Design and evaluation of skip-lot sampling plans of type SkSP-3, Journal of Applied Statistics. 2000;27(7):901-908.
- Wortham AW, Baker RC. Multiple Deferred State Sampling Inspection, the International Journal of Production Research. 1976;14(6):719-731.