
Research article · 2022 · Full text
International Journal of Agriculture and NutritionClimate change and agriculture in the Sri Lankan context
Volume 4(2) · Pages 131–137 · DOI: 10.33545/26646064.2022.v4.i2b.118 ↗
Research areasClimate Change Policy and EconomicsIntegrated Energy Systems OptimizationClimate Change and Sustainable Development
Abstract
Author-writtenThe agriculture sector in Sri Lanka very similar to global situation contributes 25% of the GHG emission especially through methane, nitrous oxide, and carbon dioxide. Among sources of GHG emission in the agriculture sector, the main emphasis should be given to emission reduction from rice fields, livestock, and cultivated area of organic soils in the order of importance. GHG emissions from cropland (mostly rice cultivation and cultivation of organic soils) account for 69.5% of total emissions, while the livestock sector (especially enteric fermentation) accounts for 30.5 %. In addition, the green cover helps to reduce the greenhouse effect where, reflectivity or the land surface albedo (LSA) reduces by the green cover. The general objective of the main programme was to prepare a Carbon Net Zero Road Map and a Strategic Plan to enable the country to achieve its Carbon Net Zero goal by the year 2050 with clear milestones. The present paper confines its objective to the agriculture sector. The strategic approach was adopted in this exercise with two scenarios to achieve an acceptable level of GHG emission and possible carbon sequestration rates from agricultural lands by the year 2050. The baseline scenario was compared with the suggested scenarios namely 1. NDC 2030 scenario extended to 2050, and 2. Best case scenario with all possible improvements to NDC 2030. Results showed that the extended NDC 2030 could reduce GHG emission by 30% of that of 2025 and GHG emission can be reduced by 60 % in 2050 through: removal of rice straws and through good management practices in paddy fields, use of alternatives to chemical fertilizer and good management of soils. Further in case of livestock, improved feed quality and animal comfort can contribute to reduction of CH4. Carbon sequestration in paddy and rain-fed uplands can be increased through ‘Evergreen Agro- ecosystem’ concept and good land management practices.
Summary
Source-checkedPlain-language reading of the full paper, prepared with AI and checked against the text. Each point links to the authors' own words.
Why it matters
- Climate change poses a significant risk to Sri Lanka, with approximately 50% of its 22 million citizens living in coastal areas vulnerable to sea level rise. View evidence ↗
- The agricultural sector is a major contributor to greenhouse gas (GHG) emissions in Sri Lanka, accounting for 25% of the total, primarily through methane, nitrous oxide, and carbon dioxide. View evidence ↗
- Temperature trends in Sri Lanka show a general increase of 0.16 °C between 1961 and 1990, with some areas like Nuwara Eliya seeing minimum temperature increases of 2.0 °C per decade. View evidence ↗
The question
- The study aims to identify strategic scenarios to achieve acceptable GHG emission levels and carbon sequestration rates within the agricultural sector by 2050. View evidence ↗
What they did
- The researchers compared a baseline scenario against two proposed scenarios: an extension of the NDC 2030 targets to 2050 and a 'Best case' scenario incorporating all possible improvements. View evidence ↗
- The 'Best case' scenario refined the baseline by adding detailed livestock parameters, categorizing cattle by breed and function (milking, non-milking, bulls, and calves). View evidence ↗
- The best-case scenario is based on four primary strategies: reducing methane from paddy fields, using chemical fertilizer alternatives to lower N2O, improving livestock feed and comfort, and reducing soil N2O emissions. View evidence ↗
What they found
- Within the agricultural sector, cropland (primarily rice and organic soils) accounts for 69.5% of emissions, while livestock (mainly enteric fermentation) accounts for 30.5%. View evidence ↗
- The study finds that GHG emissions could be reduced by 60% by 2050 through a combination of rice straw removal, improved paddy management, and the use of chemical fertilizer alternatives. View evidence ↗
- Tea plantations show varying carbon sequestration potential by region: low country (6659 kg C/ha/yr), Uva (5085 kg C/ha/yr), mid-country (3497 kg C/ha/yr), and up country (2344 kg C/ha/yr). View evidence ↗
What it means
- The authors conclude that implementing the 'Evergreen Agro-ecosystem' concept and improved land management can increase carbon sequestration in rain-fed uplands and paddy fields. View evidence ↗
- To increase carbon sequestration in tea lands, the authors recommend an agro-ecosystem approach, crop diversification, intercropping, optimal shade tree density, and rehabilitation of old lands. View evidence ↗
Visual summary
1 visualsIllustrations explain the paper; they do not show study data.
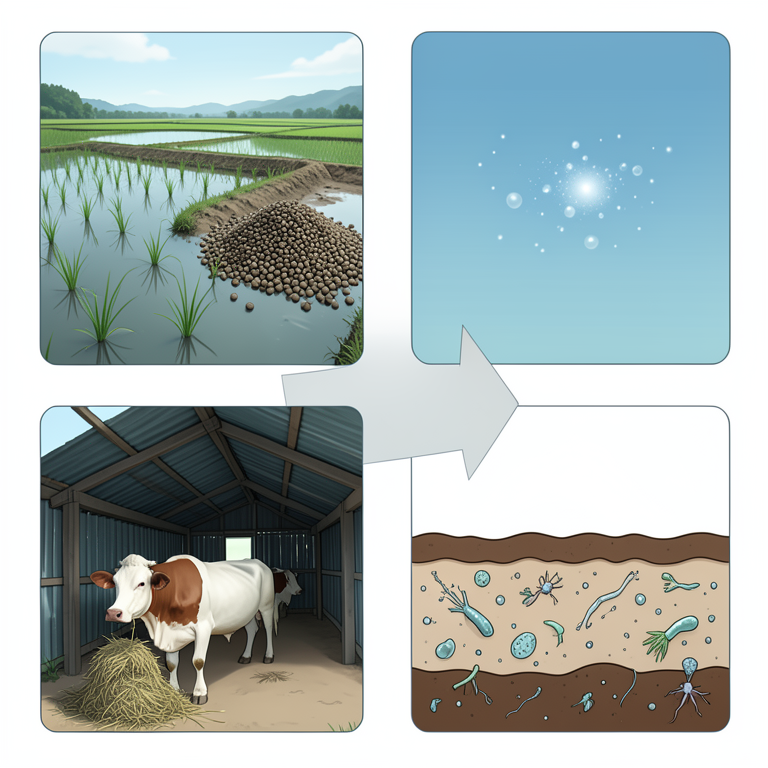
Four-Pillar GHG Reduction Strategy
AI-generated conceptual illustration (Sri Lankan agricultural landscape featuring paddy fields, livestock, and soil). It explains the idea and does not show study data.
View source evidence ↗Figures & tables
From the original paper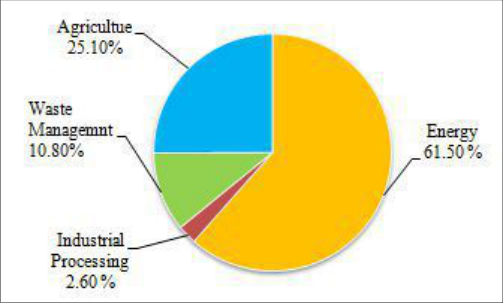 Figure 1
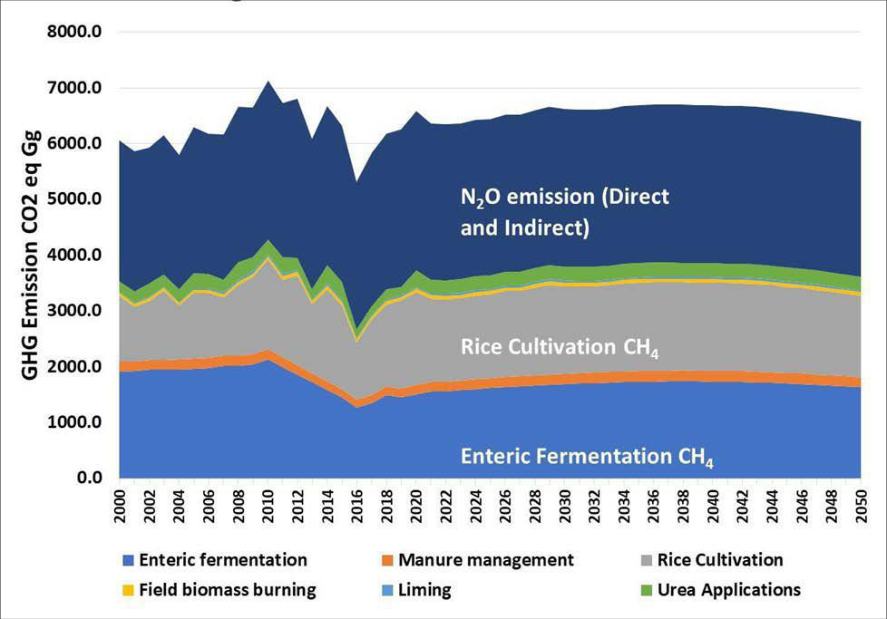 Figure 2
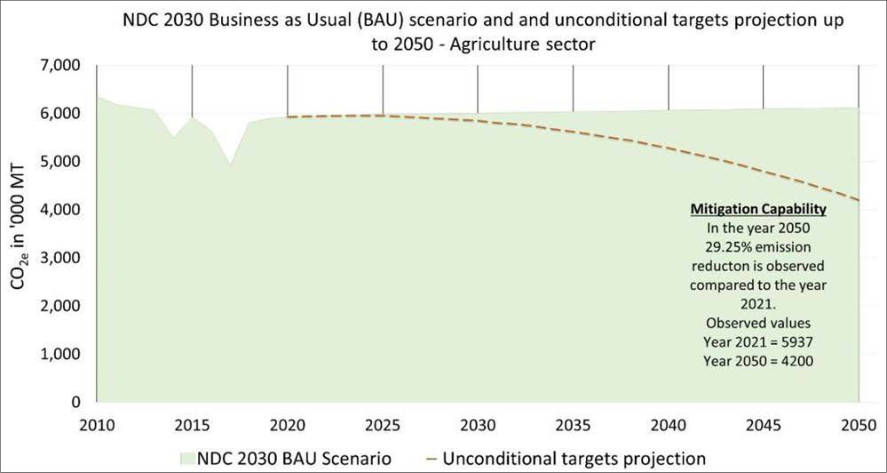 Figure 3
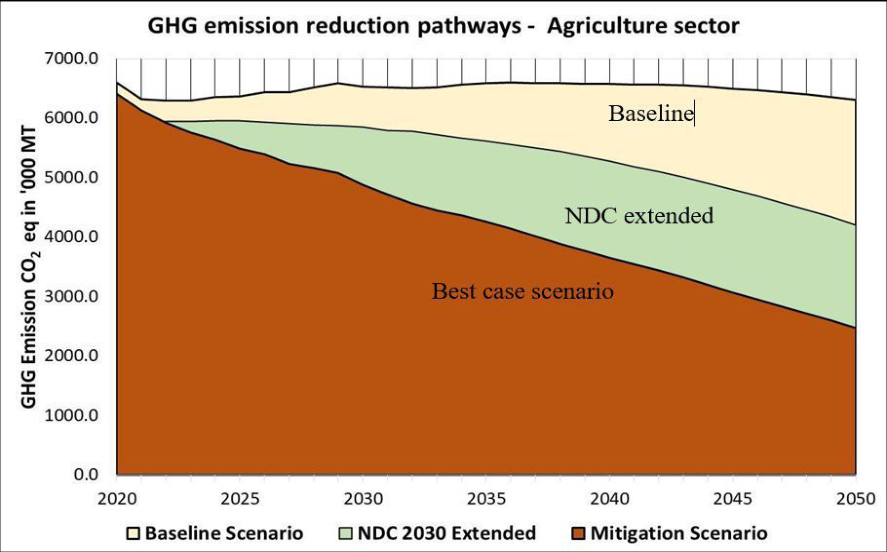 Figure 4
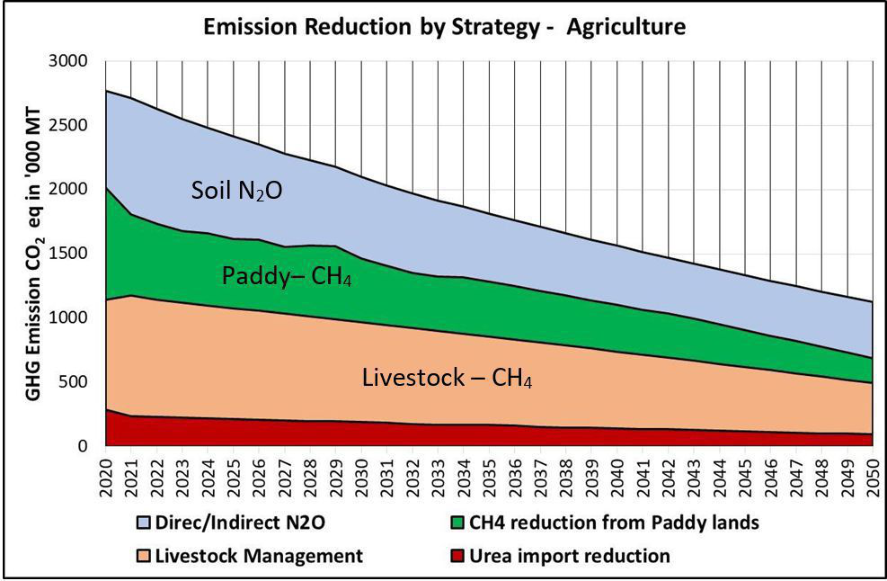 Figure 5
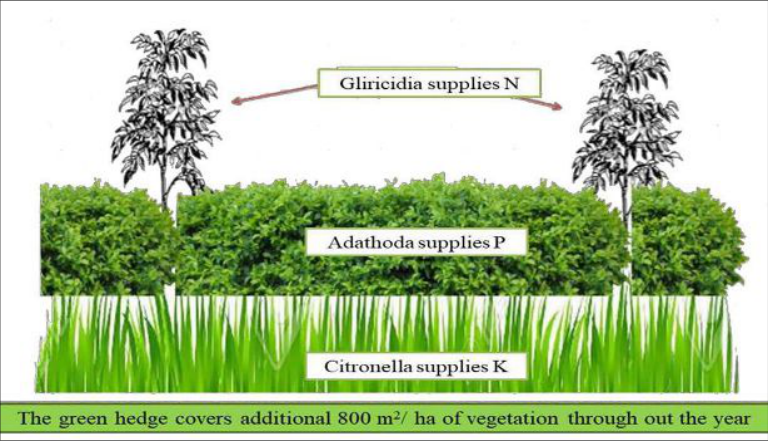 Figure 6
Introduction
Climate change occurs at global scale making varying impacts on different countries. In Sri Lanka about 50 percent of its 22 million citizens live in low-lying coastal areas in the west, south, and south-west of the island, and are at risk of future sea level rise [1] . Climate change affects the biodiversity, in the terrestrial region as well as in marine ecosystems [2] . In addition, the climate change may affect agricultural productivity, causing natural disasters like floods and droughts, increasing the spread of communicable diseases, and finally undermining the living standards of people. A general increase in temperature trends 0.16 °C has been traced over the years of 1961-1990 with the highest increase of minimum temperature in Nuwara Eliya by 2.0 °C per decade. A vast difference is traced in rising temperatures as the 100 year warming trend from 1896 to 1996 is only 0.003 °C per year, meanwhile the 10 year temperature trend from 1987 to 1996 is already 0.025 °C per year. This indicates that the warming trend is accelerating. According to scientists this is due to the increase in the greenhouse gasses (global) as well as the rapid urbanization causing the heat effect (local) [3] .
The mean annual temperature in the country is expected to increase in the near future (2030), and to possibly increase even more in the years surrounding 2050. The mean annual precipitation has decreased by 144 millimeters (mm) (7%) during the period 1961-1990 compared to that of 1931-1960 [4] . However, the bigger question of national importance is what Sri Lanka's climate will look like in 50 or 100 years and how prepared the country is to face such changes. Few studies attempted to project future climate scenarios for Sri Lanka and to identify climate change (CC) impacts on agriculture, water resources, the sea level, the plantation sector, the economy and health. Agriculture sector contributes 25% of the greenhouse gas emission in Sri Lanka primarily through the emission and consumption of greenhouse gases (GHGs) such as methane, nitrous oxide, and carbon dioxide. Contribution of various sectors to GHG emission in Sri Lanka is shown in Fig. 1. In addition to that, green cover helps to reduce the greenhouse effect where, reflectivity or the land surface albedo (LSA) which is the ratio of the upwelling radiant energy relative to the down welling irradiance incident upon a surface of the land reduces by the green cover. In ecological systems, albedo can affect physical and physiological processes of ecosystems, such as energy balance and evapotranspiration by regulating the microclimate conditions of plant canopies and their absorption of solar radiation [5] . Agricultural land covers approximately 2.6 million hectares or roughly 42% of Sri Lanka's total land area. The great majority of the land used for food production is owned by about 1.65 million smallholder farmers. With average landholdings totaling less than 2 hectares, smallholder farmers are in charge of almost 80% of Sri Lanka's total annual crop production [6] .
Problem perspective
The agricultural area in Sri Lanka has increased gradually in the past decade. With the end of the internal conflict, previously inaccessible territories have been converted into productive cropland. According to the statistics of Food and Agriculture Organization of United Nations, from 2003 to 2013, rice-harvested area has been increased by 30.4% (911,440 to 1,188,230 hectares), while maize-harvested area was doubled (27,060 to 67,720 hectares). During the same timeframe, pastureland has not increased significantly, and shifting cultivation (chena) declined, due in part to limited land availability. Home gardens, which contribute to household level food security in rural Sri Lanka, cover a substantial portion (14.8%) of the total land area [7] . These changing patterns of land use, coupled with the strict enforcement of anti-deforestation laws, have resulted in a decreasing rate of deforestation over the past decade. Agriculture accounts for 25.1% (4.71 million tonnes CO 2 e) of the country's total greenhouse gas (GHG) emissions. Of this, GHG emissions from cropland (mostly rice cultivation and cultivation of organic soils) account for 69.5% of total emissions, while the livestock sector (especially enteric fermentation) accounts for 30.5 % [8] . The main emphasis in agricultural sector should be given to GHG emission reduction from rice fields, livestock, and cultivated area of organic soils in the order of importance. In order to develop necessary mitigation measures carbon dioxide and methane emissions must be quantified for paddy cultivated areas. Nitrous Oxide (N 2 O) is liable for 6% of worldwide anthropogenic GHG emissions; 90% of those emissions are associated with agriculture. Increased N fertilizer usage and animal production are the most significant sources of the projected increase in N 2 O. Agricultural soils are the key anthropogenic sources of N 2 O and contribute around 60% of human-derived N 2 O emissions [9] . Urea is the major source of supply of nitrogen to crop production in Sri Lanka and urea is imported to Sri Lanka for agricultural use. Around 64% of the imported urea, with a nitrogen content of 46%, is used in paddy cultivation. The recovery of applied nitrogen to wetland paddy is around 20-40%. The agronomic efficiency of nitrogen (additional grain yield per kg N applied compared to without-N) is as low as 10 kg per kg of Nitrogen. Nitrogen utilization in the tea sector in 2018 includes 100.4 million kg of urea and 27.7 million kg of ammonium sulphate, totaling about 51.88 million kg of nitrogen. The total losses have been estimated at 40% of the applied nitrogen. The position of Sri Lanka in the agriculture sector, measured based on the Sustainable Nitrogen Management Index (SNMI) in the Environmental Performance Index (EPI) is ranked low as 124 among the 180 countries indicating the significant improvement needed by the country in the future in achieving the Sustainable Development Goals (SDGs) [10] . Livestock populations with ruminants emit methane due to the anaerobic digestive process in the fore stomachs (fermentation). Milk production from the dairy cow sector in Sri Lanka emits about 2.3 million tons of CO 2 e. The emission profile of milk is dominated by methane (93.2 %), while nitrous oxide (N 2 O) and CO 2 contribute 1.6 % and 5.2 % of the entire emissions, respectively. Approximately 88% of the emissions from the management of stored manure arise from methane produced by the rumination of cows and 5% of CO 2 emissions related to feed production, transport, and processing contribute a further 5% to total emissions. Ruminants could produce 250 to 500 liters of methane per day counting on various animal and feed-related factors. That would cause about 12% loss of the dietary energy within the ration as methane. In Sri Lanka, cattle and buffaloes are the most abundant livestock groups, while sheep, goats, and swine remain as minors [11] .
Objective
The general objective of the whole programme is to prepare a Carbon Net Zero Road Map and a Strategic Plan to enable the country to achieve its Carbon Net Zero goal with clear milestones. The present paper confines its objective to the agriculture sector.
Approach
It could be observed that with the trend of reducing GHG emissions from agricultural lands, Sri Lanka can reduce to 61 % of the present level. To reduce the GHG emissions from the agriculture sector, appropriate management practices must be introduced to minimize CO2, CH 4 and NO 2 emissions. Further, Land Surface Albedo in agricultural lands could be minimized to lower the Surface Albedo and increase the green cover and increase the carbon sequestration and suitable alternative measures must be introduced to minimize CO 2 emissions from agricultural fields.
Scenario development for GHG reduction
Strategic approach has been adopted in this exercise with two scenarios to achieve an acceptable level of GHG emission and possible carbon sequestration rates from agricultural lands by the year 2050. The reference level was fixed with a baseline scenario.
1. Baseline Scenario: The reference curve has been fixed
considering GDP and population change as baseline scenario (Fig. 2). Two exceptional lowering of emissions was observed in the year 2014 and 2016 and according to DOA it was due to the impacts of an El Nino condition prevailed in Sri Lanka. The figure shows that most significant contributions are made by direct and indirect emission of N2O, Emission of CH 4 from rice fields and the methane emission from enteric fermentation of ruminant animals.
NDC 2030 scenario extended to 2050:
The GHG reduction curve established on the assumption that the mitigation strategies mentioned in the NDC 2030 report are adopted continuously up to 2050 (Fig. 3). It is observed that, when the NDC unconditional targets are extrapolated to 2050 using the model, the actions were capable to reduce GHG emissions by 30 % from the year 2025 (5958 CO2e in '000 tonnes to 4200 CO 2 e in '000 tonnes) to the year 2050.
When the NDC conditional target actions were considered, applicability of these with respect to the field level extension, present economic situation of the country and other facilities, is beyond control and therefore, it was decided to use the Unconditional target, which predicts up to 30% reduction from the baseline data when developing the NDC 2030 extended scenario up to 2050 for the agriculture sector. Best case Scenario: However, it was observed that Agriculture sector covered by the updated NDC Sri Lanka needs further improvements prior to be used to predict and forecast selected mitigatory options. a) Hence, another scenario was developed with some added detailed parameters to the livestock sector namely, emissions from Neat Cattle local as well as imported breeds were categorized in to milking, not milking, bulls and calves were analyzed in detail. b) Further to those populations like goats, sheep, etc. were also analyzed in detail to calculate the GHG emissions to refine the baseline scenario. c) In addition to that it is proposed to remove paddy straw from paddy fields for various purposes to minimize GHG emissions as mentioned under mitigation activities. In this exercise crop diversification in paddy fields (as recommended in NDC 2030 report) is not much encouraged due to the facts that paddy production should be kept stable and all paddy soils are not suitable for crops like soybean, onion, groundnut etc.
This approach helped to increase the mitigation capability of the incremental planning proposed for five-year intervals up to the year 2050 and percentage reduction obtained from the best-case scenario was used to formulate the mitigation planning (Fig. 4). Mitigation Actions proposed to be implemented under the Strategies Strategy 1: Reduce methane emission from paddy fields by removing rice straws and through good management practices 1. Removal of paddy straw from the paddy field for manufacturing paper, boards and packaging materials and producing biofuel blocks. 2. Reduce post-harvest losses during harvesting and transport to minimize GHG 3. emission from transport and agricultural product residues 4. Establish subsistence and/or polyculture farming to maintain healthier soils 5. Introduce to Good Agricultural Practices (GAP scheme) to all farmers. GAP certification is required to ensure food quality and safety. Introduce insect proof nets to control pests 6. Introduce predators for pest control and practice biological control of pests 7. Cultivate on time and adopt a common time frame in one agro-ecological sub zone 8. Promote diverse cropping systems and a need-based economy 9. Addition of rice straw-derived biochar to lower methane emissions in increased temperature and carbon dioxide conditions, congruent with future climates.
10. Responsible water management such as slower infiltration techniques, breaking up of soil aggregates or alternate wetting and drying (AWD) 11. Policy initiatives to encourage sustainable farming practices and address current subsidies [12] . 12. Promote rice production in upland areas, in which the fields are not maintained in flooded conditions, generates substantially less methane per hectare and per unit of rice. 13. Adaptation of good management practices for soil and water management particularly large in areas where two or three crops of rice are produced each year [13] .
Strategy 2: Use alternatives to Chemical fertilizer for reducing N 2 O emission: 1. Introduce soil testing facilities to promote straight fertilizer method to avoid excess use of chemical fertilizer 2. Integration with organic fertilizers (Organic Farming), Promote liquid and organic fertilizers to minimize the use of chemical fertilizers 3. Promote slow/controlled N-releasing fertilizers and increase their effectiveness 4. Deep placement and reduction of frequency of application of N fertilizer, 5. Use of N transformation inhibitors to scale back the hydrolysis of urea to ammonium by soil urease enzyme.
6. The use of nitrification inhibitors to scale back the accumulation of nitrate also will help to reduce GHG emissions.
Strategies for Carbon Sequestration
Following three strategies are proposed to increase carbon sequestration rates in agricultural fields. 1. Adopt 'evergreen agro-ecosystem concept' to improve carbon sequestration from paddy fields and rainfed uplands 2. Improve land management practices in agricultural lands to enhance the carbon stock in the soil 3. Improve crop management practices in tea plantations Activities to be undertaken under strategies Strategy 5: Adopt 'evergreen agro-ecosystem concept' 1. Cultivation of crops with different duration to keep green cover even during the harvesting stage of one crop; 2. Cultivation of crops leaving zero fallow period of the land; 3. Farming models, which combine seasonal, semiperennial and perennial crops ensuring the green cover around the year; 4. Green manure plants such as gliricidia, adathoda, erithrina, thespesia etc. are 5. grown as hedges with strict frequency of pruning; 6. Shade management is adopted to minimize light competition and to maintain the crop land with evergreen situation; 7. Live fence is maintained with plants to create a stratification enabling to act as 8. wind barrier as well as favourable micro-climate in the crop field; and 9. The farmer should have a field management / selfevaluation schedule for his convenience to ensure the sustainability of the agro-ecosystem An example for 'evergreen agro-ecosystem concept' recommended for paddy fields and rainfed uplands is shown in Fig. 6.
Figures and tables from the paper
References
4 in the original paper- Building Sri Lanka's Resilience to Climate Change, 2018. The World Bank -Feature Story; c2018 Sept 21.
- Pimonenko T, Lyulyov O, Chygryn O, Palienko M. Environmental Performance Index: relation between social and economic welfare of the countries. Environmental Economics. 2018;9(3):1-11.
- Lokupitiya E. Country-specific emission factors for methane emission from enteric fermentation: a case study from a non-annex 1 country, J Natn. Sci. Foundation Sri Lanka. 2016;44(2):137-144.
- Wichelns D. Managing water and soils to achieve adaptation and reduce methane emissions and arsenic contamination in Asian rice production, Water. 2016;8(4):141. Available at: https://doi.org/10.3390/w8040141.
Cited by 1
From OpenAlex, OpenCitations and reference lists read by Scinovex
- Machine Learning-Based Decision Support System for Greenhouse Crop Management Under Mite Infestation Conditions ↗
Saravanapavan Nasiketha · Journal of Environmental and Sustainability Science · 2026
This paper presents an integrated machine learning-based Decision Support System (DSS) for greenhouse crop management under mite infestation conditions, specifically designed for Sri Lankan agricultural contexts. The research addresses critical challenges faced by greenhouse farmers regarding pest management and crop productivity optimization through a comprehensive system combining NetLogo simulation for synthetic data generation, ensemble machine learning models, and a web-based…
❝ 0PDF