
Research article · 2022 · Full text
International Journal of Veterinary Sciences and Animal HusbandryDistribution of mutational effects in indigenous chicken
Volume 7(1) · Pages 01–04 · DOI: 10.22271/veterinary.2022.v7.i1a.395 ↗
Research areasLivestock and Poultry ManagementSilkworms and Sericulture ResearchAnimal Nutrition and Physiology
Abstract
Author-writtenThe selection of the Indigenous Chicken (IC) has amounted to remarkable phenotypic changes traced back to the variations in their genome. These variations take many forms among them, insertions and deletions (INDELs). This study applied whole genome re-sequencing to characterize the distribution of INDELs in IC. Eight IC birds from eight ecotypes; Siaya, Kakamega, Narok, West Pokot, Taita-Taveta, Turkana, Bomet, and Lamu were re-sequenced. One representative bird per ecotype was selected based on the Principal Coordinate Analysis and heterozygosity from the microsatellite data. A variant calling process to identify SNPs and INDELs was done. Valid INDELs retained for analysis had a read dept (dp) >4 and Minimum quality (minQ) 20. A total of 2.7 million INDELs were discovered. Of this, 1,430,403 and 1,448,720 were insertions and deletions respectively. All ecotypes recorded more deletions compared to insertions. The total affected bases due to INDELs were 10,645,076. Deletions were generally longer (43 bp) and insertions were shorter (28 bp). The distribution of INDELs in the IC genome both among the ecotypes and between the chromosomes within an ecotype proved to be different. The information generated from this study will render a new and deeper understanding into the ways genetic variations mold IC phenotypic diversity.
Summary
Source-checkedPlain-language reading of the full paper, prepared with AI and checked against the text. Each point links to the authors' own words.
Why it matters
- Insertions and deletions (INDELs) are linked to various phenotypic traits in chickens, including growth, body weight, egg production, and plumage color. View evidence ↗
- INDELs are the most common structural variants and the second most common polymorphism after SNPs, making them useful for studying disease pathogenesis and gene expression. View evidence ↗
- There is a need for a larger and more representative collection of INDEL variants to allow for detailed examination and validation within the chicken genome. View evidence ↗
The question
- The study aimed to characterize how INDELs are distributed across the genome of Indigenous Chickens (IC). View evidence ↗
What they did
- The researchers used whole genome sequences from eight free-ranging Indigenous Chickens, each representing a different administrative region in Kenya. View evidence ↗
- Representative birds for each ecotype were selected based on heterozygosity from microsatellite data and Principal Coordinate Analysis (PCoA). View evidence ↗
- To be included in the analysis, INDELs had to meet a minimum quality score of 20 and a read depth greater than 4. View evidence ↗
What they found
- The study identified a total of 2,705,814 INDELs across the eight Indigenous Chicken ecotypes. View evidence ↗
- Of the detected variants, 1,448,720 were deletions and 1,430,403 were insertions, showing a higher prevalence of deletions. View evidence ↗
- INDELs affected a total of 10,645,076 bases, with deletions modifying 5,720,556 bases and insertions modifying 4,924,510 bases. View evidence ↗
- The maximum length for insertions was 28 bases, while deletions reached up to 43 bases in most ecotypes and 44 bases in the Bomet ecotype. View evidence ↗
- Chromosome 1 had the highest number of INDELs, while Chromosome 16 had the lowest, with the West Pokot bird recording only 87 INDELs on Chromosome 16. View evidence ↗
- Most detected INDELs were novel, with novelty rates of 99.99% in most ecotypes, though Bondo (98.16%) and Taita-Taveta (98.14%) were slightly lower. View evidence ↗
What it means
- The authors conclude that the observed phenotypic differences in Indigenous Chickens are likely caused by variations in the number and distribution of INDELs across ecotypes. View evidence ↗
- The authors state that more information is needed regarding the specific genes where INDELs influence functional and economically important traits. View evidence ↗
Visual summary
3 visualsIllustrations explain the paper; charts are replotted from the paper's own table values.
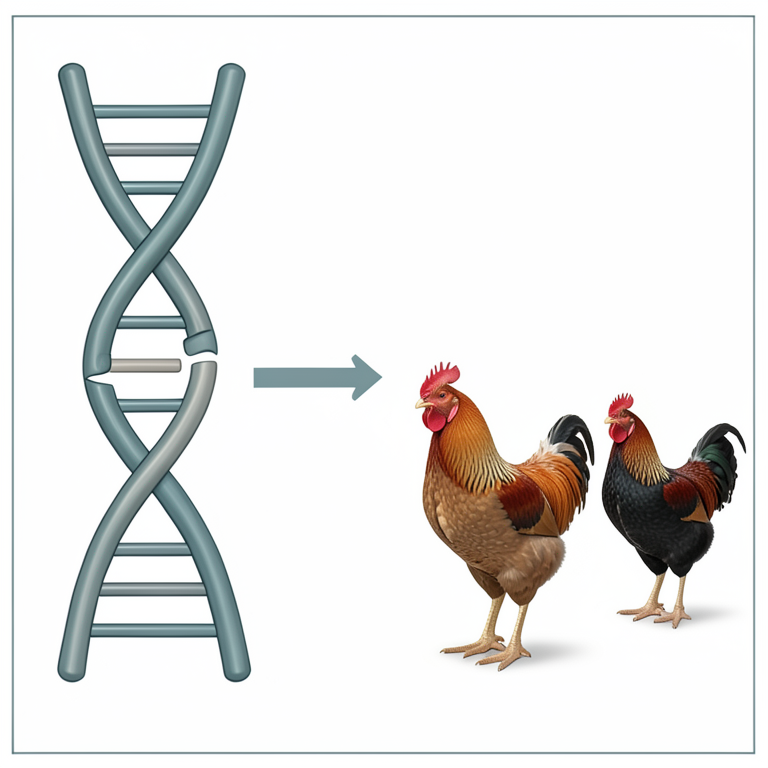
Conceptual Link between INDELs and Phenotype
AI-generated conceptual illustration (indigenous chickens). It explains the idea and does not show study data.
View source evidence ↗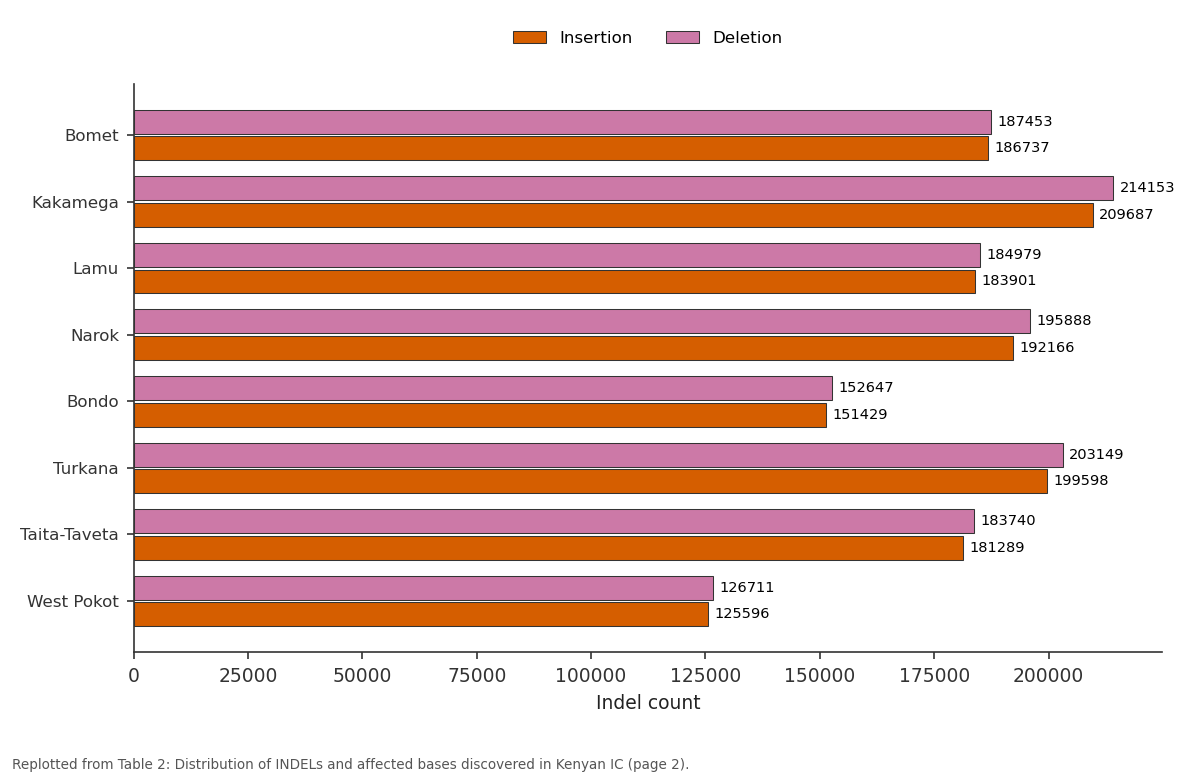
Insertion and Deletion: Bomet vs Kakamega vs Lamu vs Narok vs Bondo
Replotted from Table 2 (page 2) of the original paper. Every bar is the paper's own table value.
View source evidence ↗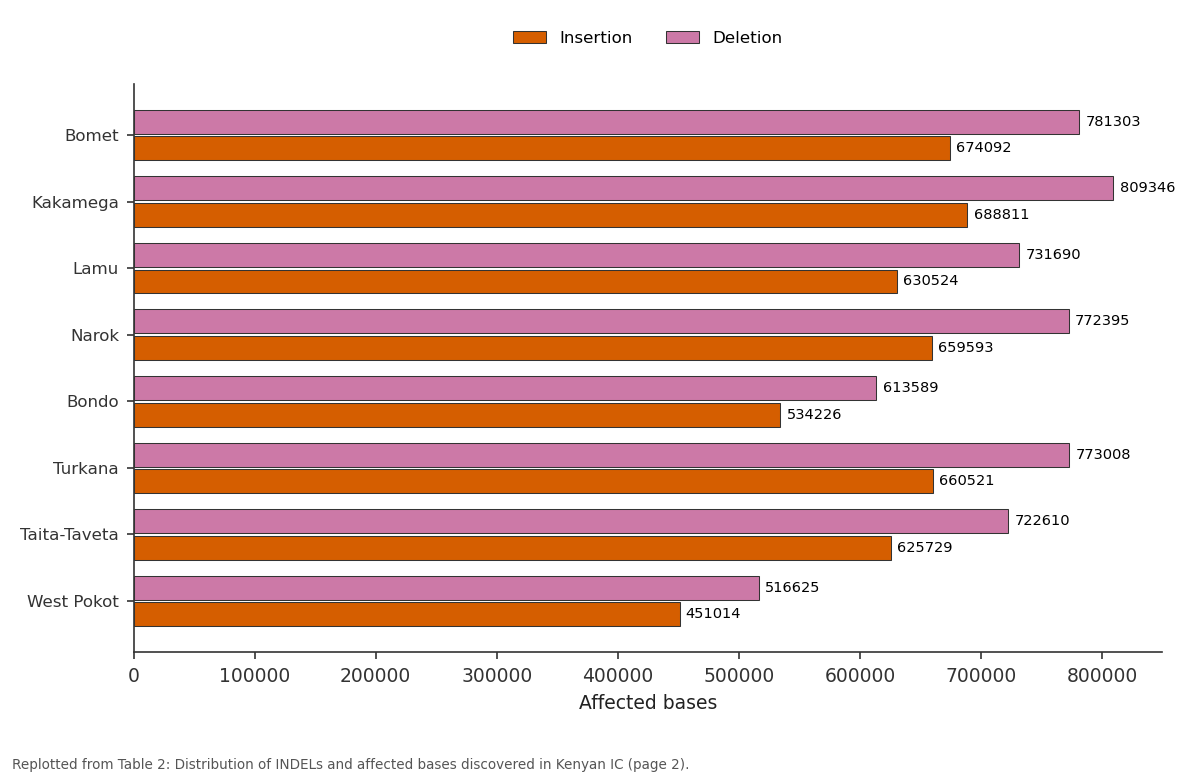
Insertion and Deletion: Bomet vs Kakamega vs Lamu vs Narok vs Bondo
Replotted from Table 2 (page 2) of the original paper. Every bar is the paper's own table value.
View source evidence ↗Figures & tables
From the original paper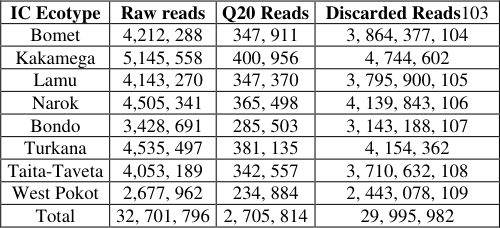 Table 1
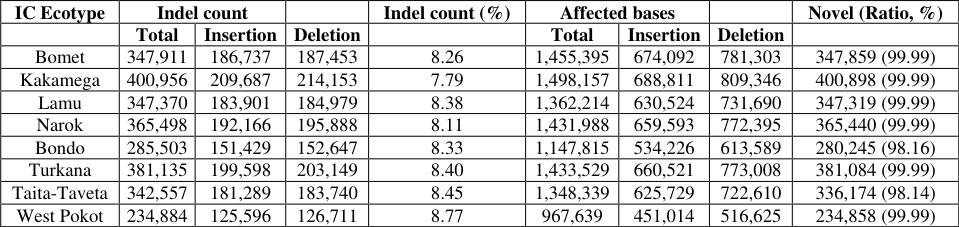 Table 2
Introduction
Although single nucleotide polymorphisms (SNPs) are the most common genetic variants, INDELs have been recognized as a rich source of genetic markers that are widely spread across the genome [1] . When defined in a broader perspective, INDELs stand for a heterogeneous group of mutations, among them, duplication, transposition, and length change in tandem with repetitive deoxyribonucleic acid (DNA) [2] . Advances in sequencing technology have propelled further discovery of INDELs in genomes of model organisms. Wong et al. [3] partially sequenced three chicken breeds yielding 2.8 million variants where approximately 10% of these polymorphisms turned out to be INDELs. In the case of chicken, INDELs have been associated with a number of phenotypes observed in this species. Embryonic mortality, growth, plumage colour, egg production, retinal degeneration, and body weight are some of the phenotypic variations associated with the presence of INDELs in chicken genomes [4] . Being the second most common type of polymorphism after SNPs and the most common structural variant, INDELs have also been used for disease pathogenesis, gene expression and functionality, identification of forms of viral diseases as well as genetic markers in natural populations [5] . Similarly, with the aim of boosting the chicken variation database, approximately 600,000 INDELs per bird have been identified in two sequenced chickens [6] . Yan et al. [7] on the other hand, focused on the identification of INDELs 1-50 bp as well as examining their distribution and their potential influence on gene functions in the chicken genome and reported 1.3 million genome-wide INDELs in 12 diverse chickens both from commercial and Chinese indigenous breeds. However, for detailed examination and validation of INDELs in the chicken genome, a larger and more representative collection of these variants is still desired. The focus of this study was, therefore, to characterize the distribution of INDELs in the Indigenous Chicken genome. Examination of the whole IC genome for INDELs will be beneficial for further understanding of their genetic variations, to deduce the relationship between observed variations and the expressed phenotypes, as well as detecting footprints of genomic selection.
Materials and Methods
Materials and Methods
Data source
Whole genome sequences of eight free-ranging IC birds from a study by Ngeno et al. [8] , were used in this study. The birds were from eight different administrative regions of Kenya (Siaya, Kakamega, Narok, West Pokot, Taita-Taveta, Turkana, Bomet, and Lamu counties) and the selection criteria were based on the ecological characteristics, geographical distances, previous coverage of IC improvement programmes and the socio-economic purposes of IC.
Sample collection, DNA extraction and genotyping
A total of 48 samples per county were collected as described by Ngeno et al., [8] . Genomic DNA was obtained by the standard phenol-chloroform extraction method. One representative bird per ecotype was selected for whole genome re-sequencing based on the Principal Coordinate Analysis (PCoA) and heterozygosity from the microsatellite data. Analysis of the estimated (He) and observed heterozygosity (Ho) was executed within a sampled ecotype using 12 autosomal microsatellite markers. The representative bird per ecotype was chosen for re-sequencing according to the fit of this sample in its ecotype based on the PCoA analysis and with heterozygosity close to the mean Ho of their respective ecotype.
Read mapping and variant calling
Library construction of DNA samples of selected representative individuals was done as per manufacturers instruction, i.e. Illumina. The genomic DNA was cut to the average size of 100 bp and then joined to Illumina paired-end adaptors. Sickle software v1.33 [9] was used to trim short reads. The resulting high-quality reads were aligned to the reference chicken genome (release: galGal4) using Burrows-Wheeler Aligner (BWA) v0.7.5a [10] . SAMtools v0.1.31 [11] was used to convert the files from SAM into BAM format. The mpileup function of SAMtools was used to obtain the variant call format (VCF) files [11] . Variations were filtered for a minimum genotype SNP quality of 20 and for coverage in the range of 4x until twice the mean coverage of the genome studied using SAMtools v0.1.31 [11] .
Data analysis
To identify and characterize the INDELs from the genome, SNPs were filtered using VCFtools v0.1.16 [12] with the command to remove SNPs and retain INDELs was used. Valid INDELs retained for analysis had to meet the following thresholds; read depth (dp) >4, Minimum quality (minQ) [20] .
Sex chromosomes were also removed together with one chromosome that did not meet the threshold set, leaving 28 chromosomes for analysis.
Results
Summary of sequencing statistics (number of raw and discarded reads) are presented in Table 1. The number of raw reads ranged from 3.4 to 5.2 million, whereas the discarded range between 2.5 and 4.8 million. Kakamega ecotype reported the highest number of raw reads (5,145,558), where 4,744,602 reads were removed to end up with 400,956 valid INDELs for downstream analysis. Consequently, the West Pokot IC recorded the lowest number of reads (2,677,962) that yielded 234,884 valid reads after 2,443,078 reads were discarded. In all the birds, the mutations as a result of deletions were more compared to the insertions and the same was true for the affected bases. The maximum length of the detected insertions was 28 bases for all the organisms with birds from all the ecotypes having a maximum length of 43 bases for deletions except the bird from the Bomet ecotype that recorded 44 bases. However, for both the insertions and deletions majority of the variants were between 1-10 bp in length for all the eight ecotypes.
| IC Ecotype | Raw reads | Q20 Reads | Discarded Reads103 |
|---|---|---|---|
| Bomet | 4,212, 288 | 347, 911 | 3, 864, 377, 104 |
| Kakamega | 5,145, 558 | 400, 956 | 4, 744, 602 |
| Lamu | 4,143, 270 | 347, 370 | 3, 795, 900, 105 |
| Narok | 4,505, 341 | 365, 498 | 4, 139, 843, 106 |
| Bondo | 3,428, 691 | 285, 503 | 3, 143, 188, 107 |
| Turkana | 4,535, 497 | 381, 135 | 4, 154, 362 |
| Taita-Taveta | 4,053, 189 | 342, 557 | 3, 710, 632, 108 |
| West Pokot | 2,677, 962 | 234, 884 | 2, 443, 078, 109 |
| Total | 32, 701, 796 | 2, 705, 814 | 29, 995, 982 |
Table text extracted from the original PDF; superscript letters are shown inline. The original table image is below.
View original table image
Discussion
Compared to other structural variants, INDELs are equally of great importance as they are known to alter gene functions. Protein coding genes that are responsible for a good number of observed phenotypes in the IC might in particular have been modified by the INDELs yielding the observed phenotypes in the sampled ecotypes. The observed number of insertion and deletion mutations in the IC from Kenya is in consensus with studies by Boschiero et al. [4] and Yan et al. [7] that reported a similar trend in the ratio of these variants. This is also true for the number of affected bases due to both the insertion and deletion mutations. Ngeno [13] reported a remarkable variation in body weight among ecotypes of the Kenyan IC and attributed it to natural and artificial selection and to some extent geographical isolation. Selection, whether natural or artificial, is known to have an effect on the genetic make-up of a population which in turn influences the phenotype. Variation in the number of INDELs observed both among the ecotypes and between the chromosomes might be presumed to contribute to the observed disparity in phenotype (body weight). However, more than 150 pieces of information are still desired in terms of genes resulting INDELs that influence functional and economically important traits. The average length of the majority of the detected INDELs by Boschiero et al. [4] was between 1-5bp which differed slightly from those from this study (1-10 bp). This can be attributed to the nature of the sampled birds with those used by Boschiero et al. [4] being entirely commercial layer birds that have undergone selection over a period of time for particular traits of economic importance. This particular study however used birds that were originating from varied ecological conditions and hence adapted to varying conditions yielding the variation in the genetic make-up of the birds. The IC is believed to have multiple origins before being introduced to the country [14] . As a result, the variations in the number of INDELs observed between the ecotypes might be possibly due to the process of adapting to the various climatic conditions in which these birds were introduced. The IC is also raised mostly in scavenging conditions with limited feed supply and exposure to disease pathogens. With these conditions, natural selection brings the specificity of a bird to fit in a particular ecotype thereby maintaining the genetic diversity of the ecotypes. This is in consensus with work by Ngeno et al. [14] on MHC markers that confer disease resistance in the IC. The other reason behind the diversity in the INDEL numbers may be attributed to the fact that inhabitants of these ecological regions that are geographical apart tend to have varying cultural practices hence utilization of the IC is varied. This is in tandem with a study by Okeno et al. [15] that reported reduced numbers of IC in households with larger numbers of cattle and goats kept as the main source of income from livestock. [4] . Being a micro-chromosome, previous studies by Marcia et al. [16] and Burt [17] [7] was higher. However, despite the high degree of novelty observed across all the ecotypes, there was a characteristic trend recorded by IC from Bondo and Taita Taveta where the two ecotypes recorded a lesser percentage of unique variants than the rest of the ecotypes. Ngeno et al., 2015 [14] observed that the IC from these two ecotypes had close genetic diversity estimates despite being distantly located. The study went ahead to link this finding with the introgression of genes from the Coastal region where Taita Taveta is located to Siaya. Consequently, this can be the possible reason for the uniformity in the distribution of the novel genes. Generally, the higher novelty count recorded can be tied to employing genetically diverse birds for the study. This is also promising in the field of genomics as it indicates that more INDELs can be discovered through the use of sample animals from varied genetic and climatic backgrounds.
Conclusion
The distribution of INDELs in Indigenous Chicken genome both among the ecotypes and between the chromosomes within an ecotype proved to be different. Phenotypic variations observed in the IC are most likely due to variance in the number and distribution of INDELs among the ecotypes. The information generated from this study on the INDELs will render a new and deeper understanding into ways by which genetic variations mold IC phenotypic diversity.
Acknowledgement
AcknowledgementsThe authors wish to express their gratitude to the Animal Sciences Department, Egerton University. Also, wish to acknowledge the iLINOVA project for funding the work.
Figures and tables from the paper
| IC Ecotype | Indel count | — | — | Indel count (%) | Affected bases | — | — | Novel (Ratio, %) |
|---|---|---|---|---|---|---|---|---|
| Total | Insertion | Deletion | Total | Insertion | Deletion | |||
| Bomet | 347,911 | 186,737 | 187,453 | 8.26 | 1,455,395 | 674,092 | 781,303 | 347,859 (99.99) |
| Kakamega | 400,956 | 209,687 | 214,153 | 7.79 | 1,498,157 | 688,811 | 809,346 | 400,898 (99.99) |
| Lamu | 347,370 | 183,901 | 184,979 | 8.38 | 1,362,214 | 630,524 | 731,690 | 347,319 (99.99) |
| Narok | 365,498 | 192,166 | 195,888 | 8.11 | 1,431,988 | 659,593 | 772,395 | 365,440 (99.99) |
| Bondo | 285,503 | 151,429 | 152,647 | 8.33 | 1,147,815 | 534,226 | 613,589 | 280,245 (98.16) |
| Turkana | 381,135 | 199,598 | 203,149 | 8.40 | 1,433,529 | 660,521 | 773,008 | 381,084 (99.99) |
| Taita-Taveta | 342,557 | 181,289 | 183,740 | 8.45 | 1,348,339 | 625,729 | 722,610 | 336,174 (98.14) |
| West Pokot | 234,884 | 125,596 | 126,711 | 8.77 | 967,639 | 451,014 | 516,625 | 234,858 (99.99) |
Table text extracted from the original PDF; superscript letters are shown inline. The original table image is below.
View original table image
References
16 in the original paper- Väli U, Brandström M, Johansson M, Ellegren H. Insertion-deletion polymorphisms (indels) as genetic markers in natural populations. BMC Genetics. 2008;9(1):1-8.
- Rao YOUS, Wang ZF, Chai XUEWEN, Wu GUOZUO. Indel segregating within introns in the chicken genome are positively correlated with the recombination rates. Hereditas. 2010;147(2):53-57.
- Wong GK, Bin Liu, Jun Wang, Yong Zhang, Xu Yang, Zengjin Zhang QM. A genetic variation map for chicken with 2.8 million single-nucleotide polymorphisms. Nature. 2004;432(7018):717-722.
- Boschiero C, Gheyas AA, Ralph HK, Eory L, Paton B, Kuo R, et al. Detection and characterization of small insertion and deletion genetic variants in modern layer chicken genomes. BMC Genomics. 2015;16(1):1-7.
- Neuman JA, Isakov O, Shomron N. Analysis of insertion ^deletion from deep-sequencing data: Software evaluation for optimal detection. Bioinformatics. 2012;14(1):46-55.
- Fan W, Ng CS, Chen C, Lu MJ, Chen Y, Liu C, et al. Genome-Wide Patterns of Genetic Variation in Two Domestic Chickens. Genome Biology and Evolution. 2013;5(7):1376-1392.
- Yan Y, Yi G, Sun C, Qu L, Yang N. Genome-wide characterization of insertion and deletion variation in chicken using next generation sequencing. PloS One. 2014;9:e104652.
- Ngeno K, Waaij EH, Vander, Kahi AK. Indigenous Chicken genetic resources in Kenya : Their unique attributes and conservation options for improved use. World's Poultry Science Journal. 2014;70(1):173-184.
- Joshi NA, Fass Sickle JN. A sliding-window, adaptive, quality-based trimming tool for Fast Q files (version 1.33), available at https://github.com/najoshi/sickle, 2011.
- Li H, Durbin R. Fast and accurate short read alignment with Burrows-Wheeler Transform. Bioinformatics. 2009;25(14):1754-1760. [PMID: 19451168]
- Li H, Handsaker B, Wysoker A, Fennell T, Ruan J, Homer N. The Sequence Alignment/Map format and SAMtools. Bioinformatics. 2009;25(16):2078-2079.
- Danecek P, Auton A, Abecasis G, Albers CA, Banks E, Depristo MA. The variant call format and VCFtools. Bioinformatics. 2011;27(15):2156-2158.
- Ngeno K, Waaij EH, Van Der Megens HJ, Kahi AK, Arendonk Van JAM. Genetic diversity of different Indigenous Chicken ecotypes using highly polymorphic MHC-linked and non-MHC microsatellite markers. Animal Genetic Resources. 2015;56:1-7.
- Okeno TO, Kahi AK, Peters KJ. Characterization of Indigenous Chicken production systems in Kenya. Tropical Animal Health Production. 2012;44:601-608.
- Marcia Miller M, Charmaine Robinson Jason M, Abernathy Ronald M, Goto Melissa K, Hamilton Huaijun, Zhou Mary Delany E. Mapping Genes to Chicken Microchromosome 16 and Discovery of Olfactory and Scavenger Receptor Genes Near the Major Histocompatibility Complex. Journal of Heredity. 2014;105(2):203-215.
- Burt DW. Chicken genome : Current status and future opportunities. Genome Research. 2005;15:1692-1698.