
Research article · 2023 · Full text
International Journal of Geography Geology and EnvironmentDifferentials in levels of educational attainment of Scheduled Castes Women in Rural Haryana
Volume 5(2) · Pages 47–52 · DOI: 10.22271/27067483.2023.v5.i2a.174 ↗
Research areasSocial and Economic Development in India
Abstract
Author-writtenThe present study examines the differentials in levels of education attainment of Scheduled Castes women in rural Haryana based on collected primary data of selected household. The surveyed households are represented by eight Scheduled Castes. Caste wise distribution of educated womens at different levels of education has been worked out. Thereafter, the weighted score has been derived to assess the levels of educational attainment among different castes. On the basis of weighted score, the rank has been given to each caste. Female literacy rate were recorded as highest in Balmiki caste 87.35 per cent while the lowest were recorded in Dhanak caste 47.83 per cent. On the basis of aggregated weighted score, it is noted that the Balmiki Caste has obtained first rank with 216.55 in the study area followed by Dhanak second, Chamar and Banjara with third and forth rank respectively. On the other hand the Bawaria Caste occupied the lowest position with total weighted score 120.00 in the study area. Bawaria is followed by OD and Bazigar.
Summary
Source-checkedPlain-language reading of the full paper, prepared with AI and checked against the text. Each point links to the authors' own words.
Why it matters
- Educational attainment for Scheduled Castes in India is a critical issue because the community has historically faced social inequalities and disadvantages. View evidence ↗
- Poverty and socio-economic disadvantages continue to act as barriers to educational opportunities for students from Scheduled Castes. View evidence ↗
- Existing social biases and discrimination within educational institutions can negatively impact the learning environment for Scheduled Caste students. View evidence ↗
The question
- The study aims to identify the differences in educational attainment levels among Scheduled Caste women living in rural Haryana. View evidence ↗
What they did
- The researchers used stratified random sampling to select 600 households across fifteen villages. View evidence ↗
- Primary data was gathered via field surveys using structured questionnaires and personal interviews with female household respondents. View evidence ↗
- To assess attainment, a weighted score was calculated by assigning values from 1 (primary) to 8 (PhD) for different education levels. View evidence ↗
What they found
- Among the sampled Scheduled Castes, the literacy rate for males was 87.32% and for females was 70.72%. View evidence ↗
- Female literacy varied by caste, peaking at 87.35% for the Balmiki caste and reaching a low of 47.83% for the Dhanak caste. View evidence ↗
- More than two-thirds of educated Scheduled Caste women in the study had only reached primary or middle levels of education. View evidence ↗
- Based on the aggregated weighted score, the Balmiki caste ranked first in educational attainment with a score of 216.55. View evidence ↗
- The OD and Bawaria castes had the lowest educational attainment, ranking eighth (120) and seventh (140) respectively. View evidence ↗
- In the Chamar, Balmiki, and Dhanak castes, over half of the educated women only attained education up to the primary level. View evidence ↗
What it means
- The authors conclude that low educational attainment among Scheduled Castes is primarily driven by political and socio-economic backwardness and unemployment. View evidence ↗
- The authors note that the COVID-19 pandemic further contributed to low educational attainment by affecting occupational and educational structures in rural Haryana. View evidence ↗
Visual summary
2 visualsIllustrations explain the paper; charts are replotted from the paper's own table values.
Caste Educational Ranking
AI-generated conceptual illustration (Rural Indian women from different Scheduled Caste communities in Haryana). It explains the idea and does not show study data.
View source evidence ↗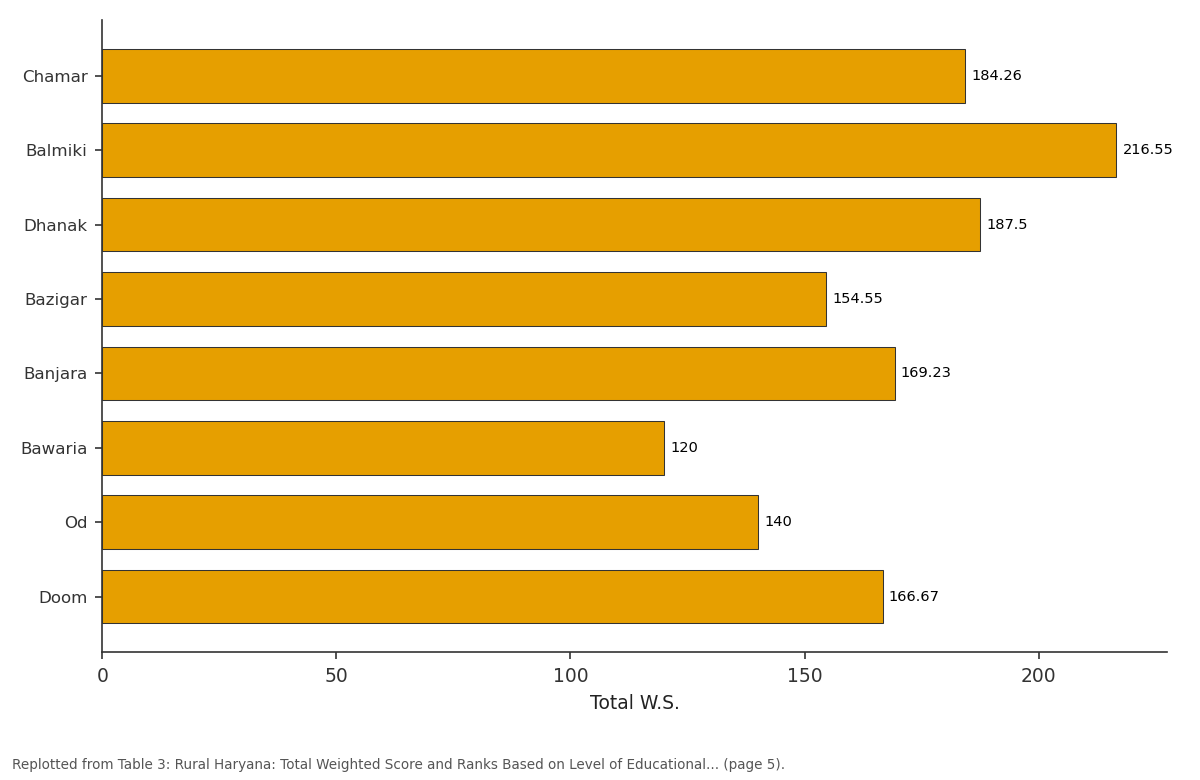
Total W.S.: Chamar vs Balmiki vs Dhanak vs Bazigar vs Banjara
Replotted from Table 3 (page 5) of the original paper. Every bar is the paper's own table value.
View source evidence ↗Figures & tables
From the original paper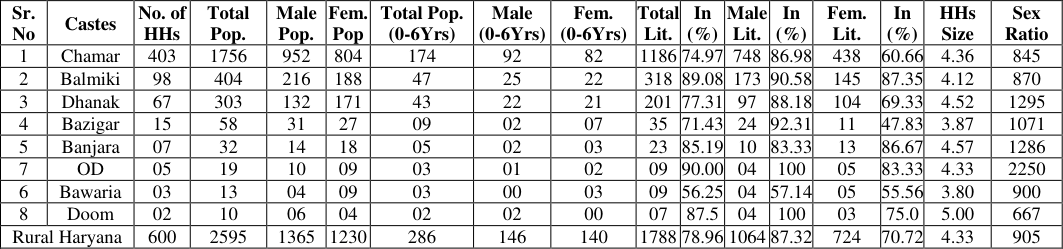 Table 1
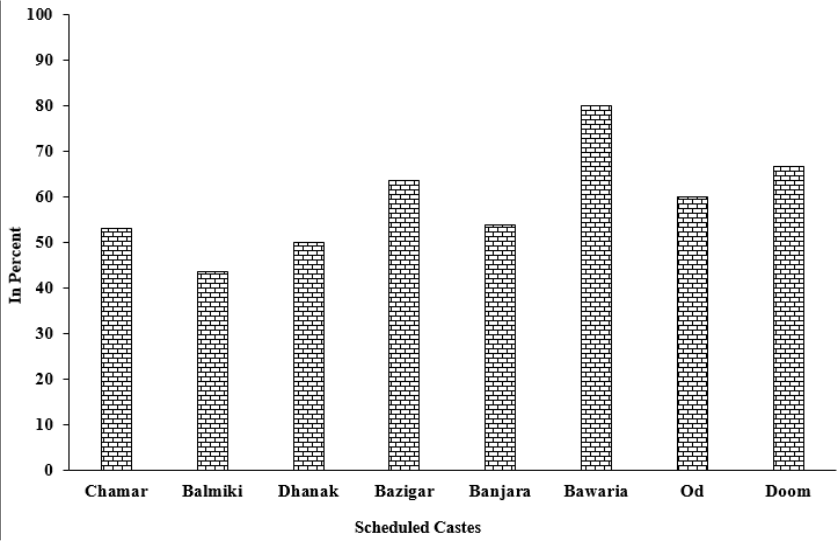 Figure 1
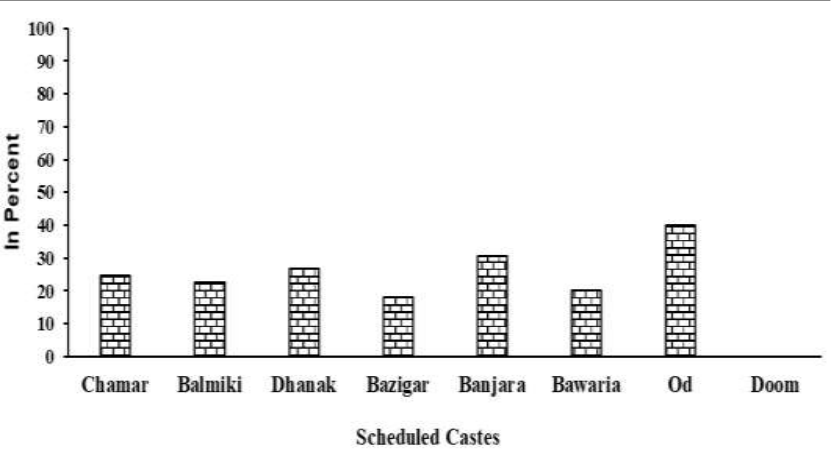 Figure 2
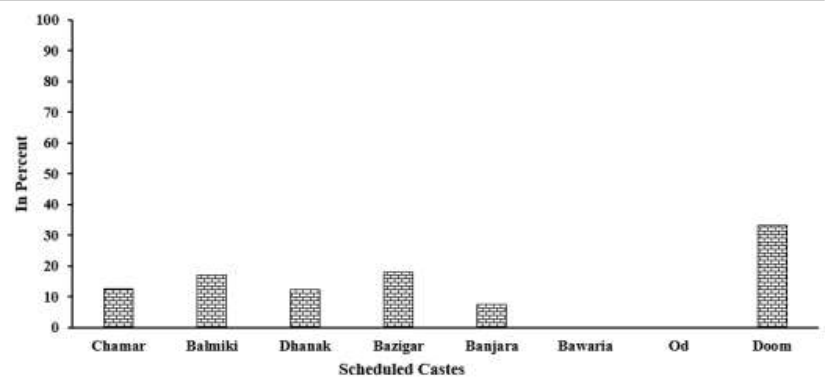 Figure 3
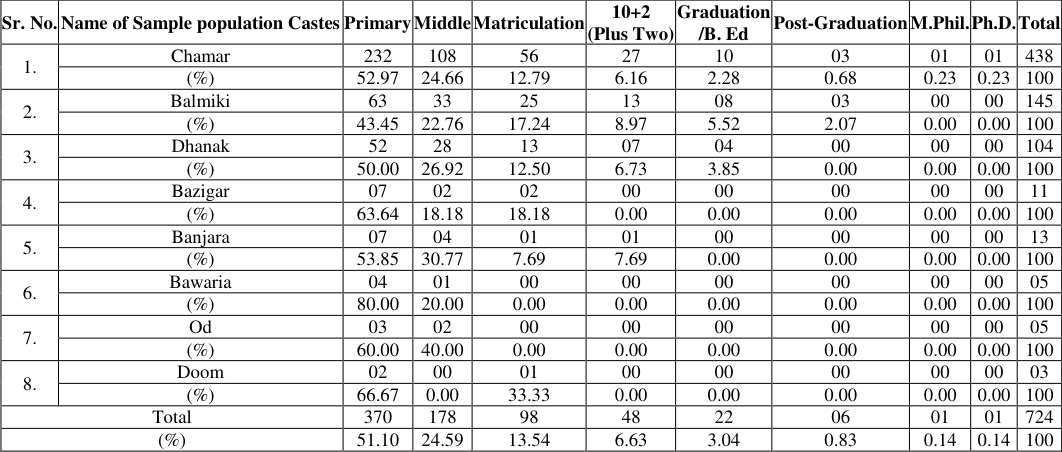 Table 2
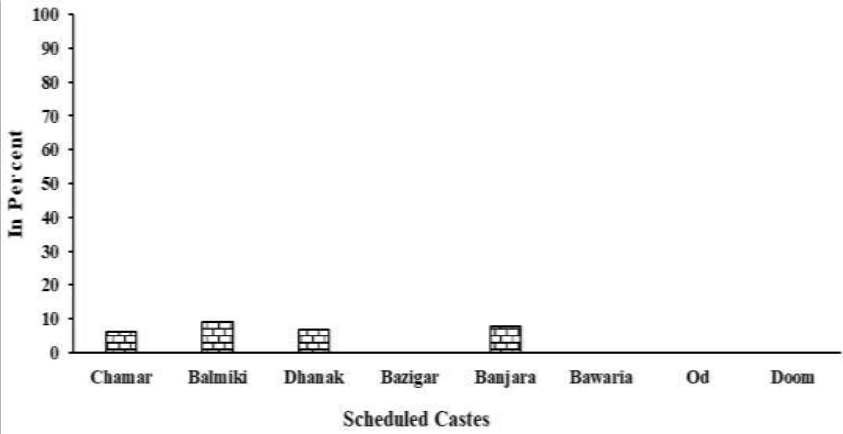 Figure 4
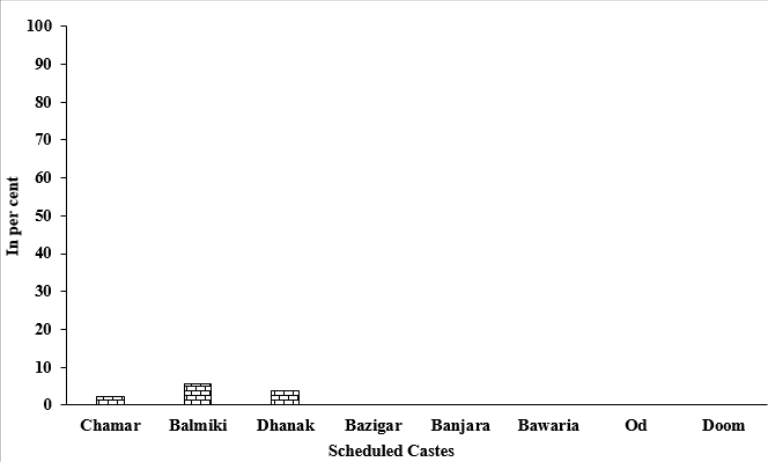 Figure 5
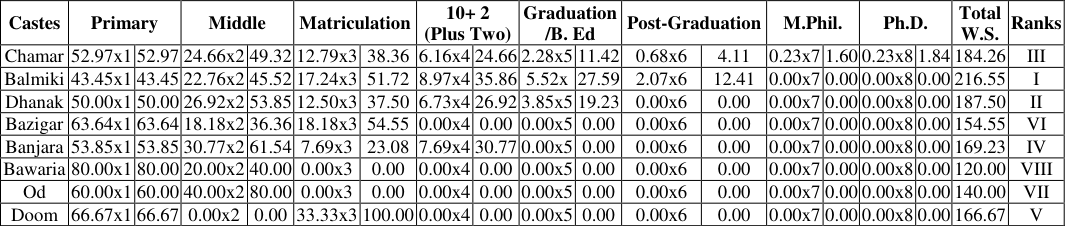 Table 3
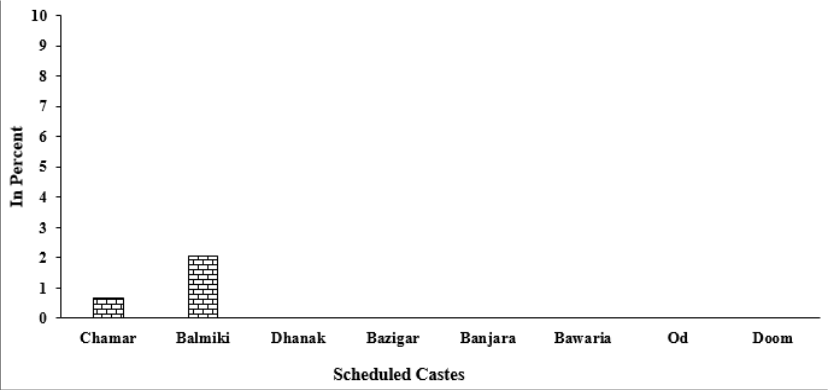 Figure 6
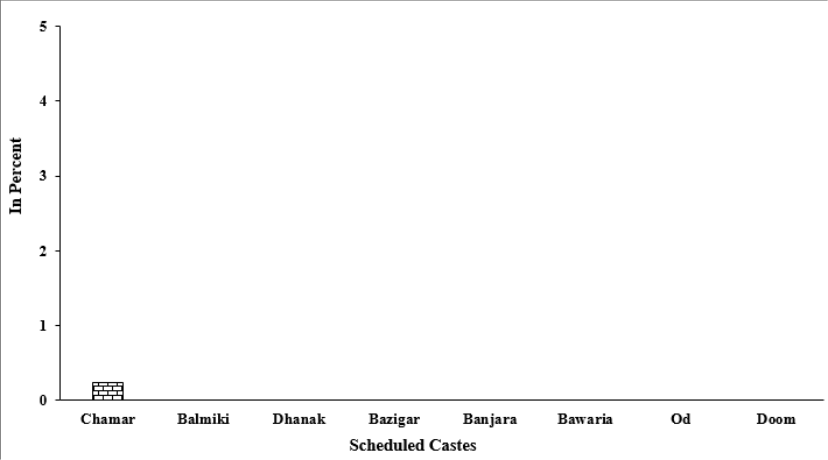 Figure 7
Introduction
Educational attainment among Scheduled Castes in India has been a topic of significant importance due to historical disadvantages and social inequalities faced by this marginalized community. Scheduled Castes, also known as Dalits, have historically faced discrimination, social exclusion, and limited access to resources, including education. Efforts have been made by the Indian government to improve educational opportunities for Scheduled Castes and bridge the educational gap. Several policies and initiatives have been implemented to promote access to education, including reservation policies, scholarships, and special schools. Reservation Policies: The Indian government has implemented reservation policies that reserve a certain percentage of seats in educational institutions, both at the central and state levels, for Scheduled Castes and other socially disadvantaged groups. These policies aim to provide opportunities for representation and access to education. Various scholarships and financial assistance programs have been introduced to support Scheduled Caste students in pursuing their education. These programs provide financial aid for tuition fees, books, and living expenses. Special Schools: To address the specific needs and challenges faced by Scheduled Caste students, special schools and hostels have been established in some areas. These institutions provide additional support, resources, and a conducive learning environment for students from marginalized backgrounds. Despite these initiatives, challenges persist in achieving equitable educational attainment for Scheduled Castes. Some of the key challenges include: Socio-economic Factors: Poverty and social disadvantage continue to hinder educational opportunities for Scheduled Caste students. Lack of resources, parental education, and limited access to quality schools and infrastructure can affect their educational attainment. Discrimination and social biases still exist in educational institutions, which can affect the learning environment for Scheduled Caste students. Prejudice, unequal treatment, and caste-based discrimination can discourage these students from pursuing education or limit their opportunities for higher education. Dropout rates among Scheduled Caste students are higher compared to other groups. Factors such as financial constraints, lack of family support, and the need for child labor can contribute to early school leaving. Quality of Education: Ensuring the quality of education is a crucial aspect. Even if Scheduled Caste students have access to educational institutions, the quality of teaching, infrastructure, and learning materials can significantly impact their educational outcomes.
Efforts to address these challenges require a multi-faceted approach, including the implementation of effective policies, improved infrastructure, teacher training, awareness campaigns, and community engagement. By addressing these issues and providing equal educational opportunities, it is possible to improve the educational attainment among Scheduled Castes and promote social inclusiveness and empowerment.
Study Area
Haryana state is located between latitude 27º 39 ̍ to 30º 35 ̍ N and 74º 28 ̍ to 77º 36 ̍ E longitude having an area 44,212 sq. km. It has natural boundaries of the Shivalik hills in the north, the river Yamuna in its east and Ghaggar River is situated in the north-western part and southern boundary is provided by the Aravali hills which run through southern Gurugram, Rewari and Mahendergarh. The state is bounded by Himachal Pradesh on its north, Punjab on its west, Rajsthan on its south and Uttar Pradesh on its east.
Objective of the Study Area
The study has undertaken is to identify Differentials in levels of educational attainment level of Scheduled Castes Women in rural Haryana.
Data Source Research Methodology
This study is based on primary data collected through field survey using structured questionnaire from selected villages. Personal interview were conducted by the researcher with the female respondent of the household. A total 600 sample household have been taken from fifteen selected villages on the basis of stratified random sampling based on different parameters like percentage of Scheduled Castes female's population, sex ration, literacy rate of Scheduled Caste women and work participation rate of Scheduled Caste women in the villages. Caste wise percent distribution of educated persons in different levels viz. primary, middle, matriculation, plus two, graduation, post-graduation, M-Phil and Ph.Ds. were find out for the total educated females. Thereafter, the weighted score were derived by assigning different weight to different levels. For example 1 to primary, 2 to middle, 3 to matriculation, 4 to plus two, 5 to graduation and B.ED, 6 to post graduation, 7 to M-Phil, 8 to PhD. After that, the weighted score has been calculated to examine the rank differentials in levels of educational attainment among castes.
Population Characteristics
The total population of sample houses in the research region is 2595 people (1362 males and 1233 females). Eight castes Chamar, Balmiki, and Dhanak, Bazigar, Banjara, Bawaria, OD, and Doom were identified in the study area. Based on sample household, total literacy rate among the Scheduled castes works out total 78.96 per cent. The male and female literacy rates separately are 87.32 per cent and 70.72 per cent respectively. The Bawaria caste reports highest literacy rate 90.00 per cent while the lowest literacy rate reported by OD 56.25 per cent. In which highest male literacy rate reported by Banjara and Doom caste cent per cent while the lowest worked out OD caste as 57.14 per cent. Female literacy rate were recorded as highest in Balmiki caste 87.35 per cent while the lowest were recorded in Dhanak caste 47.83 per cent (Table-1).
Caste Wise Educational Attainment among Scheduled Caste Women
Table-2 provides percentage distribution of educated Scheduled Castes females under various levels of educational attainment. Female with primary and middle levels of education alone account for more than two/thirds of educated females (Fig. 1 and Fig. 2) 13.54 per cent matriculation (Fig. 3), 6.62 per cent 12 th (Fig. 4), 3.04 per cent Graduation (Fig. 5), 0.83 post graduation (Fig. 6), 0.14 MPhil and 0.14 PhD (Fig. 7). The rankings of individual scheduled castes on the basis of distribution of educated persons as recorded through the primary survey in different levels have been determined (Table 4). For this, a weighted aggregate scores have worked out. On the basis of aggregate weighted score, it has been found that the Balmiki obtained the first rank with total weighted score of 216.55. Dhanak and Chamar obtained the second and third rank with a total weighted score of 187.50 and 184.26 respectively. On the lower side were the Bawaria and OD castes groups that obtained seventh and eighth ranks with a total weighted score of 140 and 120 respectively. Caste wise percentage distribution of educational womens under different categories of educational levels presents a mixed picture. Some of the castes are far ahead of others in terms of educational attainment as compared to others. As a result, the share of primary and above in the total educated women's in some of the castes is strikingly larger than the average of the caste as a whole. Mention may be made of Doom, OD, Bawaria caste. On the extreme, in caste like Chamar, Balmmiki, Dhanak more than half of the educated women's are reported to have attainment education up to primary level. Is is also interesting that 0.23 per cent women's ware engaged in M.Phil and 0.23 per cent in Ph.D. (Fig. 7). 0.00 0.00x7 0.00 0.00x8 0.00 187.50 II Bazigar 63.64x1 63.64 18.18x2 36.36 18.18x3 54.55 0.00x4 0.00 0.00x5 0.00 0.00x6 0.00 0.00x7 0.00 0.00x8 0.00 154.55 VI Banjara 53.85x1 53.85 30.77x2 61.54 7.69x3 23.08 7.69x4 30.77 0.00x5 0.00 0.00x6 0.00 0.00x7 0.00 0.00x8 0.00 169.23 IV Bawaria 80.00x1 80.00 20.00x2 40.00 0.00x3 0.00 0.00x4 0.00 0.00x5 0.00 0.00x6 0.00 0.00x7 0.00 0.00x8 0.00 120.00 VIII Od 60.00x1 60.00 40.00x2 80.00 0.00x3 0.00 0.00x4 0.00 0.00x5 0.00 0.00x6 0.00 0.00x7 0.00 0.00x8 0.00 140.00 VII Doom 66.67x1 66.67 0.00x2 0.00 33.33x3 100.00 0.00x4 0.00 0.00x5 0.00 0.00x6 0.00 0.00x7 0.00 0.00x8 0.00 166.67 V Source: Field Survey, 2021. Compiled by Research Scholar. W.S. Weighted Score.
Caste wise Rank Differential in Level of Educational Attainment of Scheduled Castes Women
To achieve the main objective of the present study, an aggregated weighted score for each of the caste has been worked out. On the basis of aggregated weighted score, it is noted that the Balmiki Caste has obtained first rank with 216.55 in the study area (Table-3) followed by Dhanak second, Chamar and Banjara with third and fourth rank respectively. On the other hand the Bawaria Caste occupied the lowest position with total weighted score 120.00 in the study area. Bawaria is followed by OD and Bazigar.
Conclusion
Chamar group has the highest population among scheduled castes group followed by Balmiki and Dhanak and whereas Bawaria, Doom and OD have lower populations. The main reason behind low educational attainment among Scheduled castes is their unemployment, socio-economic and political backwardness. The main reason of low educational attainment among Scheduled Caste was noticed due to Pandemic covid-19. This pandemic largely affected the educational and occupational structure in rural Haryana. It is suggested that the government should provide more
Figures and tables from the paper
| Sr. No | Castes | No. of HHs | Total Pop. | Male Pop. | Fem. Pop | Total Pop. (0-6Yrs) | Male (0-6Yrs) | Fem. (0-6Yrs) | Total Lit. | In (%) | Male Lit. | In (%) | Fem. Lit. | In (%) | HHs Size | Sex Ratio |
|---|---|---|---|---|---|---|---|---|---|---|---|---|---|---|---|---|
| 1 | Chamar | 403 | 1756 | 952 | 804 | 174 | 92 | 82 | 1186 | 74.97 | 748 | 86.98 | 438 | 60.66 | 4.36 | 845 |
| 2 | Balmiki | 98 | 404 | 216 | 188 | 47 | 25 | 22 | 318 | 89.08 | 173 | 90.58 | 145 | 87.35 | 4.12 | 870 |
| 3 | Dhanak | 67 | 303 | 132 | 171 | 43 | 22 | 21 | 201 | 77.31 | 97 | 88.18 | 104 | 69.33 | 4.52 | 1295 |
| 4 | Bazigar | 15 | 58 | 31 | 27 | 09 | 02 | 07 | 35 | 71.43 | 24 | 92.31 | 11 | 47.83 | 3.87 | 1071 |
| 5 | Banjara | 07 | 32 | 14 | 18 | 05 | 02 | 03 | 23 | 85.19 | 10 | 83.33 | 13 | 86.67 | 4.57 | 1286 |
| 7 | OD | 05 | 19 | 10 | 09 | 03 | 01 | 02 | 09 | 90.00 | 04 | 100 | 05 | 83.33 | 4.33 | 2250 |
| 6 | Bawaria | 03 | 13 | 04 | 09 | 03 | 00 | 03 | 09 | 56.25 | 04 | 57.14 | 05 | 55.56 | 3.80 | 900 |
| 8 | Doom | 02 | 10 | 06 | 04 | 02 | 02 | 00 | 07 | 87.5 | 04 | 100 | 03 | 75.0 | 5.00 | 667 |
| Rural Haryana | 600 | 2595 | 1365 | 1230 | 286 | 146 | 140 | 1788 | 78.96 | 1064 | 87.32 | 724 | 70.72 | 4.33 | 905 |
Table text extracted from the original PDF; superscript letters are shown inline. The original table image is below.
View original table image
| Sr. No. | Name of Sample population Castes | Primary | Middle | Matriculation | 10+2 (Plus Two) | Graduation /B. Ed | Post-Graduation | M.Phil. | Ph.D. | Total |
|---|---|---|---|---|---|---|---|---|---|---|
| 1. | Chamar | 232 | 108 | 56 | 27 | 10 | 03 | 01 | 01 | 438 |
| (%) | 52.97 | 24.66 | 12.79 | 6.16 | 2.28 | 0.68 | 0.23 | 0.23 | 100 | |
| 2. | Balmiki | 63 | 33 | 25 | 13 | 08 | 03 | 00 | 00 | 145 |
| (%) | 43.45 | 22.76 | 17.24 | 8.97 | 5.52 | 2.07 | 0.00 | 0.00 | 100 | |
| 3. | Dhanak | 52 | 28 | 13 | 07 | 04 | 00 | 00 | 00 | 104 |
| (%) | 50.00 | 26.92 | 12.50 | 6.73 | 3.85 | 0.00 | 0.00 | 0.00 | 100 | |
| 4. | Bazigar | 07 | 02 | 02 | 00 | 00 | 00 | 00 | 00 | 11 |
| (%) | 63.64 | 18.18 | 18.18 | 0.00 | 0.00 | 0.00 | 0.00 | 0.00 | 100 | |
| 5. | Banjara | 07 | 04 | 01 | 01 | 00 | 00 | 00 | 00 | 13 |
| (%) | 53.85 | 30.77 | 7.69 | 7.69 | 0.00 | 0.00 | 0.00 | 0.00 | 100 | |
| 6. | Bawaria | 04 | 01 | 00 | 00 | 00 | 00 | 00 | 00 | 05 |
| (%) | 80.00 | 20.00 | 0.00 | 0.00 | 0.00 | 0.00 | 0.00 | 0.00 | 100 | |
| 7. | Od | 03 | 02 | 00 | 00 | 00 | 00 | 00 | 00 | 05 |
| (%) | 60.00 | 40.00 | 0.00 | 0.00 | 0.00 | 0.00 | 0.00 | 0.00 | 100 | |
| 8. | Doom | 02 | 00 | 01 | 00 | 00 | 00 | 00 | 00 | 03 |
| (%) | 66.67 | 0.00 | 33.33 | 0.00 | 0.00 | 0.00 | 0.00 | 0.00 | 100 | |
| Total | 370 | 178 | 98 | 48 | 22 | 06 | 01 | 01 | 724 | |
| (%) | 51.10 | 24.59 | 13.54 | 6.63 | 3.04 | 0.83 | 0.14 | 0.14 | 100 |
Table text extracted from the original PDF; superscript letters are shown inline. The original table image is below.
View original table image
| Castes | Primary | — | Middle | — | Matriculation | — | 10+ 2 (Plus Two) | — | Graduation /B. Ed | — | Post-Graduation | — | M.Phil. | — | Ph.D. | — | Total W.S. | Ranks |
|---|---|---|---|---|---|---|---|---|---|---|---|---|---|---|---|---|---|---|
| Chamar | 52.97x1 | 52.97 | 24.66x2 | 49.32 | 12.79x3 | 38.36 | 6.16x4 | 24.66 | 2.28x5 | 11.42 | 0.68x6 | 4.11 | 0.23x7 | 1.60 | 0.23x8 | 1.84 | 184.26 | III |
| Balmiki | 43.45x1 | 43.45 | 22.76x2 | 45.52 | 17.24x3 | 51.72 | 8.97x4 | 35.86 | 5.52x | 27.59 | 2.07x6 | 12.41 | 0.00x7 | 0.00 | 0.00x8 | 0.00 | 216.55 | I |
| Dhanak | 50.00x1 | 50.00 | 26.92x2 | 53.85 | 12.50x3 | 37.50 | 6.73x4 | 26.92 | 3.85x5 | 19.23 | 0.00x6 | 0.00 | 0.00x7 | 0.00 | 0.00x8 | 0.00 | 187.50 | II |
| Bazigar | 63.64x1 | 63.64 | 18.18x2 | 36.36 | 18.18x3 | 54.55 | 0.00x4 | 0.00 | 0.00x5 | 0.00 | 0.00x6 | 0.00 | 0.00x7 | 0.00 | 0.00x8 | 0.00 | 154.55 | VI |
| Banjara | 53.85x1 | 53.85 | 30.77x2 | 61.54 | 7.69x3 | 23.08 | 7.69x4 | 30.77 | 0.00x5 | 0.00 | 0.00x6 | 0.00 | 0.00x7 | 0.00 | 0.00x8 | 0.00 | 169.23 | IV |
| Bawaria | 80.00x1 | 80.00 | 20.00x2 | 40.00 | 0.00x3 | 0.00 | 0.00x4 | 0.00 | 0.00x5 | 0.00 | 0.00x6 | 0.00 | 0.00x7 | 0.00 | 0.00x8 | 0.00 | 120.00 | VIII |
| Od | 60.00x1 | 60.00 | 40.00x2 | 80.00 | 0.00x3 | 0.00 | 0.00x4 | 0.00 | 0.00x5 | 0.00 | 0.00x6 | 0.00 | 0.00x7 | 0.00 | 0.00x8 | 0.00 | 140.00 | VII |
| Doom | 66.67x1 | 66.67 | 0.00x2 | 0.00 | 33.33x3 | 100.00 | 0.00x4 | 0.00 | 0.00x5 | 0.00 | 0.00x6 | 0.00 | 0.00x7 | 0.00 | 0.00x8 | 0.00 | 166.67 | V |
Table text extracted from the original PDF; superscript letters are shown inline. The original table image is below.
View original table image
References
8 in the original paper- Chamar KV, Chamar SK. Caste Differentials in Levels of Educational Attainment in Village Sirsa Kheri. Transactions. Journal of the Institute of Indian Geographers. 2015;37(1):27-34.
- Chamar KV, Rekha. Levels of Educational Attainment of Chura Caste in Village Badli: A Clan Wise Analysis. Journal of Social Science Research Perspective. 2015;3(1):7-14.
- Arya R, Chamar KV. Differentials in Levels of Educational Attainment of Dhanak Caste in Rural Haryana. Journal of People and Society of Haryana. 2015;5(2):14-17.
- Dey D, Halder T. Present Status of Women in Higher Education in West Bengal: An Appraisal. International Journal of Humanities and Social Science Studies. 2014;1(3):166.
- Roy K. Socio-Economic Characteristics of Slum Population of Kolkata. Geographical Review of India. 2008;70(1):96-104.
- Sharma. Extend of Female School Dropouts in Kangra District of Himachal Pradesh. Journal of Social Science. 2007;10(3):201-204.
- Schultz TW. Invest of Human Capital. American Economic Review. 1961;LI:1-17.
- Vaid D. Gendered Inequality in Educational Transitions. Economic and Political Weekly. 2004;39:3927-3938.