
Research article · 2023 · Full text
International Journal of Statistics and Applied MathematicsConstruction of knowledge test to assess knowledge level of the dairy farmers regarding dairy practices in Garhwal Division of Uttarakhand
Volume 8(5S) · Pages 116–119 · DOI: 10.22271/maths.2023.v8.i5sb.1177 ↗
Research areasLivestock Management and Performance ImprovementAgricultural Systems and PracticesDiverse Educational Innovations Studies
Abstract
Author-writtenLivestock is an inherent component of agriculture, both being intrinsically linked and complementing each other for overall food security. Over 70 percent of the milk produced in India is by small and marginal farmers whose landholdings are small with few heads of cattle or buffaloes. Hence it is a powerful instrument to bring about social and economic transformation, which can improve their livelihoods and development pattern that will lead to the economic growth of the country. The knowledge gap regarding scientific dairy practices and farmers’ ignorance towards recent advances like social media and ICTs was questioned seriously. At, this juncture, farmers’ awareness and knowledge about scientific dairy practices play a very crucial in deciding the upcoming course of action. Thus, it is necessary to measure the knowledge level of farmers for its greater adoption. With this goal, the present study aimed at the construction of a standardized knowledge test to assess the knowledge level of farmers regarding scientific dairy practices. The steps included- item collection, item selection, item analysis, finding reliability and validity of the test items, and then finalization of items. The reliability coefficient value of 0.856 indicated that the test was highly significant. The final knowledge tool containing 36 items was set for data collection. Other researchers or academicians who measure the knowledge level of farmers regarding dairy practices can use this standardized knowledge test.
Summary
Source-checkedPlain-language reading of the full paper, prepared with AI and checked against the text. Each point links to the authors' own words.
Why it matters
- Livestock is critical for rural India's socio-economic structure and food security, supporting over two-thirds of the rural population and contributing 5.21% to the national GDP. View evidence ↗
- Low productivity in dairy farming is attributed to factors such as poor feed quality, indiscriminate breeding, and inadequate extension services. View evidence ↗
- There is a significant gap in information access for animal husbandry compared to crop farming, with only 5.1% of farmer households accessing animal husbandry information. View evidence ↗
The question
- The study aimed to construct a standardized knowledge test to evaluate how much dairy farmers know about scientific dairy practices. View evidence ↗
What they did
- The test covered several sub-areas, including government subsidies, silage preparation, animal diseases, breed selection, vaccination, fodder productivity, mineral mixtures, and artificial insemination. View evidence ↗
- Item analysis was performed using a Difficulty Index (proportion of correct answers) and a Discrimination Index (ability to distinguish well-informed from poorly informed respondents). View evidence ↗
What they found
- The final standardized test consisted of 36 items, selected because they had a difficulty index between 30 and 80 and a discrimination index between 0.3 and 0.6. View evidence ↗
- The test demonstrated high reliability, with a Spearman-Brown split-half reliability coefficient of 0.865. View evidence ↗
Visual summary
1 visualsIllustrations explain the paper; they do not show study data.
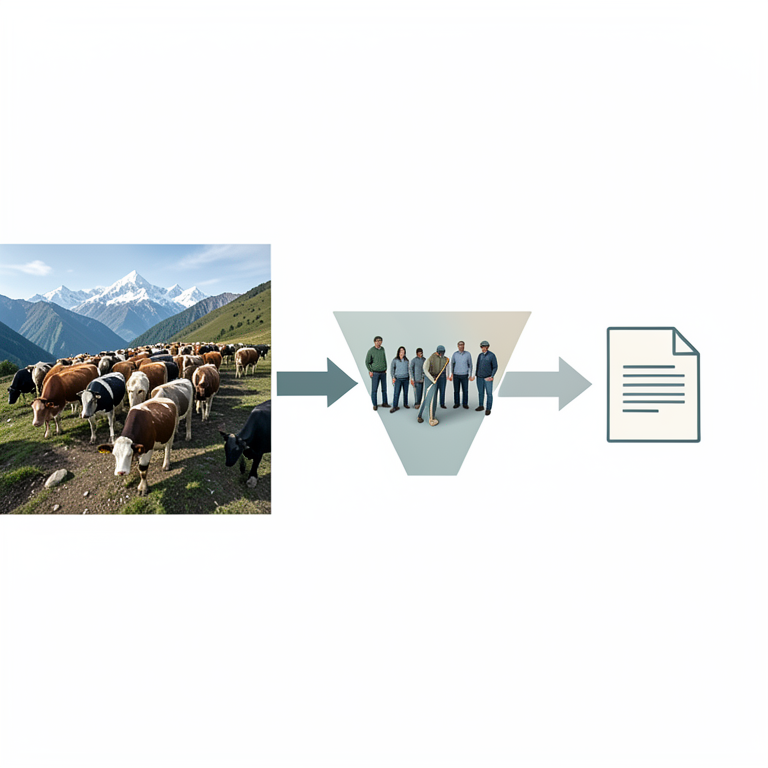
Test Construction Workflow
AI-generated conceptual illustration (Dairy farmers in the Garhwal Division of Uttarakhand). It explains the idea and does not show study data.
View source evidence ↗Figures & tables
From the original paper Table 1
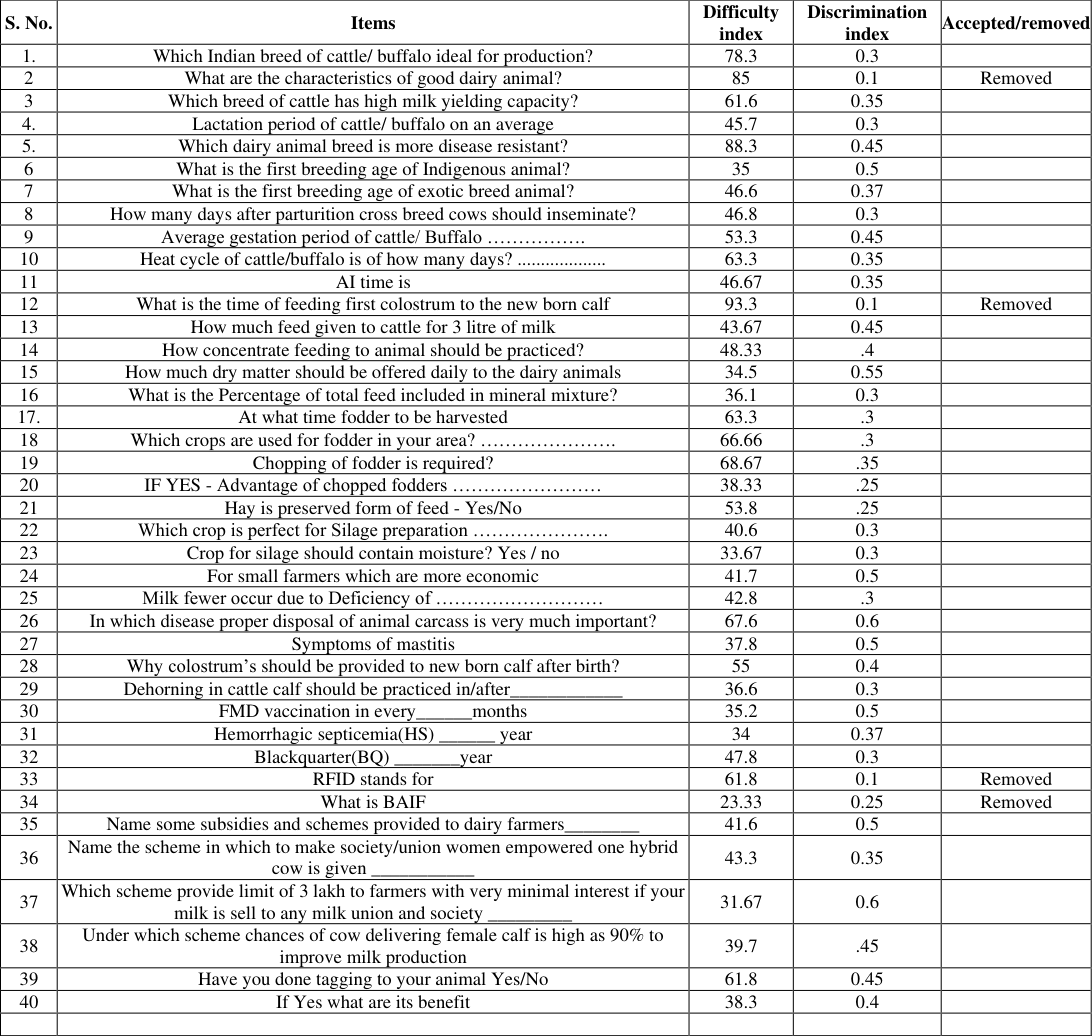 Table 2
Introduction
Livestock plays a very important role in attaining the standard socio-economic structure of rural India and overall food security. It supports livelihood of more than two-third of the rural population, contributes about 5.21 per cent of the GDP and 28.36per cent of the agricultural GDP from agriculture, and allied sector also it provides employment generation opportunity to 8 per cent of the labor force BAHS (2020) [1] . Beyond the direct contribution of generating income and food, it acts as a valuable asset and security for credits, serving as a store of wealth that can be used at the time of adversity. Dairy farming comes under the wide umbrella of livestock. Undoubtedly, India stands highest among the major milk producers of the globe and is having maximum contribution in an agricultural economy. It can be said that the consumption pattern of people is generally shifting to more protein products of animal origin than before. Thus, farmers can generate more income in upcoming future. It was estimated that by the year 2020, the demand for milk will rise to 131-158 million tonnes. Paroda and Kumar (2000) [12] . This increased demand could be met by increasing the productivity of the milch animals because the option of increasing their number is undesirable. Technological and management options are the only alternatives to accelerate the productivity growth, which is currently low. The reasons for low productivity could be indiscriminate breeding, poor quality of feed and fodder, negligence in the health and hygiene of dairy animals, weak resource networks, inadequate extension service, and lack of trained extension professionals. Gairi et al., (2020) [6] . Also, there should be an improvement in the estimation of individual milk constituents to improve the quality of milk. Parmar, (2020) [13] . Understanding the likelihood of dairy farming, crucial steps have been taken by the Indian government in terms of improved technologies in the previous years in the field of the dairying sector; however, they were not successful in changing the socio-economic condition of farmers to the estimated level. This failure may be due to lack of intensive efforts in transferring the technologies and information from the scientific institution to the grass root level. Being in an era where information is considered as a valuable resource, like land, labor and capital, still dearth of information has been a critical concern for farmers of India. According to NSSO (2005) [10] surveyed has shown that in India only 5.1 percent of the farmer households were capable to access any kind of information related to animal husbandry whereas 40.4 percent of the Indian households are accessing information related to modern technology for crop farming. The remarkable change can only be achieved if farmers possessed sufficient knowledge about improved dairy practices and timely access of information could be incorporated at farm level (Triveni et al., (2018) [15] which will gradually lead to the suitable adoption of any new technology and management practices. So, far a very few studies have been conducted on this aspect. For this development of standardized knowledge test for dairy farmers is essential. The study conducted by Chaterjee (2018) [5] stated that for measuring considerable change in retention of the gained information regarding production procedure of the traditional dairy products a standardized knowledge test are needed for accurate measurement. In addition, Verma et al., (2020) [16] studied development of a mobile application to control Brucellosis and its effect in knowledge gain among the commercial dairy farmers of Northern India and opined that there is change in knowledge of the dairy farmers after exposure of mobile application. Similarly, Belakeri et al., (2017) [2] , Sharma et al., (2016) [14] , and Kumari et al., (2020) [8] also developed and conducted knowledge test in the dairy sector. Thus, taking foregoing issues into consideration present study aims to construct knowledge test for the dairy farmers to assess their knowledge level regarding improved dairy practices in the much needed sub areas. Bloom et al., (1956) [3] defined knowledge as those behavior and test situation, which emphasized the remembering, by either recognition or recall, of ideas, materials and phenomenon. Knowledge test measures the level of relevant knowledge possessed by a dairy farmers in a particular area. The correct answers were awarded a score of "one" and incorrect answers were awarded a score of "zero". For constructing a standardized knowledge certain steps to be taken under the study.
Methodology
Methodology
Item collection and Item selection
The content of the knowledge test is composed of questions called items. An items for the test were collected from different sources, such as literature of Jena et al., (2019) [7] . Pandya et al., (2008) [11] , Kumawat et al. (2012) [9] , Chatterjee et al., (2020) [4] , subject matter specialists of GBPUA&T and the researcher's own experience on scientific dairy farming. The knowledge test included multiple-choice type questions (MCQs), Yes/No type questions, and direct questions. The test was developed for determining the knowledge of the dairy farmers in particular selected sub-areas. The Sub-areas were:-Information about government subsidy and scheme, Silage preparation, Common disease of dairy animal, Selection of breed, a vaccination schedule, about improved productivity of fodder seed and fodder plant, feeding mineral mixture and artificial insemination. Each area included at least four to five questions. Thus, fifty items were prepared covering all the aspects of the sub-areas.
Relevancy test -Fifty items were selected for developing knowledge test and framed into objective form questions and in this form, the answers were completely controlled by having Yes/No, multiple choice and fill in the blanks and therefore the assessment was objective and impersonal. These items were sent to the subject matter expert for relevancy checking. Relevancy scores were calculated on a three point continuum with 'most relevant' item rated 3 and 'irrelevant' item rated 1and Out of fifty item forty item were selected.
Item Analysis
Guilford explored that the item analysis of a test yields two kinds of information: item difficulty, item discrimination. Difficulty Index (Pi) The difficulty index of an item was defined as the proportions of dairy farmers giving correct answers to that particular item. This was calculated by the formula: Pi = ni/Ni X100 Equation 1Where Pi = Difficulty index in the percentage of ith item. ni = Number of Dairy owners giving the correct answer to the ith item. Ni = Total number of Dairy owners to whom the ith item was administered.
Discrimination index:
The discrimination index of an item was defined as the level of discrimination between well informed and poorly informed respondents. The discrimination power of all the forty raw items were worked out using E1/3 method to find out the item discrimination, as given below. In this method, those 60 respondents were divided into six equal groups, each having ten respondents and they were arranged in descending order of their magnitude of their knowledge scores as obtained from them. The middle two groups were eliminated. Only four extremes groups i.e. the groups with highest and lowest scores were considered in order to calculate the 'Discrimination Index'. It is calculated by the following formula: The method suggested by Mehta (1958) was adopted for the present study. The formula by which the item discrimination index was calculated is given below:
Where, N = Total number of respondents to whom the items S1 and S2 were the frequencies of correct answers of highest and higher scores, respectively; whereas, S5and S6 are the frequencies of correct answers of lower and lowest scores, respectively. The value of discrimination index ranges from 0 to 1.
Results and Discussions
Data collection was done by administering the questions to sixty farmers in non-sample area of block Roorkee and Laksar of Haridwar district. All the Forty items were administered to each one of the sixty respondents. The responses were collected and quantified by assigning a score of 1 to correct answer and 0 to incorrect answer. A respondent's total score was attained by summation of the score for all questions.
After calculating the scores obtained by 60 respondents, the scores were arranged from the highest to the lowest according to magnitude. Then the respondents were divided into six equal groups of ten members each and were labeled as G1, G2, G3, G4, G5 and G6. For the purpose of item analysis the middle two groups G3 and G4 were eliminated keeping only four extreme groups (G1,G2,G5,G6) with high and low scores. After grouping, the difficulty index and Discrimination index of every were analysed with the formula mentioned above (Equation-1,Equation-2).The index of item difficulty revealed how difficult an item was whereas the latter indicated the extent to which an item discriminates to well-informed individuals from the poorly informed ones.
The one who had cattle will respond for cattle and the one who had buffaloes will respond for buffaloes in the given knowledge test items accordingly.
Reliability of test
Reliability is the degree to which measurement tools provide consistent and stable results. The internal consistency reliability was calculated to check the homogeneity of the test. For evaluating it, the Spearman-Brown split-half test method was applied. Spearman-Brown split half formula (R) = 2r/ (1+r)
The selected non-sampled respondents were administered and filled the knowledge test. Later, the test was divided into odd and even sets, and scores were calculated. Meanwhile, the correlation between odd and even set was found positive. The correlation was denoted with "r "whose value came out to be 0.763. On quantifying the result R=0.865 Thus, the Reliability of the test was 0.865. The Final selection of knowledge test items was done on the basis of the items value with difficulty index ranging from 30 to 80 and Discrimination Index ranging from 0.3 to 0.6 were selected for the final test. Thus, total 36 items were included into the final interview schedule out of 40 items. That is, the items, which were neither too difficult nor too easy to reply and could discriminate the well-informed individuals from the less-informed ones.
Conclusion
In order to test the knowledge level of the respondents regarding improved dairy practices, a total of 36 statements were being selected, which will directly impact respondent's behavior, attitude formation and also discriminate the knowledge level of the individual respondent. Therefore, after assessing the knowledge level of the farmer's intervention of electronic module disseminated through Whats App was arranged to maximize and upgrade the knowledge level of the farmers.
Figures and tables from the paper
| Group no. | G1 | G2 | G3 | G4 | G5 | G6 |
|---|---|---|---|---|---|---|
| Range of scores | 28-22 | 21-19 | 18-17 | 16-15 | 13-14 | 12-10 |
| No. of respondents | 10 | 10 | 10 | 10 | 10 | 10 |
Table text extracted from the original PDF; superscript letters are shown inline. The original table image is below.
View original table image
| S. No. | Items | Difficulty index | Discrimination index | Accepted/removed |
|---|---|---|---|---|
| 1. | Which Indian breed of cattle/ buffalo ideal for production? | 78.3 | 0.3 | |
| 2 | What are the characteristics of good dairy animal? | 85 | 0.1 | Removed |
| 3 | Which breed of cattle has high milk yielding capacity? | 61.6 | 0.35 | |
| 4. | Lactation period of cattle/ buffalo on an average | 45.7 | 0.3 | |
| 5. | Which dairy animal breed is more disease resistant? | 88.3 | 0.45 | |
| 6 | What is the first breeding age of Indigenous animal? | 35 | 0.5 | |
| 7 | What is the first breeding age of exotic breed animal? | 46.6 | 0.37 | |
| 8 | How many days after parturition cross breed cows should inseminate? | 46.8 | 0.3 | |
| 9 | Average gestation period of cattle/ Buffalo ……………. | 53.3 | 0.45 | |
| 10 | Heat cycle of cattle/buffalo is of how many days? ................... | 63.3 | 0.35 | |
| 11 | AI time is | 46.67 | 0.35 | |
| 12 | What is the time of feeding first colostrum to the new born calf | 93.3 | 0.1 | Removed |
| 13 | How much feed given to cattle for 3 litre of milk | 43.67 | 0.45 | |
| 14 | How concentrate feeding to animal should be practiced? | 48.33 | .4 | |
| 15 | How much dry matter should be offered daily to the dairy animals | 34.5 | 0.55 | |
| 16 | What is the Percentage of total feed included in mineral mixture? | 36.1 | 0.3 | |
| 17. | At what time fodder to be harvested | 63.3 | .3 | |
| 18 | Which crops are used for fodder in your area? …………………. | 66.66 | .3 | |
| 19 | Chopping of fodder is required? | 68.67 | .35 | |
| 20 | IF YES - Advantage of chopped fodders …………………… | 38.33 | .25 | |
| 21 | Hay is preserved form of feed - Yes/No | 53.8 | .25 | |
| 22 | Which crop is perfect for Silage preparation …………………. | 40.6 | 0.3 | |
| 23 | Crop for silage should contain moisture? Yes / no | 33.67 | 0.3 | |
| 24 | For small farmers which are more economic | 41.7 | 0.5 | |
| 25 | Milk fewer occur due to Deficiency of ……………………… | 42.8 | .3 | |
| 26 | In which disease proper disposal of animal carcass is very much important? | 67.6 | 0.6 | |
| 27 | Symptoms of mastitis | 37.8 | 0.5 | |
| 28 | Why colostrum’s should be provided to new born calf after birth? | 55 | 0.4 | |
| 29 | Dehorning in cattle calf should be practiced in/after | 36.6 | 0.3 | |
| 30 | ____________ FMD vaccination in every months | 35.2 | 0.5 | |
| 31 | ______ Hemorrhagic septicemia(HS) year | 34 | 0.37 | |
| 32 | ______ Blackquarter(BQ) year | 47.8 | 0.3 | |
| 33 | _______ RFID stands for | 61.8 | 0.1 | Removed |
| 34 | What is BAIF | 23.33 | 0.25 | Removed |
| 35 | Name some subsidies and schemes provided to dairy farmers | 41.6 | 0.5 | |
| 36 | ________ Name the scheme in which to make society/union women empowered one hybrid cow is given | 43.3 | 0.35 | |
| 37 | ___________ Which scheme provide limit of 3 lakh to farmers with very minimal interest if your milk is sell to any milk union and society | 31.67 | 0.6 | |
| 38 | _________ Under which scheme chances of cow delivering female calf is high as 90% to improve milk production | 39.7 | .45 | |
| 39 | Have you done tagging to your animal Yes/No | 61.8 | 0.45 | |
| 40 | If Yes what are its benefit | 38.3 | 0.4 | |
Table text extracted from the original PDF; superscript letters are shown inline. The original table image is below.
View original table image
References
12 in the original paper- Belakeri P, Satyanarayan K, Jagadeeswary V, Yathiraj S, Veeranna KC, Rajeshwari YB, et al. Effectiveness of Mobile App on Fodder Production in Terms of Knowledge Gain among Livestock Farmers of Karnataka. Indian Research Journal of Extension Education. 2017;2(1):10-15.
- Chatterjee D, Jha SK, Maiti S. Development of knowledge test regarding method of preparation of traditional dairy products. Indian Research Journal of Extension Education. 2020;20(2):17-21.
- Chatterjee D, Jha SK, Maiti S. Effect of multimedia on preparation of traditional dairy products at the household level. 'In: National Seminar on Socio-Digital Approaches for Transforming Indian Agriculture (ISEE-2019)' at New Delhi during; c2018.
- Garai S, Maiti S, Meena BS. Knowledge level vis-à-vis improved dairy farming practices: an appraisal on the Santhal dairy farmers of Burdwan district (West Bengal). Indian Research Journal of Extension Education. 2020;20(1):1-4.
- Jena A, Chander M, Sinha SK. Knowledge test development for dairy farmers to measure knowledge level about scientific dairy farming practices. Indian Journal of Veterinary Sciences & Biotechnology. 2019;14(4):67-71.
- Kumari A, Kumar P, Kumar A, Singh A. Development and standardization of knowledge test on value addition of milk. Indian Journal of Extension Education. 2020;56(4):7-13.
- Kumawat R, Yadav JP, Yadav VPS. Development of a standardized knowledge test for measuring knowledge level of dairy farmers about improved dairy husbandry practices. Journal of Community Mobilization and sustainable development. 2012;7(2):183-188.
- Paroda RS, Kumar P. Food Production and Demand in South Asia. Agricultural Economic Research Review. 2000;13(1):1-24.
- Parmar P, Lopez N, Tobin JT, Murphy E, McDonagh A, Crowley SV, et al. The effect of compositional changes due to seasonal variation on milk density and the determination of season-based density conversion factors for use in the dairy industry. Foods. 2020;9(8):1004.
- Sharma K, Singh SP, Yadav VPS. Knowledge of dairy farmers about improved buffalo husbandry management practices. Indian Research Journal of Extension Education. 2016;9(3):51-54.
- Triveni G, Sharma GRK, Satyanarayana C, Rao KS, Raghunandhan T. Knowledge level of dairy farmers on adoption of dairy innovations in Andhra Pradesh-An Analysis. Indian Research Journal of Extension Education. 2018;18(1):1-4.
- Verma AP, Meena HR, Patel D, Meena MSB. Development of a mobile application to control Brucellosis and its effect in Knowledge gain among the commercial dairy farmers of Northern India. Indian Journal Dairy Science. 2020;73(4):359-364.