
Research article · 2022 · Full text
International Journal of Agriculture and NutritionAnalysis of the proportion of food expenditures for rice farming households in Lampuyang village, Teluk Sampit district, Kotawaringin Timur Regency
Volume 4(1) · Pages 61–64 · DOI: 10.33545/26646064.2022.v4.i1a.113 ↗
Research areasFood Security and Socioeconomic DynamicsPublic Health and Nutrition
Abstract
Author-writtenThe purpose of this study was to determine the proportion of food expenditure to the total expenditure of rice farming households. Knowing the quantity and quality of household food consumption of rice farmers. Knowing rice farmer household food security. In this research, 41 rice farming households were taken as samples. The method used in this research is descriptive method. The method of taking the research location was carried out by purposive sampling, namely in the village of Lampu which is in the Teluk Sampit District, East Kotawaringin Regency. Types and sources of data used consist of primary data and secondary data. Data collection techniques were carried out by interviews, observation, and recording. Data analysis method is descriptive with average and percentage analysis. Based on the results of the study, the average total expenditure of rice farming households was IDR 2,752,117.40. It is known that spending on food is around IDR 1,647,079.45 (59.85%) and spending on non-food is around IDR 1,105,037.95 (40.15%). The average energy adequacy level of rice farming households is in the sufficient category of 51.8%, while the average protein adequacy level of rice farming households is 90.2% which is in the sufficient category. Conditions Food security in rice farming households is mostly food vulnerable, namely 36.6%, followed by food shortages of 29.3%, food insecurity of 19.5%, while food secure households are only 14.6%. So that it can be said that the food security of farmer households is still relatively poor.
Summary
Source-checkedPlain-language reading of the full paper, prepared with AI and checked against the text. Each point links to the authors' own words.
Why it matters
- A higher proportion of household spending on food is often used as an indicator of lower welfare and increased poverty. View evidence ↗
- Food security is defined as the guaranteed access to food for all individuals and households at all times to ensure healthy living and working conditions. View evidence ↗
- In the Sampit Bay sub-district of East Kotawaringin Regency, rice farming is the dominant livelihood due to high lowland rice production potential. View evidence ↗
The question
- The study aimed to determine the proportion of food expenditure relative to the total expenditure of rice farming households. View evidence ↗
- The research also sought to understand the quality and quantity of food consumption and the overall food security of these households. View evidence ↗
What they did
- The study used a sample of 41 rice farming families, representing 10% of the total population of 411 families in Lampuyang Village. View evidence ↗
- The research location in Lampuyang Village was selected using purposive sampling. View evidence ↗
- Data were collected through interviews, observation, and recording, and analyzed using descriptive statistics, specifically averages and percentages. View evidence ↗
What they found
- The average total monthly expenditure was IDR 2,752,117.40, with food spending accounting for 59.85% (IDR 1,647,079.45) and non-food spending accounting for 40.15% (IDR 1,105,037.95). View evidence ↗
- Within the food expenditure category, cigarettes represented the highest average cost at Rp 539,878.05 (32.78%), while milk was the lowest at Rp 13,414.63 (0.81%). View evidence ↗
- Housing and housing facilities constituted the largest portion of non-food expenditures at 58.64%. View evidence ↗
- The average adequacy levels for energy and protein were 51.8% and 90.2%, respectively, both falling into the sufficient category. View evidence ↗
- Food security was poor for most households: 36.6% were food vulnerable, 29.3% had food shortages, 19.5% were food insecure, and only 14.6% were food secure. View evidence ↗
What it means
- The authors conclude that because food expenditure exceeds non-food expenditure, the level of household welfare is low, consistent with Engel's law. View evidence ↗
- The authors state that the food security of the surveyed farmer households remains relatively poor. View evidence ↗
Visual summary
3 visualsIllustrations explain the paper; charts are replotted from the paper's own table values.
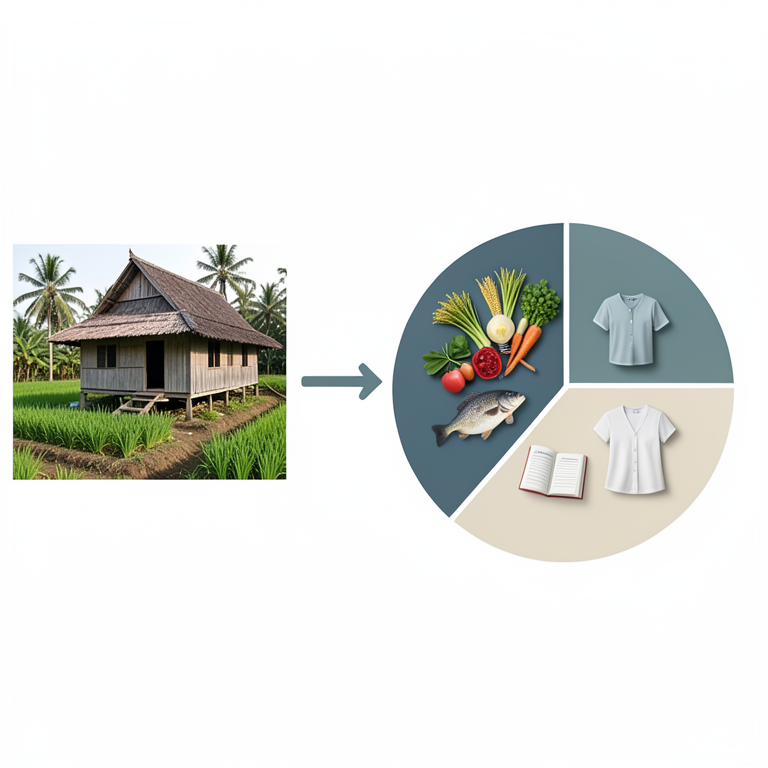
Expenditure Distribution
AI-generated conceptual illustration (Rice farming households in a rural Indonesian village). It explains the idea and does not show study data.
View source evidence ↗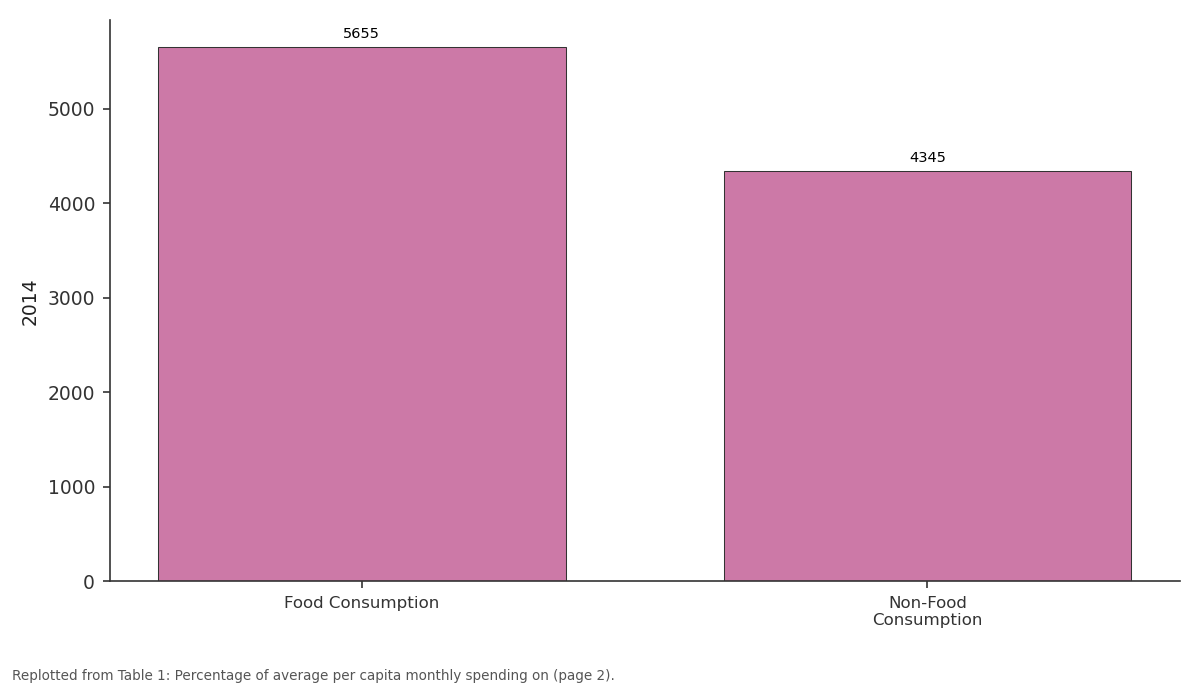
2014: Food Consumption vs Non-Food Consumption
Replotted from Table 1 (page 2) of the original paper. Every bar is the paper's own table value.
View source evidence ↗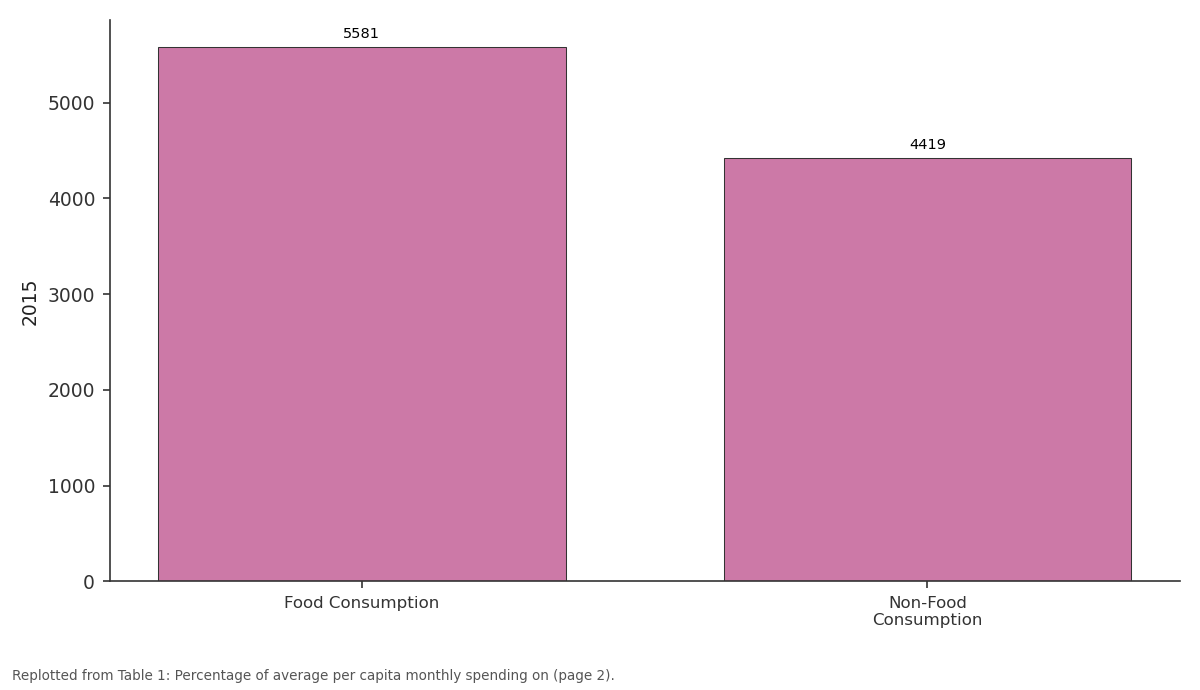
2015: Food Consumption vs Non-Food Consumption
Replotted from Table 1 (page 2) of the original paper. Every bar is the paper's own table value.
View source evidence ↗Figures & tables
From the original paper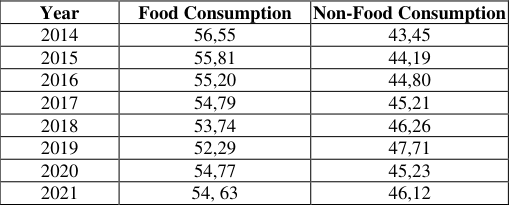 Table 1
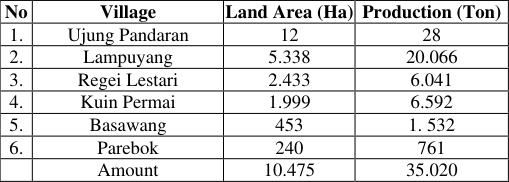 Table 2
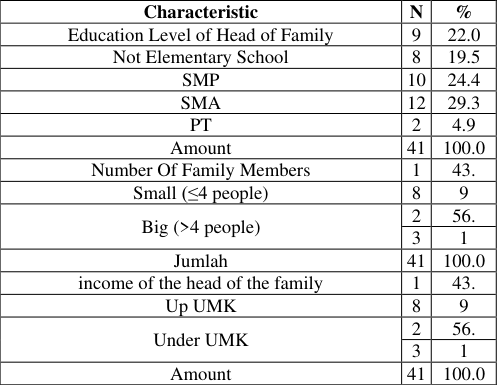 Table 3
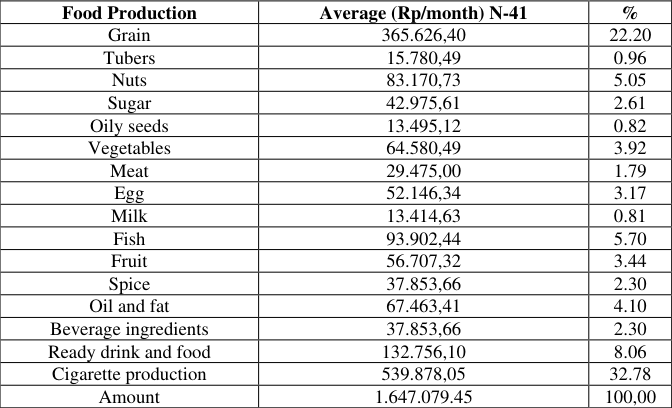 Table 4
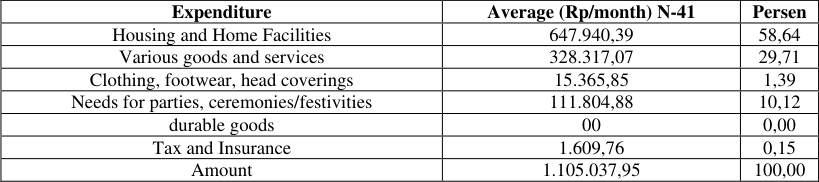 Table 5
Introduction
According to Marwanti in Yudaningrum (2011) [8] expenditure is divided into two, namely food and non-food expenditure. An increase in the proportion of expenditure for the food group can be an indicator of declining population welfare and widening poverty due to deepening limited income conditions. In limited conditions, someone will prioritize meeting food needs and most of the income is spent on food consumption According to Widowati (2009) [7] Food security is defined as guaranteed access to food for all households and individuals at all times so they can work and live healthily. Food security is determined by the availability and access of individuals or households to get it depending on the availability of food. The food sector determines the level of welfare of the majority of the rural population, which consists of farmers with narrow land and agricultural labourers, as well as urban poor consumers who use a large portion of their income for consumption. According to Purwantini (2009) [5] broadly speaking, household needs can be grouped into two broad categories, namely food and non-food needs. With Thus, at a certain level of income, households will allocate their income to meet these two needs. The amount of income (Proxied as total expenditure) spent on food for a household can be used as an indicator of the level of welfare of the household, or in other words, the higher the share of food expenditure, the less prosperous the household, conversely, the smaller the share of food expenditure, the ladder is getting better The average per capita expenditure for food expenditure in Central Kalimantan in the period 2011 to 2018 has decreased, while non-food expenditure has increased. The percentage of average monthly expenditure per capita for food and non-food items in Central Kalimantan Province can be seen in Table 1 below. As shown in Table 1. Spending on food consumption from 2014 to 2021 average spending on food consumption is 54.72% while non-food consumption is 45.37%. This shows that it is not good where most of the household income is allocated for food consumption expenditure. As Ernest Engel, known as Engel's law, states that the higher the people's income, the smaller the proportion of people's spending on food. In other words, along with an increase in income, a shift will gradually occur, namely a decrease in the portion of income spent on non-food items. Shifts in the composition or pattern of spending. This occurs because the elasticity of demand for food is generally low. Thus, the share of household food expenditure is an indicator of the level of community prosperity. So the share (in %) spending on food is getting smaller, then the level of community prosperity is said to be getting better (Trisnowati, 2013) [6] . Increase in National Rice Production (P2BN) 2012 Rice farming is constantly being developed because apart from being a source of income for farmers, rice is also the staple food for the majority of Indonesian people. Efforts to achieve food security in Indonesia cannot be separated from increasing food production in particular Rice is the staple food for the majority of Indonesia's population. East Kotawaringin Regency has 17 sub-districts, Sampit Bay is the sub-district that has the largest lowland rice production with the potential for large enough agricultural land and large yields, so the most dominant livelihood is rice farming. The district that produces the largest rice in the district East Kotawaringin is Sampit Bay District. Teluk Sampit sub district, where the majority of the population are rice farmers. As a rice center area, Teluk Sampit District consists of 7 villages including Lampuyang Village which has the highest land area and production. Harvested area and rice production in Teluk Sampit District can be seen in Table 2. below: The amount of production produced does not necessarily meet sufficient food availability so that it cannot reflect household food security. The amount of production produced does not necessarily meet sufficient food availability so that it cannot be reflects household food security. Low income will result in poor household food conditions, because more income is spent on food consumption. The higher the income level of a farmer household, the larger the farmer household obtain good food so that welfare is guaranteed. In addition, Lampuyang Village is one of the Teluk Sampit Districts which has an uneven food distribution problem/food and non-food shopping places that are still far from residence community. Based on the background, the objective of this study was to determine the proportion of food expenditure to the total expenditure of rice farming households in Lampuyang Village, Teluk Sampit District.
| No | Village | Land Area (Ha) | Production (Ton) |
|---|---|---|---|
| 1. | Ujung Pandaran | 12 | 28 |
| 2. | Lampuyang | 5.338 | 20.066 |
| 3. | Regei Lestari | 2.433 | 6.041 |
| 4. | Kuin Permai | 1.999 | 6.592 |
| 5. | Basawang | 453 | 1. 532 |
| 6. | Parebok | 240 | 761 |
| Amount | 10.475 | 35.020 |
Table text extracted from the original PDF; superscript letters are shown inline. The original table image is below.
View original table image
| Year | Food Consumption | Non-Food Consumption |
|---|---|---|
| 2014 | 56,55 | 43,45 |
| 2015 | 55,81 | 44,19 |
| 2016 | 55,20 | 44,80 |
| 2017 | 54,79 | 45,21 |
| 2018 | 53,74 | 46,26 |
| 2019 | 52,29 | 47,71 |
| 2020 | 54,77 | 45,23 |
| 2021 | 54, 63 | 46,12 |
Table text extracted from the original PDF; superscript letters are shown inline. The original table image is below.
View original table image
Research methods
This research was conducted in Lampuyang Village, Teluk Sampit District, East Kotawaringin Regency. The location determination was carried out purposively with the consideration that the area has the highest production and harvested area in Teluk Sampit District. Sampling uses Simple Random Sampling, namely data collection or respondents are carried out in a simple random way, where the sample is taken in such a way that each population unit has the same opportunity to be selected as a sample. Considering the criteria of the respondentsthe sample is those who work as rice farmers, the number of heads of rice farming families is 411 families. In determining the sample size, the researcher followed the opinion of Suharsimi Arikunto (2006) [1] , that is, if there are less than 100 subjects, all of them should be taken so that this study is a population study. Furthermore, if the number of subjects is large, it can be taken between 10-15% or 20-25% or more according to the ability of the researcher. Nasution (2006) [4] also revealed that the appropriate sample size is often called the tenth rule, which is 10% of the total population. If the population is 1000 people, then 100 people is considered sufficient. The population of rice farmers in Lampuyang Village, Teluk Sampit District, East Kotawaringin Regency is 411 families, so that 10% of 411 is 41.1, if rounded up the number of samples selected is 41 families. The type of research method chosen is descriptive analysis, analysis takes problems or focuses attention on problems as they were when the research was carried out, the results were then processed and analyzed to draw conclusions. The data obtained will be studied, calculated, complicated, Presented in a form tabulation (Table ). This data is processed quantitatively by using a computer through the SPSS 16.0 application. The tool used to answer the objective is to find out the proportion of food expenditure to the total expenditure of farming households using the formula Yudaningrum (2011) [8] as follows:
Where PF = Proportion of food expenditure (%) PP = Food expenditure (Rupiah) TP = Farm household total expenditure (Rupiah)
Farmer household characteristics
The characteristics of the respondents are a general description of the condition of the respondents. The respondent's household includes data on education and the number of family members and income per month from rice farming. In this study, 41 respondents were taken from Lampuyang Village, Teluk Sampit District, East Kotawaringin Regency. The characteristics of the respondent's household can be seen in the table 3 as follows: From Table 3 it can be seen that the last education was in the SMA group of 12 households (29.3%). The average educational level of the head of the family is 7 years. This means that the education level of the respondents is still low. The low education of respondents is due to limited funds, the school is far from where they live, so they experience difficulties in accessing transportation. It is known that the highest number of household members is ≥4 people (53.7%). Large households affect food needs, the more family members, the more food needs. The number of family members can also increase family income because more family members are working. The income of the head of the family is in the low income group below the East Kotawaringin District Minimum Wage (Rp. 2, 991, 946) for 23 households or around (56.1%). The source of the respondents' income comes from the income of husband, wife and children and others. Family income is an important factor in determining the quality and quantity of food consumed by households. High income will increase the quantity and quality of food, whereas households with low income are more concerned with food in quantity and not yet or less concerned with the nutrition contained in food.
| Characteristic | N | % |
|---|---|---|
| Education Level of Head of Family | 9 | 22.0 |
| Not Elementary School | 8 | 19.5 |
| SMP | 10 | 24.4 |
| SMA | 12 | 29.3 |
| PT | 2 | 4.9 |
| Amount | 41 | 100.0 |
| Number Of Family Members | 1 | 43. |
| Small (≤4 people) | 8 | 9 |
| Big (>4 people) | 2 | 56. |
| 3 | 1 | |
| Jumlah | 41 | 100.0 |
| income of the head of the family | 1 | 43. |
| Up UMK | 8 | 9 |
| Under UMK | 2 | 56. |
| 3 | 1 | |
| Amount | 41 | 100.0 |
Table text extracted from the original PDF; superscript letters are shown inline. The original table image is below.
View original table image
Rice farmer household expenditures
Household food expenditure is the amount of money spent for household consumption. Food expenditure can be divided into two, namely expenditure for food and non-food expenditure. Average monthly expenditure on food in Lampuyang Village can be seen in Table 4 below. Based on Table 4, it can be seen that the largest average food expenditure, namely cigarettes, was Rp. 539,878.05 (32.78%) while the smallest average food expenditure was found in milk, which was Rp. 13,414.63 (0.81%). Cigarette expenditure also affects the consumption of other foods to obtain food nutritious. Respondents' households thought that they were used to smoking in carrying out their daily activities and it was difficult to get rid of, of course this had an effect on food consumption patterns. Milk, tubers and meat provide energy and protein for the body but are rarely consumed by the respondents. Apart from spending on food, other expenses for households are non-food expenses, namely housing and home facilities, various goods and services, clothing, footwear and head coverings, durable goods, taxes, levies and insurance, party and ceremonial needs. The average household non-food expenditure of rice farmer respondents can be seen in Table 5. as follows. Based on Table 5. above, it can be seen that the largest average non-food expenditure is for housing and housing facilities, which is 58.64%. The largest expenditure on housing and housing facilities is gasoline, with an average expenditure of Rp. 306,048.78. Non-food costs. The high number of respondent households is due to the daily use of machines and vehicles. Based on Table 4 and Table 5. it can be seen that the average total expenditure. Total expenditure is expenditure for food consumption plus non-food expenditure. The size of the average total expenditure in this study is IDR 2,752,117.40. It is known that spending on food is around IDR 1,647,079.45 (59.85%) and spending on non-food is IDR. 1,105,037.95 approximately (40.15%). It can be concluded that food expenditure is greater than non-food expenditure in total expenditure. According to Engel's law, the higher the proportion of food expenditure, the lower the level of household welfare.
| Expenditure | Average (Rp/month) N-41 | Persen |
|---|---|---|
| Housing and Home Facilities | 647.940,39 | 58,64 |
| Various goods and services | 328.317,07 | 29,71 |
| Clothing, footwear, head coverings | 15.365,85 | 1,39 |
| Needs for parties, ceremonies/festivities | 111.804,88 | 10,12 |
| durable goods | 00 | 0,00 |
| Tax and Insurance | 1.609,76 | 0,15 |
| Amount | 1.105.037,95 | 100,00 |
Table text extracted from the original PDF; superscript letters are shown inline. The original table image is below.
View original table image
| Food Production | Average (Rp/month) N-41 | % |
|---|---|---|
| Grain | 365.626,40 | 22.20 |
| Tubers | 15.780,49 | 0.96 |
| Nuts | 83.170,73 | 5.05 |
| Sugar | 42.975,61 | 2.61 |
| Oily seeds | 13.495,12 | 0.82 |
| Vegetables | 64.580,49 | 3.92 |
| Meat | 29.475,00 | 1.79 |
| Egg | 52.146,34 | 3.17 |
| Milk | 13.414,63 | 0.81 |
| Fish | 93.902,44 | 5.70 |
| Fruit | 56.707,32 | 3.44 |
| Spice | 37.853,66 | 2.30 |
| Oil and fat | 67.463,41 | 4.10 |
| Beverage ingredients | 37.853,66 | 2.30 |
| Ready drink and food | 132.756,10 | 8.06 |
| Cigarette production | 539.878,05 | 32.78 |
| Amount | 1.647.079.45 | 100,00 |
Table text extracted from the original PDF; superscript letters are shown inline. The original table image is below.
View original table image
References
2 in the original paper- Keynes, John Maynard. The General Theory of Employment, Interest and Money. Penerbit Palgrave Macmillan. Hal 472 edition; 1936-2007.
- Purwantini. Food Insecurity and Nutrition Approaches: Magnitude Characteristics and Causes. Center for Agricultural Socioeconomics and Policy. Jl. A Yani No. 2014, 70 Bogor; c1661.