
Research article · 2023 · Full text
International Journal of Statistics and Applied MathematicsStudy on factors influencing the performance of the farmer-producer organizations dealing with non-perishable products
Volume 8(4S) · Pages 740–744 · DOI: 10.22271/maths.2023.v8.i4sj.1143 ↗
Research areasAgricultural Economics and PracticesAgricultural risk and resilience
Abstract
Author-writtenTamil Nadu had almost 900 FPOs at that time, with more than 50% of them dealing with non-perishable products in various forms. Each of them had the highest potential to grow, but only a few were performing well, while others were not. While observing them, there were some factors that differentiated the well-performing FPOs from the other FPOs that were yet to perform well. The study aimed to find the factors that influenced the performance of the Farmer's Producer Organizations. Many of the influencing factors were identified through brainstorming with different CEOs, boards of directors of the FPOs, and other experts in the field. Major factors such as operational factors, managerial factors, financial factors, and leadership factors were considered for the study. These factors were then converted into statements to determine the degree of influence on the performance of the FPOs. The sample was collected from 60 respondents (CEOs and BODs). Once the data were collected, the analysis was carried out using the Exploratory Factor Analysis method in the SPSS software. The factors were divided into three levels: highly influencing, moderately influencing, and low influencing factors. The study found that out of 68.7% of the identified factors influencing the performance, 53% of the performance was influenced by operational factors, 8.5% of the performance was influenced by marketing factors, and 7.146% of the performance was influenced by financial factors.
Summary
Source-checkedPlain-language reading of the full paper, prepared with AI and checked against the text. Each point links to the authors' own words.
Why it matters
- In Tamil Nadu, there were nearly 900 Farmer Producer Organizations (FPOs), over half of which focused on non-perishable products. View evidence ↗
- While these FPOs have significant growth potential, there is a notable disparity in their actual performance. View evidence ↗
- Specific differentiating factors exist that separate high-performing FPOs from those that are underperforming. View evidence ↗
The question
- The objective of this research was to identify the factors that influence the performance of Farmer Producer Organizations. View evidence ↗
What they did
- Data were randomly collected from 60 respondents, specifically CEOs and Board of Directors of FPOs dealing with non-perishable products across Tamil Nadu. View evidence ↗
- The study focused on operational, managerial, financial, and leadership factors as primary influences on performance. View evidence ↗
- Exploratory Factor Analysis (EFA) was the primary statistical method used to identify the most influential performance characteristics. View evidence ↗
What they found
- Most of the surveyed FPOs were between 4 to 7 years old (68.33%), with 25% operating for 8 to 11 years. View evidence ↗
- A large majority of the FPOs (75%) reported an annual turnover of less than 50 lakh Rupees. View evidence ↗
- The KMO statistic of 0.845 indicated that the sample size was sufficient and appropriate for factor analysis. View evidence ↗
- Three main components with eigenvalues greater than one were identified, explaining approximately 69.159% of the total variance. View evidence ↗
- Operational or functional factors were the most dominant influence, accounting for 53.132% of the variance in performance. View evidence ↗
- Marketing factors were the second most influential group, contributing 8.513% to the performance variance. View evidence ↗
- Financial factors had the lowest relative influence among the three main components, accounting for 7.146% of the variance. View evidence ↗
What it means
- The authors conclude that operational and functional factors are the primary drivers of performance for FPOs dealing with non-perishable products. View evidence ↗
- Financial elements, including turnover, credit access, transparency, and grants, were found to be the least influential factors. View evidence ↗
Visual summary
2 visualsIllustrations explain the paper; charts are replotted from the paper's own table values.
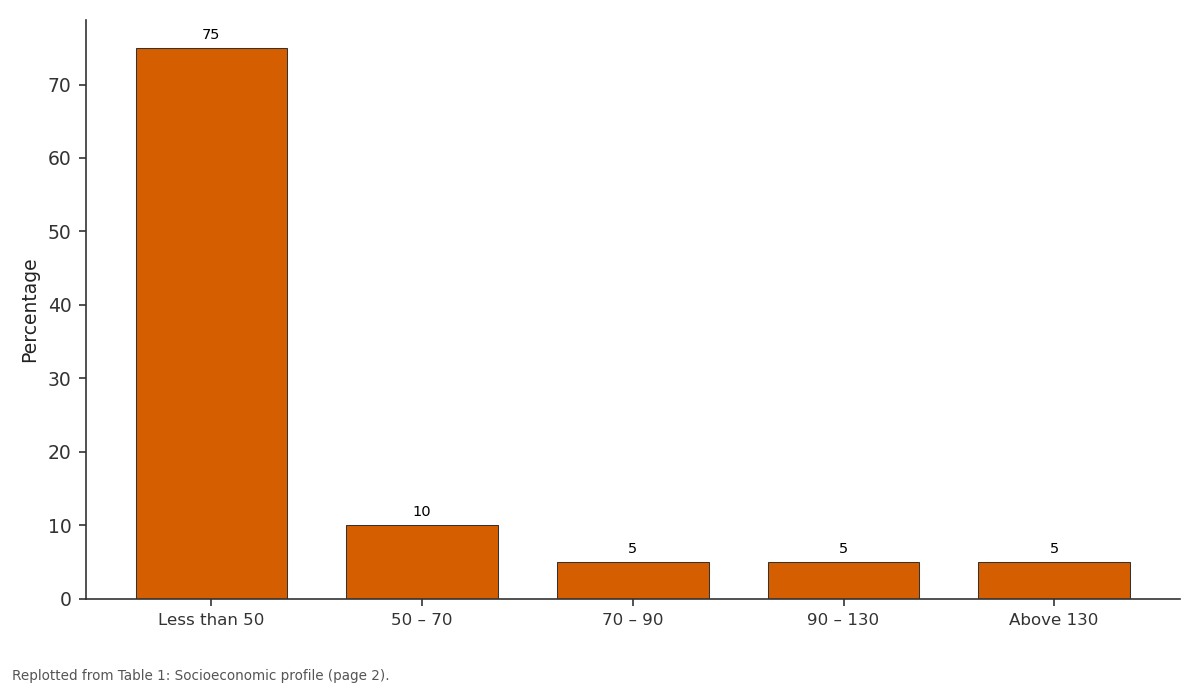
Percentage: Less than 50 vs 50 – 70 vs 70 – 90 vs 90 – 130 vs Above 130
Replotted from Table 1 (page 2) of the original paper. Every bar is the paper's own table value.
View source evidence ↗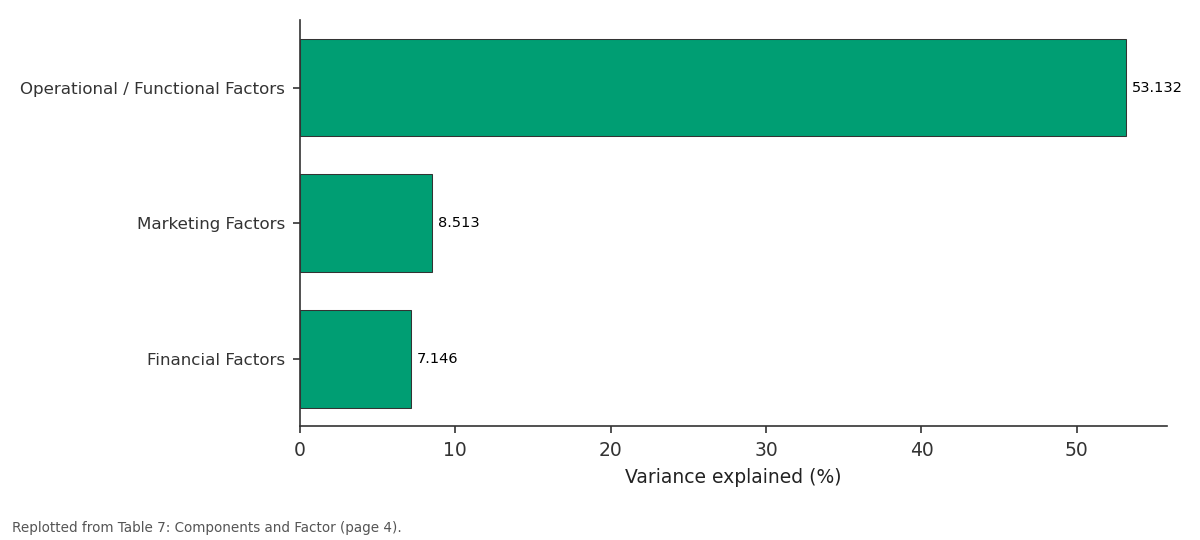
Variance explained: Operational /... vs Marketing Factors vs Financial Factors
Replotted from Table 7 (page 4) of the original paper. Every bar is the paper's own table value.
View source evidence ↗Figures & tables
From the original paper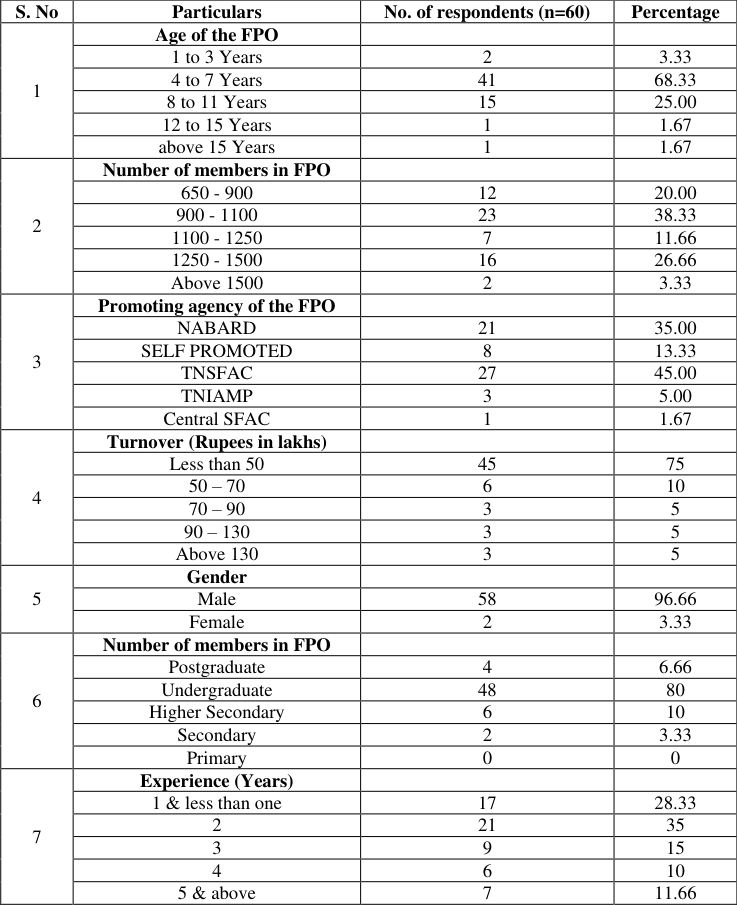 Table 1
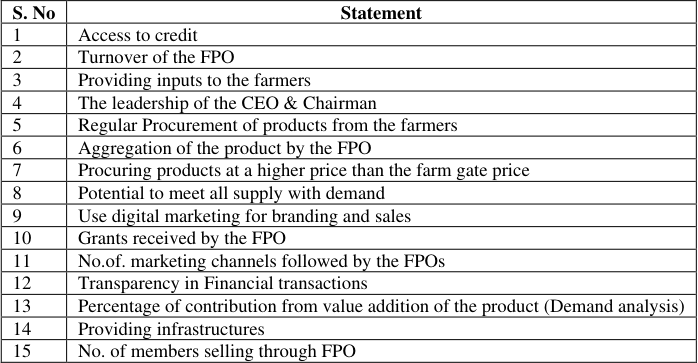 Table 2
 Table 3
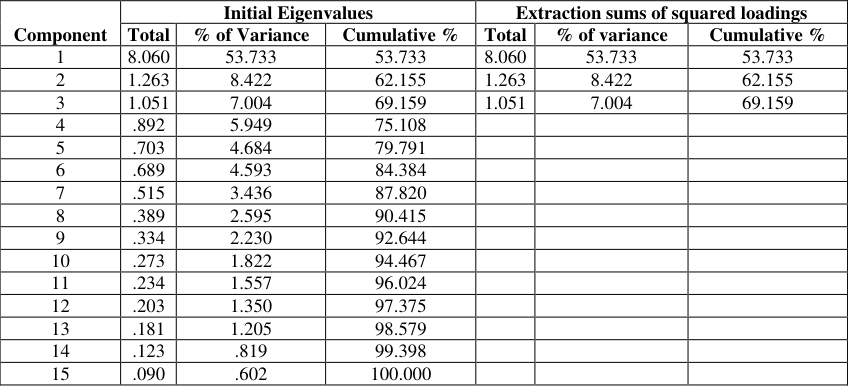 Table 4
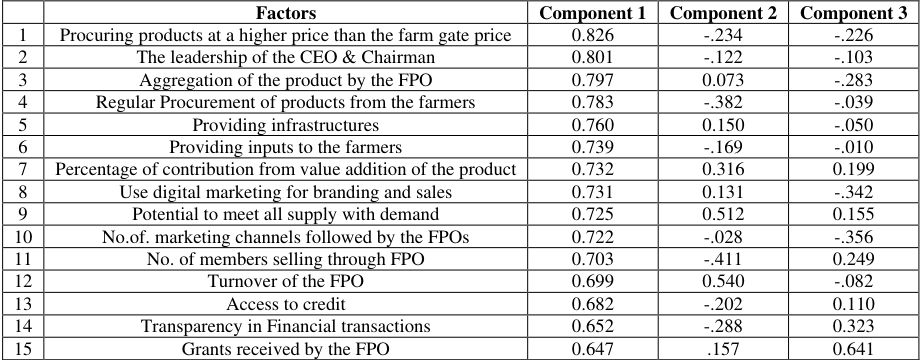 Table 5
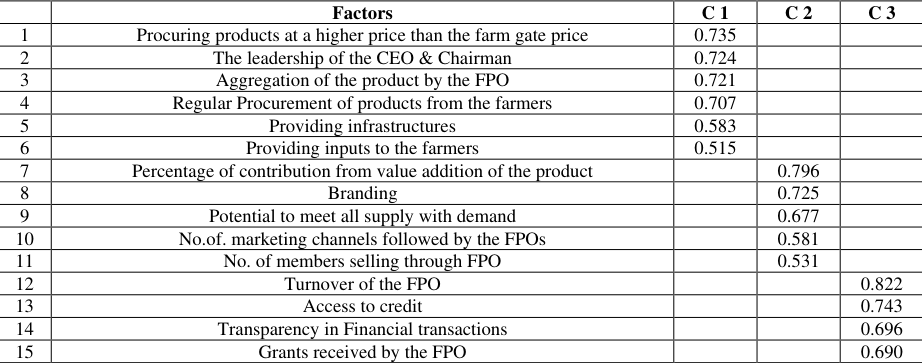 Table 6
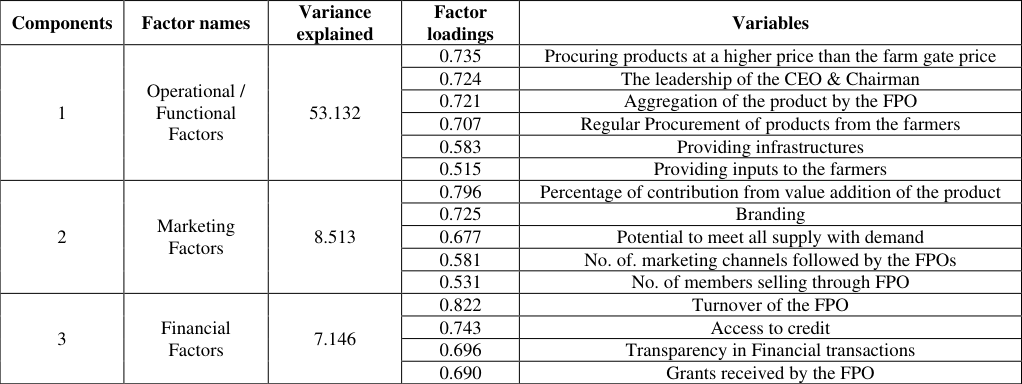 Table 7
Introduction
The performance of Farmer Producer Organizations (FPOs) had been a subject of considerable research interest, with various studies exploring the factors that influenced their effectiveness and success. These investigations had provided valuable insights into the dynamics that shaped FPO performance and had offered a deeper understanding of the challenges and opportunities within this realm. For instance, Amitha et al. (2021) [1] had focused on FPOs in the Medak district of Karnataka, highlighting the significance of education, group leadership, communication, and participation as key factors influencing FPO performance. Sanjiv Kumar et al. (2023) had conducted an extensive study across multiple Indian states, revealing that FPOs engaging in diverse activities had tended to achieve higher turnover and net profit. Their findings had underscored the importance of factors like membership, Board of Directors size, operational years, and paid-up capital in shaping FPO success. Mahesh Babu et al. (2021) [4] had examined how member characteristics related to FPO performance, emphasizing the positive impact of education, income, training, market orientation, and social involvement. Neha Kumari (2023) had delved into the competencies crucial for effective FPO management, highlighting areas like planning, marketing, financial management, and leadership as pivotal for enhanced performance. Beyond the Indian context, studies by Agrawal (2022) [3] , Gagana (2023) [6] , had also explored various aspects of FPO performance, ranging from factors influencing farmer participation and technical efficiency to market performance and welfare. These studies had collectively shed light on the multifaceted nature of FPOs and their performance determinants.
By examining these diverse findings, we could gain a comprehensive understanding of the factors that drove the success of Farmer Producer Organizations, informing strategies to enhance their impact and effectiveness in agricultural contexts.
Materials and Methods
Materials and Methods
Study area
The data had been collected from the CEOs and Board of Directors of the FPOs dealing with non-perishable products randomly all over Tamil Nadu to rate the most influential factors for the performance of the FPO. A total of 60 responses were collected from various FPOs dealing with non-perishable products.
Tool for analysis
Exploratory factor analysis were used to analyze and to identify the most influential characteristics that determined the performance of the FPOs dealing with non-perishable products.
Result and Discussion
Result and Discussion
Socio-economic profile of the respondents
The socio-economic profile of the respondents were analysed and shown in the table. The survey had gathered responses from 60 participants regarding various aspects of Farmer Producer Organizations (FPOs). In terms of the FPOs' age, the majority of them had been in existence for 4 to 7 years (68.33%), followed by those in operation for 8 to 11 years (25%). A smaller percentage had represented FPOs of different age ranges. When it came to the number of members within these FPOs, the data indicated a diverse distribution. The majority of FPOs had fallen within the range of 900 to 1100 members (38.33%), followed closely by those with 1250 to 1500 members (26.66%). Some FPOs had had larger membership sizes, but they had formed a smaller proportion of the total. The survey participants had also identified the promoting agencies behind the FPOs. Notably, NABARD had played a significant role in promoting 35% of the FPOs, followed by TNSFAC at 45%. There had also been FPOs that had been self-promoted (13.33%) or promoted by other agencies, such as TNIAMP and Central SFAC. Regarding turnover, most FPOs (75%) had reported having a turnover of less than 50 lakhs Rupees. A smaller percentage had had turnover values in the ranges of 50-70 lakhs, 70-90 lakhs, 90-130 lakhs, and above 130 lakhs, each accounting for 10-5% of the FPOs. Gender distribution within the FPOs had been skewed, with the majority of members being male (96.66%), while only a small percentage had been female (3.33%).
In terms of education levels, the majority of FPO members had had undergraduate degrees (80%), followed by those with higher secondary education (10%) and postgraduate qualifications (6.66%). Secondary-level education had been represented by 3.33% of the members, while no members had had primary education. When it had come to experience, the distribution had been fairly balanced. A significant portion of FPO members had had 1 year or less of experience (28.33%), while others had had 2 years (35%), 3 years (15%), 4 years (10%), and 5 years or more (11.66%) of experience. In summary, the survey had shed light on various aspects of the surveyed Farmer Producer Organizations, including their age, membership sizes, promoting agencies, turnover, gender distribution, educational qualifications, and experience levels of their members. The results had indicated a diverse landscape of FPOs with varying characteristics and dynamics.
Factors influencing the performance of the FPOs
According to the study conducted by Amitha et al. (2021) [1] , the factors that contributed to the performance of the FPO in the Medak district of Karnataka, with three different promoting institutions, had been analyzed. The study had found that education, group leadership, group communication, and group participation were the most influencing factors. In this study, the factors that influenced the performance of the FPOs, dealing with non-perishable products were identified. .000
Based on the information provided in Table 3.0, it could be understood that the KMO (Kaiser-Meyer-Olkin) statistic value had been 0.845, which was greater than the recommended value of 0.5. This had suggested that the sample size used for the analysis had been sufficient and appropriate. Additionally, Bartlett's test had yielded an approximate chi-square statistic of 975.692 with 59 degrees of freedom, which had been significant at the 0.01 significance level. In simple terms, this had meant that using factor analysis had been a suitable and valid approach for further analyzing the data. The use of principal component analysis (PCA) had helped us understand how factors and variables were connected in the analysis. These connections were called factor loadings and had shown how variables related. However, while factor loadings had helped us understand relationships, they might not have perfectly grouped all variables under their respective factors. Looking at Table 4.0, it had been evident that three components had Eigenvalues greater than one. These three components had explained around 69.159% of the variance in the data. Table 5.0 showed that there were cases where variables were associated with more than one factor. To make sense of how variables should be grouped under specific factors, the components were rotated using a method called varimax rotation with Kaiser Normalization. We can understand from Table 6 that factor loadings were obtained after performing a varimax rotation. Factor loadings of 0.5 or higher are taken into account. The initial component had 6-factor loadings exceeding 0.5, the second component had 5, and the third component had 4, all with eigenvalues surpassing 0.5. These components are given appropriate names based on their factors. It could be inferred from the factor analysis that procuring products at a higher price than the market price, Leadership, aggregation of the product by the FPO, regular Procurement of products from the farmers, sharing the profit, percentage of contribution from value addition of the product were the most influential factors determining the performance of the FPOs dealing with nonperishable products.
| — | Factors | C 1 | C 2 | C 3 |
|---|---|---|---|---|
| 1 | Procuring products at a higher price than the farm gate price | 0.735 | ||
| 2 | The leadership of the CEO & Chairman | 0.724 | ||
| 3 | Aggregation of the product by the FPO | 0.721 | ||
| 4 | Regular Procurement of products from the farmers | 0.707 | ||
| 5 | Providing infrastructures | 0.583 | ||
| 6 | Providing inputs to the farmers | 0.515 | ||
| 7 | Percentage of contribution from value addition of the product | 0.796 | ||
| 8 | Branding | 0.725 | ||
| 9 | Potential to meet all supply with demand | 0.677 | ||
| 10 | No.of. marketing channels followed by the FPOs | 0.581 | ||
| 11 | No. of members selling through FPO | 0.531 | ||
| 12 | Turnover of the FPO | 0.822 | ||
| 13 | Access to credit | 0.743 | ||
| 14 | Transparency in Financial transactions | 0.696 | ||
| 15 | Grants received by the FPO | 0.690 |
Table text extracted from the original PDF; superscript letters are shown inline. The original table image is below.
View original table image
| — | Factors | Component 1 | Component 2 | Component 3 |
|---|---|---|---|---|
| 1 | Procuring products at a higher price than the farm gate price | 0.826 | -.234 | -.226 |
| 2 | The leadership of the CEO & Chairman | 0.801 | -.122 | -.103 |
| 3 | Aggregation of the product by the FPO | 0.797 | 0.073 | -.283 |
| 4 | Regular Procurement of products from the farmers | 0.783 | -.382 | -.039 |
| 5 | Providing infrastructures | 0.760 | 0.150 | -.050 |
| 6 | Providing inputs to the farmers | 0.739 | -.169 | -.010 |
| 7 | Percentage of contribution from value addition of the product | 0.732 | 0.316 | 0.199 |
| 8 | Use digital marketing for branding and sales | 0.731 | 0.131 | -.342 |
| 9 | Potential to meet all supply with demand | 0.725 | 0.512 | 0.155 |
| 10 | No.of. marketing channels followed by the FPOs | 0.722 | -.028 | -.356 |
| 11 | No. of members selling through FPO | 0.703 | -.411 | 0.249 |
| 12 | Turnover of the FPO | 0.699 | 0.540 | -.082 |
| 13 | Access to credit | 0.682 | -.202 | 0.110 |
| 14 | Transparency in Financial transactions | 0.652 | -.288 | 0.323 |
| 15 | Grants received by the FPO | 0.647 | .157 | 0.641 |
Table text extracted from the original PDF; superscript letters are shown inline. The original table image is below.
View original table image
| Component | Initial Eigenvalues | — | — | Extraction sums of squared loadings | — | — |
|---|---|---|---|---|---|---|
| Total | % of Variance | Cumulative % | Total | % of variance | Cumulative % | |
| 1 | 8.060 | 53.733 | 53.733 | 8.060 | 53.733 | 53.733 |
| 2 | 1.263 | 8.422 | 62.155 | 1.263 | 8.422 | 62.155 |
| 3 | 1.051 | 7.004 | 69.159 | 1.051 | 7.004 | 69.159 |
| 4 | .892 | 5.949 | 75.108 | |||
| 5 | .703 | 4.684 | 79.791 | |||
| 6 | .689 | 4.593 | 84.384 | |||
| 7 | .515 | 3.436 | 87.820 | |||
| 8 | .389 | 2.595 | 90.415 | |||
| 9 | .334 | 2.230 | 92.644 | |||
| 10 | .273 | 1.822 | 94.467 | |||
| 11 | .234 | 1.557 | 96.024 | |||
| 12 | .203 | 1.350 | 97.375 | |||
| 13 | .181 | 1.205 | 98.579 | |||
| 14 | .123 | .819 | 99.398 | |||
| 15 | .090 | .602 | 100.000 |
Table text extracted from the original PDF; superscript letters are shown inline. The original table image is below.
View original table image
| Kaiser-Meyer-Olkin Measure of Sampling Adequacy | — | .845 |
|---|---|---|
| Bartlett's Test of Sphericity | Approx. Chi-Square | 975.692 |
| DF | 59 | |
| Sig. | .000 |
Table text extracted from the original PDF; superscript letters are shown inline. The original table image is below.
View original table image
Conclusion
From the study, it could be concluded that three components had been extracted and found to have an Eigenvalue greater than 1. The total variance explained by the study had been 69.159%. It had been concluded from the study operational /functional factors had been the highly influencing factors. Percentage of contribution from value addition of the product, branding, Potential to meet all supply with demand, No. of marketing channels followed by the FPOs, No. of members selling through FPO had been the moderately influencing factors. Turnover of the FPO, Access to credit, and Transparency in Financial transactions, and Grants received by the FPO had been the low influencing factors.
Figures and tables from the paper
| S. No | Particulars | No. of respondents (n=60) | Percentage |
|---|---|---|---|
| 1 | Age of the FPO | ||
| 1 to 3 Years | 2 | 3.33 | |
| 4 to 7 Years | 41 | 68.33 | |
| 8 to 11 Years | 15 | 25.00 | |
| 12 to 15 Years | 1 | 1.67 | |
| above 15 Years | 1 | 1.67 | |
| 2 | Number of members in FPO | ||
| 650 - 900 | 12 | 20.00 | |
| 900 - 1100 | 23 | 38.33 | |
| 1100 - 1250 | 7 | 11.66 | |
| 1250 - 1500 | 16 | 26.66 | |
| Above 1500 | 2 | 3.33 | |
| 3 | Promoting agency of the FPO | ||
| NABARD | 21 | 35.00 | |
| SELF PROMOTED | 8 | 13.33 | |
| TNSFAC | 27 | 45.00 | |
| TNIAMP | 3 | 5.00 | |
| Central SFAC | 1 | 1.67 | |
| 4 | Turnover (Rupees in lakhs) | ||
| Less than 50 | 45 | 75 | |
| 50 – 70 | 6 | 10 | |
| 70 – 90 | 3 | 5 | |
| 90 – 130 | 3 | 5 | |
| Above 130 | 3 | 5 | |
| 5 | Gender | ||
| Male | 58 | 96.66 | |
| Female | 2 | 3.33 | |
| 6 | Number of members in FPO | ||
| Postgraduate | 4 | 6.66 | |
| Undergraduate | 48 | 80 | |
| Higher Secondary | 6 | 10 | |
| Secondary | 2 | 3.33 | |
| Primary | 0 | 0 | |
| 7 | Experience (Years) | ||
| 1 & less than one | 17 | 28.33 | |
| 2 | 21 | 35 | |
| 3 | 9 | 15 | |
| 4 | 6 | 10 | |
| 5 & above | 7 | 11.66 |
Table text extracted from the original PDF; superscript letters are shown inline. The original table image is below.
View original table image
| S. No | Statement |
|---|---|
| 1 | Access to credit |
| 2 | Turnover of the FPO |
| 3 | Providing inputs to the farmers |
| 4 | The leadership of the CEO & Chairman |
| 5 | Regular Procurement of products from the farmers |
| 6 | Aggregation of the product by the FPO |
| 7 | Procuring products at a higher price than the farm gate price |
| 8 | Potential to meet all supply with demand |
| 9 | Use digital marketing for branding and sales |
| 10 | Grants received by the FPO |
| 11 | No.of. marketing channels followed by the FPOs |
| 12 | Transparency in Financial transactions |
| 13 | Percentage of contribution from value addition of the product (Demand analysis) |
| 14 | Providing infrastructures |
| 15 | No. of members selling through FPO |
Table text extracted from the original PDF; superscript letters are shown inline. The original table image is below.
View original table image
| Components | Factor names | Variance explained | Factor loadings | Variables |
|---|---|---|---|---|
| 1 | Operational / Functional Factors | 53.132 | 0.735 | Procuring products at a higher price than the farm gate price |
| 0.724 | The leadership of the CEO & Chairman | |||
| 0.721 | Aggregation of the product by the FPO | |||
| 0.707 | Regular Procurement of products from the farmers | |||
| 0.583 | Providing infrastructures | |||
| 0.515 | Providing inputs to the farmers | |||
| 2 | Marketing Factors | 8.513 | 0.796 | Percentage of contribution from value addition of the product |
| 0.725 | Branding | |||
| 0.677 | Potential to meet all supply with demand | |||
| 0.581 | No. of. marketing channels followed by the FPOs | |||
| 0.531 | No. of members selling through FPO | |||
| 3 | Financial Factors | 7.146 | 0.822 | Turnover of the FPO |
| 0.743 | Access to credit | |||
| 0.696 | Transparency in Financial transactions | |||
| 0.690 | Grants received by the FPO |
Table text extracted from the original PDF; superscript letters are shown inline. The original table image is below.
View original table image
References
4 in the original paper- Amitha CD, Savitha B, Sudha Rani V, Laxminarayana P. Factors contributing to the performance of farmer producer organizations (FPOs)-a study in Medak district of Telangana state. International Journal of Bio-Resource and Stress Management. 2021;12(3):192-198.
- Kumar S, Kumar R, Meena PC, Kumar A. Determinants of Performance and Constraints Faced by Farmer Producer Organizations (FPOs) in India. Indian Journal of Extension Education. 2023;59(2):1-5.
- Kumari N, Bisht K. Identification of Core Competencies for Managing Farmer Producer Organizations Using Factor Analysis. Indian Journal of Extension Education. 2023;59(3):108-112.
- Gagana D, Velmurugan P. Members' Intention to Participate in Farmer Producer Company Activities in the Cauvery Delta Region of Tamil Nadu. Current Agriculture Research Journal. 2023;11:1.