
Research article · 2023 · Full text
International Journal of Advanced Biochemistry ResearchImpact of integrated nutrient management on yield and nutritional value of chickpea (Cicer arietinum L.)
Volume 7(2S) · Pages 118–123 · DOI: 10.33545/26174693.2023.v7.i2sb.198 ↗
Research areasAgronomic Practices and Intercropping SystemsLegume Nitrogen Fixing SymbiosisGenetic and Environmental Crop Studies
Abstract
Author-writtenChickpea (Cicer arietinum L.) is an essential leguminous crop cultivated worldwide due to its nutritional value and economic significance. Integrated Nutrient Management (INM) is a sustainable agricultural approach that combines organic and inorganic fertilizers, crop residues, and other nutrient sources to enhance soil fertility, crop yield, and quality. This research paper aims to investigate the impact of Integrated Nutrient Management on the yield and nutritional value of chickpea, providing valuable insights for sustainable agricultural practices and food security. A field experiment was conducted over two cropping seasons, comparing the conventional nutrient management system with the integrated nutrient management approach. Results from the study demonstrated that integrated nutrient management significantly improved the yield of chickpeas compared to conventional practices. The increased yield was attributed to the judicious combination of nutrients, leading to enhanced plant growth, root development, and overall crop health. Furthermore, the nutritional analysis revealed that the chickpea grown under the integrated nutrient management system exhibited higher concentrations of essential macronutrients (protein, carbohydrates, and dietary fiber) and micronutrients (vitamins and minerals) compared to conventionally managed crops. The enhanced nutritional content signifies the potential of INM to bolster the nutritional quality of chickpeas, which can positively impact human health and dietary diversity. Additionally, the INM approach proved to be environmentally sustainable, as it reduced the dependency on chemical fertilizers and promoted the recycling of organic waste materials, contributing to soil health and fertility.
Summary
Source-checkedPlain-language reading of the full paper, prepared with AI and checked against the text. Each point links to the authors' own words.
Why it matters
- Chickpea is a globally important leguminous crop valued for its economic significance and nutritional properties. View evidence ↗
- Integrated Nutrient Management (INM) is a sustainable method that mixes organic and inorganic fertilizers with crop residues to improve soil fertility and crop quality. View evidence ↗
- The productivity and nutritional value of chickpeas are frequently limited by deficiencies in soil nutrients. View evidence ↗
The question
- The study aims to investigate how Integrated Nutrient Management affects the yield and nutritional value of chickpeas to support food security and sustainable farming. View evidence ↗
What they did
- The researchers conducted a field experiment over two cropping seasons to compare conventional nutrient management with an integrated approach. View evidence ↗
- The experiment took place in Village Bhauwala, Dehradun, during the 2022-23 Rabi season. View evidence ↗
- The study used a randomized design with seven different treatments, each replicated four times. View evidence ↗
- The researchers used the JG-322 chickpea variety, sowing 80 kg per hectare of seeds treated with fungicide, rhizobium, and bioculture. View evidence ↗
What they found
- The highest grain yield of 21.54 q/ha was achieved using a combination of 50% GRD, 5 t/ha vermicompost, and 4 kg/ha PSB, which significantly exceeded the control yield of 12.34 q/ha. View evidence ↗
- Grain production showed an overall increase of 59.0% between T1 and T6 treatments and a 74.5% increase when comparing control to farmer practices. View evidence ↗
- The maximum straw yield was recorded at 32.93 q/ha under treatment T1. View evidence ↗
- Nitrogen concentration in the grain increased from 3.13% in the control group to a peak of 3.4% in the T1 treatment. View evidence ↗
- The T1 treatment resulted in the highest phosphorus concentration in the grain, representing a 12.53% increase over the control's 0.375%. View evidence ↗
- The T7 treatment produced the highest sulfur content, which was 34.29% higher than that of the control group. View evidence ↗
- Protein content in the grain reached its highest level of 22.68% under treatment T7, compared to 19.50% in the control. View evidence ↗
What it means
- The authors conclude that Integrated Nutrient Management is essential for promoting the sustainable cultivation of chickpeas. View evidence ↗
- The authors recommend making INM a regular practice to maintain soil health and ensure a balanced nutrient supply for sustainable production. View evidence ↗
Visual summary
3 visualsIllustrations explain the paper; charts are replotted from the paper's own table values.
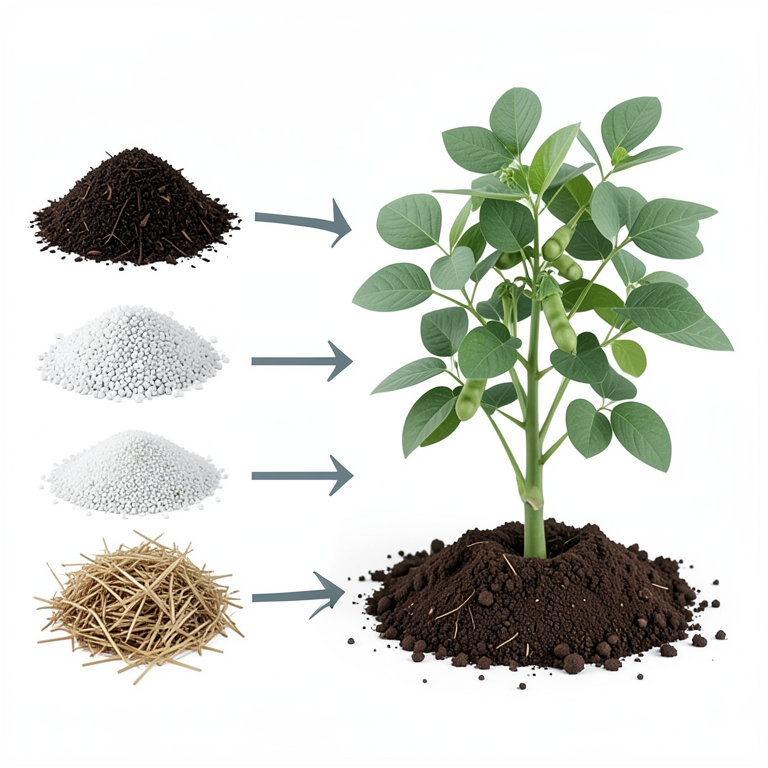
INM Conceptual Framework
AI-generated conceptual illustration (chickpea plants (Cicer arietinum L.)). It explains the idea and does not show study data.
View source evidence ↗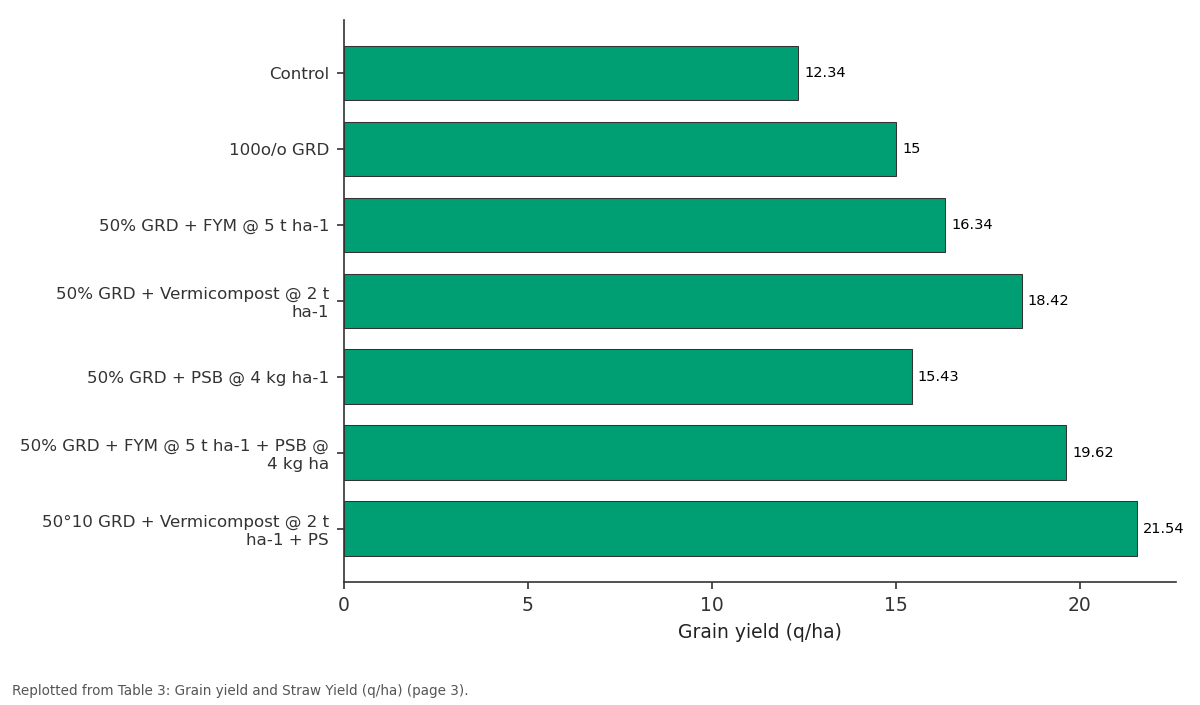
Grain yield (q/ha): Control vs 100o/o GRD vs 50% GRD + FYM @ 5 t ha-1 vs 50% GRD + Vermicompost... vs 50% GRD + PSB @ 4 kg...
Replotted from Table 3 (page 3) of the original paper. Every bar is the paper's own table value.
View source evidence ↗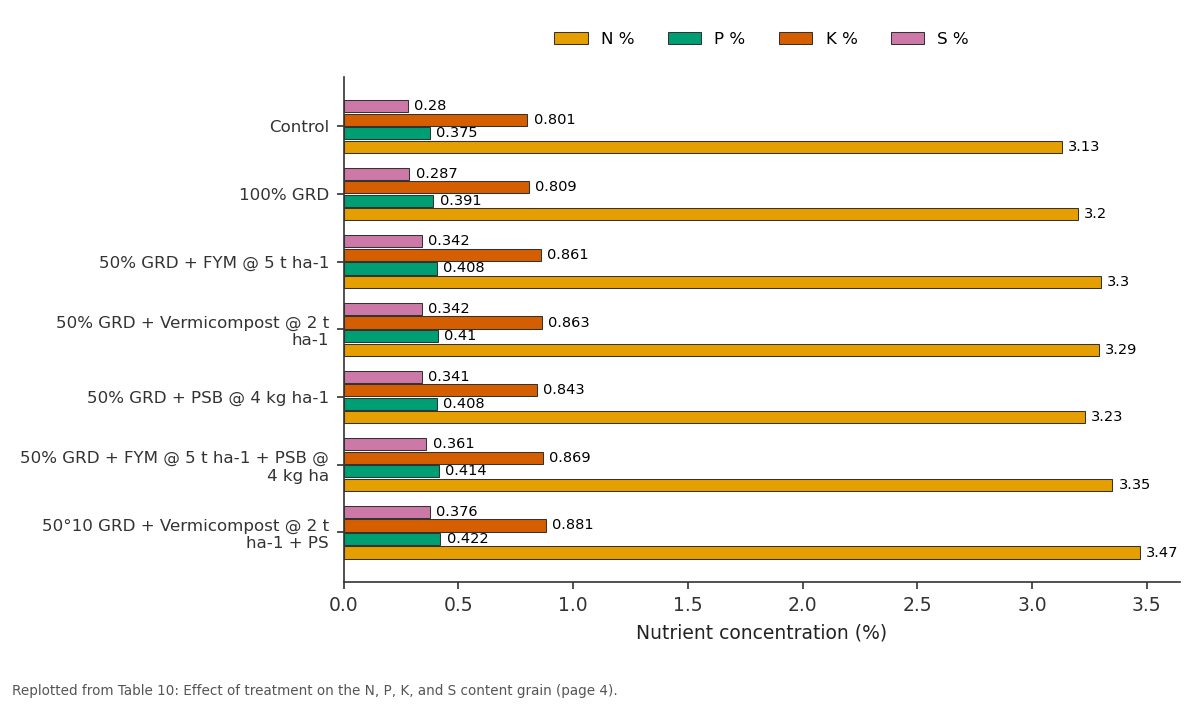
N % and P % and more: Control vs 100% GRD vs 50% GRD + FYM @ 5 t ha-1 vs 50% GRD + Vermicompost... vs 50% GRD + PSB @ 4 kg...
Replotted from Table 10 (page 4) of the original paper. Every bar is the paper's own table value.
View source evidence ↗Figures & tables
From the original paper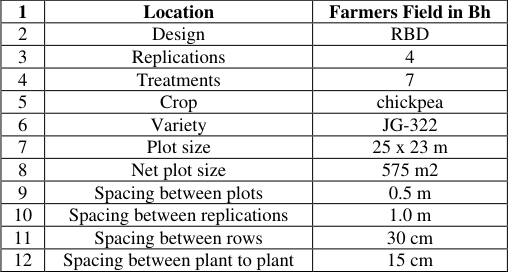 Table 1
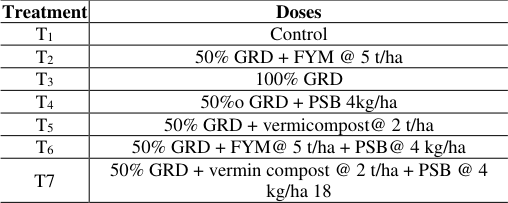 Table 2
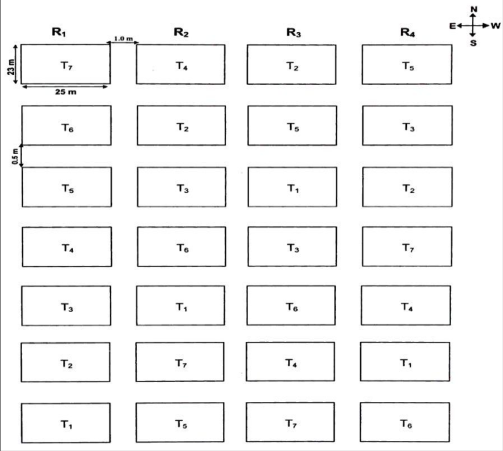 Figure 1
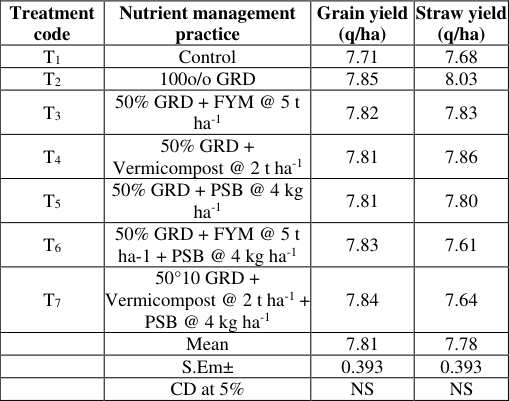 Table 4
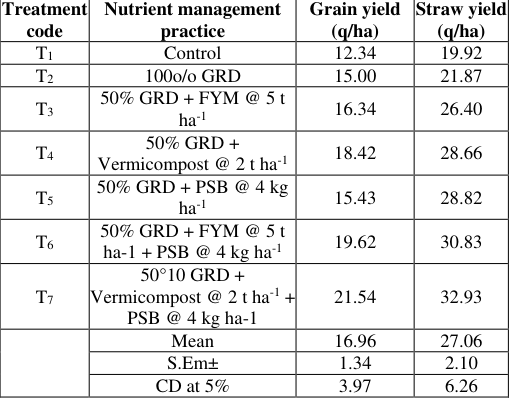 Table 3
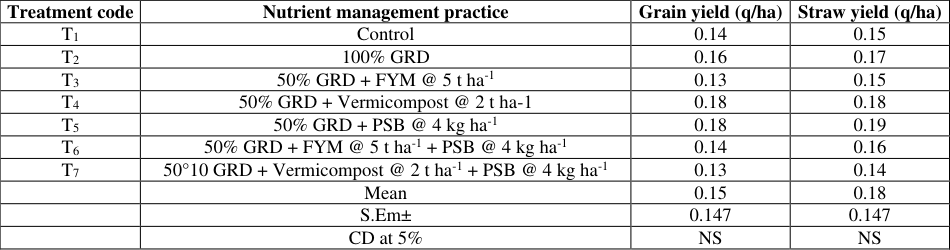 Table 5
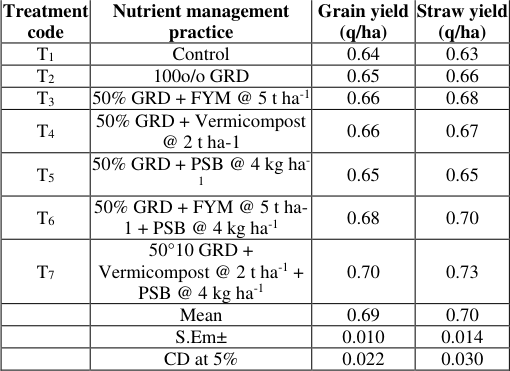 Table 6
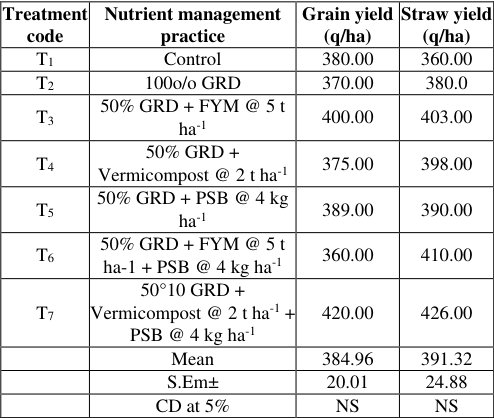 Table 9
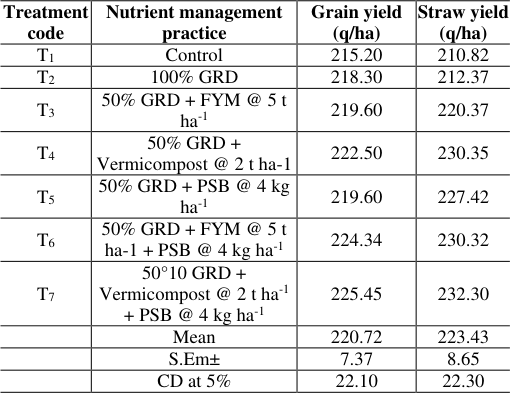 Table 7
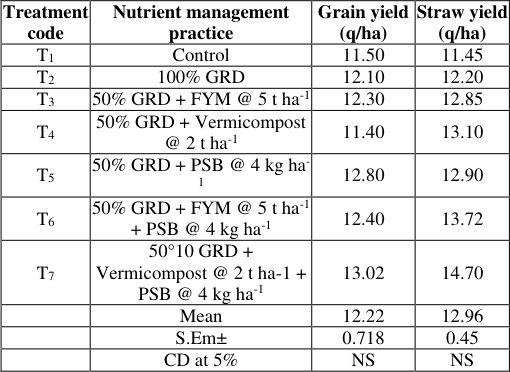 Table 8
 Table 10
 Table 11
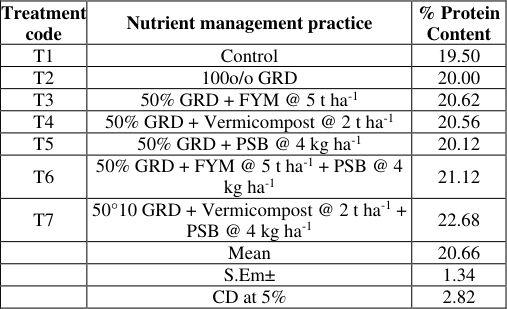 Table 11
Introduction
Chickpea (Cicer arietinum L.) is an essential leguminous crop known for its high nutritional value and vital contribution to global food security. However, its productivity and nutritional content are often constrained by nutrient deficiencies in the soil [1] . To address this issue, integrated nutrient management (INM) practices have gained attention as a sustainable approach to enhance crop productivity while preserving its nutritional value. Pulses have a unique capacity to maintain and restore soil fertility through biological nitrogen fixation because of their extensive root systems and leaf fall. Pulses are an essential dietary source of protein [2,3] . India produces roughly 14.4 million tonnes of pulse grains on a surface area of about 23 million hectares. The chickpea (Cicer arietinum L.), which stands out for its high protein content and adaptability as a food grain, is the most common pulse crop in India's semi-arid tropics. 5.75 million tonnes of land, or 7.1 million hectares, or 30.9 percent of the total area and 39.9 percent of production, are used to grow pulses. Madhya Pradesh is the nation's leading producer of chickpeas, with a yield of 26.6 lakh tonnes/ha and a productivity of 931 kg/ha. There are 28.62 lakh acres on its surface.
Material and Method
The research experiment was conducted under MSSRF Project in Village Bhauwala, Dehradun (latitude 23° 1 o 'N and longitude 79° 57'E, 393 metres above sea level) in Rabi season for one year (2022-23). The soil of the experimental field was sandy loam in texture, poor in fertility in respect of available nitrogen and organic carbon and medium in respect of available phosphorus and available potassium. Soil was slightly alkaline in reaction (pH 7.70).
Experiment Design
The experiment consisted of seven treatments, replicated four folds in randomized design. The details of the layout of experiment are given in (Table 1, 2 and Figure 1). 50% GRD + FYM @ 5 t/ha T3 100% GRD T4 50%o GRD + PSB 4kg/ha T5 50% GRD + vermicompost@ 2 t/ha T6 50% GRD + FYM@ 5 t/ha + PSB@ 4 kg/ha T7 50% GRD + vermin compost @ 2 t/ha + PSB @ 4 kg/ha 18
| 1 | Location | Farmers Field in Bh |
|---|---|---|
| 2 | Design | RBD |
| 3 | Replications | 4 |
| 4 | Treatments | 7 |
| 5 | Crop | chickpea |
| 6 | Variety | JG-322 |
| 7 | Plot size | 25 x 23 m |
| 8 | Net plot size | 575 m2 |
| 9 | Spacing between plots | 0.5 m |
| 10 | Spacing between replications | 1.0 m |
| 11 | Spacing between rows | 30 cm |
| 12 | Spacing between plant to plant | 15 cm |
Table text extracted from the original PDF; superscript letters are shown inline. The original table image is below.
View original table image
Plant sample preparation
In each plot, plant samples were carefully collected within a one-meter area, ensuring uniform productivity. Prior to harvesting chickpeas, the plant samples underwent a drying process in a specialized oven set at 70 °C. Afterwards, the samples were divided into separate grain and straw components.
Pre-sowing operations
In this particular experiment, a tractor was initially employed to create a well-prepared seed bed. Subsequently, a power tiller was utilized to further cultivate the soil by efficiently mixing and dispersing the dirt. The manures and fertilizers were then carefully measured and evenly spread across each designated area following the given instructions. On November 30, 2022, the crop planting phase commenced, where 80 kg per hectare of specially treated JG-322 chickpea seeds, enriched with bioculture, rhizobium, and fungicide, were sown.
Nitrogen content evaluation
The Nitrogen concentration is determined using the wet method, following the instrument analysis approach described in KELPOL's work from 1965 and AOAC's guidelines from 1965 [4,5] . The procedure involves taking 1 gram of plant material (either straw or seeds) and mixing it with 100 ml of a digestion solution in a flask. The digestion solution contains potassium and copper sulphates in a 1:5 ratio and is added to the flask in varying amounts between 2 to 5 grams. Additionally, 10 ml of concentrated hydrochloric acid (H2SO4) is added to the flask, and the mixture is allowed to stand until it becomes clear. After cooling, the volume is adjusted to 100 ml. To initiate the distillation process, a 10 ml sample of the digestion liquid is taken and added to a separate distillation flask. Subsequently, 10 cc of sodium hydroxide (NaOH) is added. The liberated ammonia is collected in another flask containing methyl red, two drops of bromo-chloroacetic acid, and 10 ml of 2% boric acid. To ensure the complete expansion of ammonia before colour development, the distillation process is extended by an extra five minutes. Furthermore, in the acidic plant extract solution, vanadomolybdate reacts with orthophosphates, forming a yellow complex that can be used to develop a yellow colour indicative of phosphoric content. The transmittance (or absorbance) of the solution at 420 nm is measured using a spectrophotometer, following the method established by Koening and Johnson in 1942. Potassium content in the diet was tested using a Digi table flame thermometer, as outlined by Black in 1965 [4] .
Sulphur content evaluation
Barium sulphate precipitate's turbidity was measured using a turbidometer, and the solution's absorbance (or transmittance) at 420 nm was calculated using turbidimetry (Bardsley and Lancaster, 1960) [5] .
Organic carbon content evaluation
The rapid titration technique was used to find the organic carbon. It was created in 1934 by Walkely and Black, and Piper reported it in 1950 [6] .
Phosphorus content evaluation
With the help of a technique similar to that described by Orsen et al. (1954), the phosphorus content of soil was extracted. With the aid of 0.5 m NaHC03 (PH 8.5), the phosphorus is eliminated from the soil. Ascorbic acid is used to calculate transmittance. Miller and Keeney established the 1982 theory behind blue colour transmittance and absorption. The spectrophotometer with a 660 nm wavelength is ready after ten minutes [7,8] .
Potassium content evaluation
By adding neutral normal ammonium acetate and measuring with a flame photometer, the amount of potassium that was made available was calculated [8] .
Statistical analysis of the test results
The statistical study of grain and straw yield statistics resulted in the Panse (1970) and Sukhatme technique containing analytical data on the soil and plant [9] .
Result
This study was covered under the Dehradun Town Bhauwala Facilitated Supplement. The leaders for Chickpea (MSSRF) project, which is still in process [10] . In a farmer's field, a chickpea crop was had a go at using seven remarkable treatment mixes. Comparative medications (a blend of inorganic and normal composts) were used in the assessment close by a piece that is regularly energized and an absolute control. The survey's critical goal was to evaluate the impact of consolidated supplement the chiefs (IFM) on the sound advantage and production of chickpeas [11] . The yield, protein content, and dietary advantage of grain, straw, and basic soil parts are quantifiably summarized in (Table 3 -11). Table 3 clearly demonstrates how different treatments affect the yield of chickpeas. When compared to the control or farmers' practice (FP), the introduction of FYM, vermicompost, and PSB consistently increases yields.
| Treatment code | Nutrient management practice | Grain yield (q/ha) | Straw yield (q/ha) |
|---|---|---|---|
| T1 | Control | 12.34 | 19.92 |
| T2 | 100o/o GRD | 15.00 | 21.87 |
| T3 | 50% GRD + FYM @ 5 t ha-1 | 16.34 | 26.40 |
| T4 | 50% GRD + Vermicompost @ 2 t ha-1 | 18.42 | 28.66 |
| T5 | 50% GRD + PSB @ 4 kg ha-1 | 15.43 | 28.82 |
| T6 | 50% GRD + FYM @ 5 t ha-1 + PSB @ 4 kg ha-1 | 19.62 | 30.83 |
| T7 | 50°10 GRD + Vermicompost @ 2 t ha-1 + PSB @ 4 kg ha-1 | 21.54 | 32.93 |
| Mean | 16.96 | 27.06 | |
| S.Em± | 1.34 | 2.10 | |
| CD at 5% | 3.97 | 6.26 |
Table text extracted from the original PDF; superscript letters are shown inline. The original table image is below.
View original table image
Effect of various INM methods on the production of chickpea grains and straw
Treatment T 1 , with 50% GRD, 5 t vermicompost/ha, and 4 kg PSB/ha, resulted in the highest yield of 21.54 q/ha, significantly surpassing the control's yield of 12.34 q/ha. The test plot (25×23 m 2 ) also showed a significant treatment influence on both grain and straw yields. Treatment T 1 produced the most straw at 32.93 q/ha, while grain yields ranged from 12.34 to 21.54 q/ha across different treatments [12] . Overall, grain production increased by 59.0% from T 1 to T 6 treatments and by 74.5% when compared to the improvement from control to farmer practices. Similarly, straw production showed notable growth across treatments. Regarding soil pH, most treatments had minimal impact on pH levels. However, T 2 treatment did affect the soil pH, reducing it from an initial range of 7.71-7.85 to 7.61-8.03 after harvest. The overall decrease in pH was by 0.03 units.
Effect of treatments on soil EC
Despite a slight deviation of 0.04 Dsm -1 from the fundamental value, the soil electrical conductivities during the hidden and post-harvest stages remained largely undefined. Examining the data presented in Table 5, it becomes apparent that the early phase variance in the equation at the post-accumulate level was found to be negligible. The initial stage equation yielded values ranging from 0.13 to 0.18, while the post-accumulate equation ranged from 0.14 to 0.19 Dsm -1 . The mean values for the initial stage and post-procure level were 0.15 and 0.18 Dsm-1, respectively. The electrical conductivity increased by 2% between the sample and end typical readings, indicating a minor change in the overall trend.
| Treatment code | Nutrient management practice | Grain yield (q/ha) | Straw yield (q/ha) |
|---|---|---|---|
| T1 | Control | 0.14 | 0.15 |
| T2 | 100% GRD | 0.16 | 0.17 |
| T3 | 50% GRD + FYM @ 5 t ha-1 | 0.13 | 0.15 |
| T4 | 50% GRD + Vermicompost @ 2 t ha-1 | 0.18 | 0.18 |
| T5 | 50% GRD + PSB @ 4 kg ha-1 | 0.18 | 0.19 |
| T6 | 50% GRD + FYM @ 5 t ha-1 + PSB @ 4 kg ha-1 | 0.14 | 0.16 |
| T7 | 50°10 GRD + Vermicompost @ 2 t ha-1 + PSB @ 4 kg ha-1 | 0.13 | 0.14 |
| Mean | 0.15 | 0.18 | |
| S.Em± | 0.147 | 0.147 | |
| CD at 5% | NS | NS |
Table text extracted from the original PDF; superscript letters are shown inline. The original table image is below.
View original table image
Effects of treatment on the N, P, K, S content in grain
The nitrogen concentration of the treatments varied significantly when the grain was harvested. The lowest nitrogen content in the control was 3.13%. The highest Nitrogen concentration 3.4% (7%) was seen in the T 1 therapy. T 1 therapy includes 505 of the GRD.
Vermicompost was added to 50% of the GRD and 5% of the total PSB (4 kg ha-1). T 7 showed increase of 10.86 °C, over T 1 , 8.44 °C, over T 2 and 5.15 °C, over T3 when 50% of GRD +5% of FYM ha were added.
The data presented in Table 10 demonstrates that all treated plots exhibited significantly higher phosphorus accessibility in the grain stage compared to untreated plots. The difference in phosphorus content between the IPNS prescriptions was approximately 0.375 to 0.422%. Notably, the grain from the T1 treatment had the highest phosphorus concentration, with an increase of 12.53 percent compared to the control grain with 0.375 percent phosphorus [13] .
| Treatment code | Nutrient management practice | N % | P % | K % | S % |
|---|---|---|---|---|---|
| T1 | Control | 3.130 | 0.375 | 0.801 | 0.280 |
| T2 | 100% GRD | 3.200 | 0.391 | 0.809 | 0.287 |
| T3 | 50% GRD + FYM @ 5 t ha-1 | 3.300 | 0.408 | 0.861 | 0.342 |
| T4 | 50% GRD + Vermicompost @ 2 t ha-1 | 3.290 | 0.410 | 0.863 | 0.342 |
| T5 | 50% GRD + PSB @ 4 kg ha-1 | 3.230 | 0.408 | 0.843 | 0.341 |
| T6 | 50% GRD + FYM @ 5 t ha-1 + PSB @ 4 kg ha-1 | 3.350 | 0.414 | 0.869 | 0.361 |
| T7 | 50°10 GRD + Vermicompost @ 2 t ha-1 + PSB @ 4 kg ha-1 | 3.470 | 0.422 | 0.881 | 0.376 |
Table text extracted from the original PDF; superscript letters are shown inline. The original table image is below.
View original table image
Regarding the impact of treatments on grain potassium content, the results in Table 8 indicate considerable variation. The average potassium content was found to be 0.847 percent, ranging from 0.801 to 0.881 percent. The highest potassium concentration was observed in the T 1 grain, which was 9.99 percent higher than the control. Furthermore, T 3 outperformed T 2 in terms of potassium content in the grain. Examining the effects of treatments on grain sulfur content, the data in Table 8 reveals that fully treated plots experienced a significant and consistent increase in sulfur content. The sulfur content ranged from 0.280 to 0.376%, with an average value of 0.333%. Notably, the T 7 treatment had the highest sulphur content, showing a remarkable 34.29% increase compared to the control. 50% GRD + FYM @ 5 t ha -1 20.62 T4 50% GRD + Vermicompost @ 2 t ha -1 20.56 T5 50% GRD + PSB @ 4 kg ha -1 20.12 T6 50% GRD + FYM @ 5 t ha -1 + PSB @ 4 kg ha -1 21.12 T7 50°10 GRD + Vermicompost @ 2 t ha -1 + PSB @ 4 kg ha The crude protein factor has been multiplied in order to calculate the protein content of crops. The reserve protein in seeds may be considerably increased using a variety of techniques. While agricultural practices had the lowest protein concentrations, high-yield treatments including FYM, Vermicompost, and PSB had the highest protein concentrations. The protein level in the control was substantially higher at 21.68 percent compared to these treatments. The conclusion was a 2.56, 5.74, 5.44, 3.18, 8.31, and 16.31 percent rise in protein concentrations. 20.66% of the protein was, on average.
| Treatment code | Nutrient management practice | Grain yield (q/ha) | Straw yield (q/ha) |
|---|---|---|---|
| T1 | Control | 11.50 | 11.45 |
| T2 | 100% GRD | 12.10 | 12.20 |
| T3 | 50% GRD + FYM @ 5 t ha-1 | 12.30 | 12.85 |
| T4 | 50% GRD + Vermicompost @ 2 t ha-1 | 11.40 | 13.10 |
| T5 | 50% GRD + PSB @ 4 kg ha- 1 | 12.80 | 12.90 |
| T6 | 50% GRD + FYM @ 5 t ha-1 + PSB @ 4 kg ha-1 | 12.40 | 13.72 |
| T7 | 50°10 GRD + Vermicompost @ 2 t ha-1 + PSB @ 4 kg ha-1 | 13.02 | 14.70 |
| Mean | 12.22 | 12.96 | |
| S.Em± | 0.718 | 0.45 | |
| CD at 5% | NS | NS |
Table text extracted from the original PDF; superscript letters are shown inline. The original table image is below.
View original table image
Acknowledgement
AcknowledgementThe authors acknowledge the technical support received from the School of Agriculture, Dev Bhoomi Uttarakhand.
Figures and tables from the paper
| Treatment | Doses |
|---|---|
| T1 | Control |
| T2 | 50% GRD + FYM @ 5 t/ha |
| T3 | 100% GRD |
| T4 | 50%o GRD + PSB 4kg/ha |
| T5 | 50% GRD + vermicompost@ 2 t/ha |
| T6 | 50% GRD + FYM@ 5 t/ha + PSB@ 4 kg/ha |
| T7 | 50% GRD + vermin compost @ 2 t/ha + PSB @ 4 kg/ha 18 |
Table text extracted from the original PDF; superscript letters are shown inline. The original table image is below.
View original table image
| Treatment code | Nutrient management practice | Grain yield (q/ha) | Straw yield (q/ha) |
|---|---|---|---|
| T1 | Control | 7.71 | 7.68 |
| T2 | 100o/o GRD | 7.85 | 8.03 |
| T3 | 50% GRD + FYM @ 5 t ha-1 | 7.82 | 7.83 |
| T4 | 50% GRD + Vermicompost @ 2 t ha-1 | 7.81 | 7.86 |
| T5 | 50% GRD + PSB @ 4 kg ha-1 | 7.81 | 7.80 |
| T6 | 50% GRD + FYM @ 5 t ha-1 + PSB @ 4 kg ha-1 | 7.83 | 7.61 |
| T7 | 50°10 GRD + Vermicompost @ 2 t ha-1 + PSB @ 4 kg ha-1 | 7.84 | 7.64 |
| Mean | 7.81 | 7.78 | |
| S.Em± | 0.393 | 0.393 | |
| CD at 5% | NS | NS |
Table text extracted from the original PDF; superscript letters are shown inline. The original table image is below.
View original table image
| Treatment code | Nutrient management practice | Grain yield (q/ha) | Straw yield (q/ha) |
|---|---|---|---|
| T1 | Control | 0.64 | 0.63 |
| T2 | 100o/o GRD | 0.65 | 0.66 |
| T3 | 50% GRD + FYM @ 5 t ha-1 | 0.66 | 0.68 |
| T4 | 50% GRD + Vermicompost @ 2 t ha-1 | 0.66 | 0.67 |
| T5 | 50% GRD + PSB @ 4 kg ha- 1 | 0.65 | 0.65 |
| T6 | 50% GRD + FYM @ 5 t ha- 1 + PSB @ 4 kg ha-1 | 0.68 | 0.70 |
| T7 | 50°10 GRD + Vermicompost @ 2 t ha-1 + PSB @ 4 kg ha-1 | 0.70 | 0.73 |
| Mean | 0.69 | 0.70 | |
| S.Em± | 0.010 | 0.014 | |
| CD at 5% | 0.022 | 0.030 |
Table text extracted from the original PDF; superscript letters are shown inline. The original table image is below.
View original table image
| Treatment code | Nutrient management practice | Grain yield (q/ha) | Straw yield (q/ha) |
|---|---|---|---|
| T1 | Control | 380.00 | 360.00 |
| T2 | 100o/o GRD | 370.00 | 380.0 |
| T3 | 50% GRD + FYM @ 5 t ha-1 | 400.00 | 403.00 |
| T4 | 50% GRD + Vermicompost @ 2 t ha-1 | 375.00 | 398.00 |
| T5 | 50% GRD + PSB @ 4 kg ha-1 | 389.00 | 390.00 |
| T6 | 50% GRD + FYM @ 5 t ha-1 + PSB @ 4 kg ha-1 | 360.00 | 410.00 |
| T7 | 50°10 GRD + Vermicompost @ 2 t ha-1 + PSB @ 4 kg ha-1 | 420.00 | 426.00 |
| Mean | 384.96 | 391.32 | |
| S.Em± | 20.01 | 24.88 | |
| CD at 5% | NS | NS |
Table text extracted from the original PDF; superscript letters are shown inline. The original table image is below.
View original table image
| Treatment code | Nutrient management practice | Grain yield (q/ha) | Straw yield (q/ha) |
|---|---|---|---|
| T1 | Control | 215.20 | 210.82 |
| T2 | 100% GRD | 218.30 | 212.37 |
| T3 | 50% GRD + FYM @ 5 t ha-1 | 219.60 | 220.37 |
| T4 | 50% GRD + Vermicompost @ 2 t ha-1 | 222.50 | 230.35 |
| T5 | 50% GRD + PSB @ 4 kg ha-1 | 219.60 | 227.42 |
| T6 | 50% GRD + FYM @ 5 t ha-1 + PSB @ 4 kg ha-1 | 224.34 | 230.32 |
| T7 | 50°10 GRD + Vermicompost @ 2 t ha-1 + PSB @ 4 kg ha-1 | 225.45 | 232.30 |
| Mean | 220.72 | 223.43 | |
| S.Em± | 7.37 | 8.65 | |
| CD at 5% | 22.10 | 22.30 |
Table text extracted from the original PDF; superscript letters are shown inline. The original table image is below.
View original table image
| — | Mean | 3.290 | 0.404 | 0.847 | 0.333 |
|---|---|---|---|---|---|
| S.Em± | 0.06 | 0.007 | 0.015 | 0.013 | |
| CD at 5% | 0.201 | 0.020 | 0.045 | 0.039 |
Table text extracted from the original PDF; superscript letters are shown inline. The original table image is below.
View original table image
| Treatment code | Nutrient management practice | % Protein Content |
|---|---|---|
| T1 | Control | 19.50 |
| T2 | 100o/o GRD | 20.00 |
| T3 | 50% GRD + FYM @ 5 t ha-1 | 20.62 |
| T4 | 50% GRD + Vermicompost @ 2 t ha-1 | 20.56 |
| T5 | 50% GRD + PSB @ 4 kg ha-1 | 20.12 |
| T6 | 50% GRD + FYM @ 5 t ha-1 + PSB @ 4 kg ha-1 | 21.12 |
| T7 | 50°10 GRD + Vermicompost @ 2 t ha-1 + PSB @ 4 kg ha-1 | 22.68 |
| Mean | 20.66 | |
| S.Em± | 1.34 | |
| CD at 5% | 2.82 |
Table text extracted from the original PDF; superscript letters are shown inline. The original table image is below.
View original table image
References
15 in the original paper- Abdul Basir, Khan Zada, Shah Z. Effect of phosphorous and farmyard manure on nitrogen nutrition. Sarhad Journal Agriculture. 2005;21(2):11-19.
- Arya S, Kumar R, Prakash O, Kumar S, Mahawer SK, Chamoli S, et al. Chemical composition and biological activities of Hedychium coccineum Buch.-Ham. Ex Sm. essential oils from Kumaun hills of Uttarakhand. Molecules. 2022;27(15):4833.
- Arya S, Mahawer SK, Karakoti H, Kumar R, Prakash O, Kumar S, et al. Study of the Variability of the Chemical Profile, and Biological Activity Approaches of Hedychium coronarium J. Koenig Essential Oil from Different Habitats of Uttarakhand, India. Journal of Food Quality. 2023..
- Chandra R. Response and economics of Rhizobium, Phosphorus and Zinc application in gram. Legume Research. 1995, 1965;18(2):103-108.
- Bardsley CE, Lancaster JD. Determination of reserve sulfur and soluble sulfates in soils. Soil Science Society of America Journal. 1960;24(4):265-268.
- Dixit JP, Pandey RP, Namdeo KN. Influence of phosphatic fertilizer on Bengal gram. Madras Agricultural Journal. 1983;70(7):478-479.
- Dubey SK, Shrivastava SK. Response of Soybean of microbial inoculants. Bhartiya Krishi Anusandhan Patrika. 1991;6(4):202-206.
- Ghosh BN, Ved Prakash, Singh RD. Yield response and nutrient use efficiency on soybean wheat system in long term manorial experiment. Proc. National workshop long-term fertility management through integrated nutrient supply system. Indian I NSTT. Soil Sci Bhopal. 1998, 27-282.
- Gupta SC. Effect of combined inoculation on nodulation, nutrient uptake and yield of chickpea in vertisol. Journal of the Indian Society of Soil Science. 2006;54(2):251-254.
- Hulugalle NR, Enturistle PC, Cooper JL, Scott F, Nehl DB, Allen SJ, et al. Sowing wheat or field peas as rotation crops after irrigation cotton in a grey vertisol. Australian J Soil Res. 1999;37(5):867-889.
- Jain LK, Pushpendra Singh. Growth and nutrient uptake of chickpea as influenced by biofertilizer and phosphorous nutrition. Crop Res. 2003;25(3):41:413. 60.
- Kanwar K, Pariyal SS. Influence of phosphorous management and organic manuring on uptake and yield of chickpea. Annals of Agril. 2002;28(4):642-645.
- Kumpawat BS, Manohar SS. Response of gram to bacterial inoculation, P and micronutrients. Madras Agric. J. 1994;61(7):397-398.
- Lindsay WL, Norvell WA. Micronutrient soil test for Zn, Cu, Fe, Mn, Agron, 84. Mac Taggart. Effect of potash levels and method of application on the yield of gram. Madras Agril. Journal. 1969;70(8):537-538.
- Prasad R, Singh RP, Roy HK, Sinha H. Effect of fertilizer, lime and manure on some physical and chemical properties of a red loam soil under multiple cropping. J Indian Soc. Soil Sci. 1983;31:601-603.
Cited by 3
From OpenAlex, OpenCitations and reference lists read by Scinovex
- Synergistic effects of bio-stimulant and nutrient application on growth, yield, and grain quality of chickpea ( Cicer arietinum L.) grown under rain-fed environment ↗
Muhammad Awais Bashir Khan, Abdul Ghafoor, Muhammad Asif, Muhammad Mazhar Iqbal, Muhammad Munir, Babiker M. A. Abdel‐Banat et al. · RSC Advances · 2026
, NPK (16 : 18 : 18) @ 3%, and B @ 0.2% + Zn @ 0.3% solution, as an effective strategy for improving productivity and nutritional quality of chickpea under rain-fed environment.
❝ 1PDF - Integrated phosphorus, rhizobium, Vermicompost, and biostimulant management enhances growth, nodulation, yield, and grain quality of chickpea (Cicer Arietinum L)
Rishi Raj, Ravikesh Kumar Pal, Mandeep Maurya, Harshit Verma, Prithvi Raj · International Journal of Research in Agronomy · 2026
A field experiment was conducted to evaluate the effect of phosphorus levels integrated with Rhizobium inoculation, vermicompost and bio-stimulant application on growth, nodulation, yield attributes and grain quality of chickpea (Cicer arietinum L.). The experiment consisted of eleven treatments involving different phosphorus levels (30, 45 and 60 kg P₂O₅ ha⁻¹) combined with Rhizobium, vermicompost and bio-stimulant under randomized block design conditions. The results indicated significant improvement in growth, nodulation, yield and quality parameters under integrated nutrient management tre
- Yield and nutrient uptake in maize and chickpea cropping sequences as influenced by integrated nutrient management practices ↗
Vinaykumar B.B., S. L. Patil, C. R. Patil, M. S. Venkatesh, M. N. Ramesha, Salma . et al. · Research Square · 2026
❝ 0PDF