
Research article · 2023 · Full text
International Journal of Statistics and Applied MathematicsFar field tsunami simulation using an open boundary condition from an extended domain
Volume 8(2) · Pages 51–56 · DOI: 10.22271/maths.2023.v8.i2a.946 ↗
Research areasearthquake and tectonic studiesQuantum Chromodynamics and Particle InteractionsTropical and Extratropical Cyclones Research
Abstract
Author-writtenThis study assesses the simulation of far field tsunami from an extended domain along the coastal belt of Southern Thailand and the west coast of Peninsular Malaysia using a formulated open boundary condition. The vertically integrated depth averaged shallow water equations are solved numerically in two different model domains. Along with the original domain (OD) an extended domain (ED) is considered during the simulation process. Using the method of lines technique, linear shallow water equations (SWE) are solved in the original domain and the extended domain all together to simulate the response of the tsunami source in the western side of the open boundary of the original model domain. A tsunami source similar to 2004 Indian Ocean Tsunami is considered as an initial condition for this boundary value problem. The ED is extended up to 2000 km from the coast. The non-linear shallow water equations are solved in the original domain where the tsunami source was omitted. In the original domain, a boundary condition is used which was formulated by the amplitude of the source in the extended domain and the formulated boundary condition was imposed at west boundary of the OD to compute tsunami response in absence of original tsunami source. Finally, the effect of the formulated boundary condition was simulated in the coastal belt of the south part of Thailand and the west coast of the Peninsular Malaysia. Tsunami travelled time and water elevation for different coastal location are stimulated by the two models. The outputs of this study are compared with the available data in the USGS website, and a very reasonable agreement is observed.
Summary
Source-checkedPlain-language reading of the full paper, prepared with AI and checked against the text. Each point links to the authors' own words.
Why it matters
- Tsunamis are highly destructive natural hazards that can cause significant damage to both nearby and distant coastlines. View evidence ↗
- Effective warning systems are critical for reducing the loss of life and property caused by tsunami hazards. View evidence ↗
- Developing real-time models for far-field tsunamis is a key but challenging requirement for improving warning systems. View evidence ↗
The question
- The study aims to evaluate the simulation of far-field tsunamis affecting Southern Thailand and Peninsular Malaysia using a specific formulated open boundary condition. View evidence ↗
What they did
- The researchers used vertically integrated depth-averaged shallow water equations solved across two domains: an original domain (OD) and an extended domain (ED). View evidence ↗
- The original domain was a rectangular area (2°N–14°N, 91°E–100.5°E) using a 4 km grid with 230 x 319 grid points. View evidence ↗
- The extended domain was designed to reach approximately 2000 km from the coast and 1100 km west of the original domain's boundary. View evidence ↗
- The Method of Lines (MOL) was employed as the numerical scheme to solve both linear and non-linear shallow water equations. View evidence ↗
What they found
- Using the linear model with an extended source, the tsunami appeared at Phuket between 195 and 210 minutes and arrived at Penang at approximately 330 minutes. View evidence ↗
- The non-linear model using the formulated boundary condition calculated travel times of approximately 130 minutes for Phuket and 260 minutes for Penang. View evidence ↗
- The non-linear model estimated maximum water levels of 7–7.5 m for Phuket and 3–3.5 m for Penang. View evidence ↗
- Computed maximum water levels (3–4 m for Penang, 6–8 m for Phuket) showed reasonable agreement with USGS data (2.0–3.5 m for Penang, 7–11 m for Phuket). View evidence ↗
- The time histories generated by the formulated boundary condition almost matched those generated by the actual source in the extended domain. View evidence ↗
What it means
- The authors conclude that dividing large domains into blocks and using formulated boundary conditions can save CPU time and memory, contributing to the development of tsunami warning systems. View evidence ↗
Visual summary
1 visualsIllustrations explain the paper; they do not show study data.
Domain Configuration
AI-generated conceptual illustration (Tsunami waves in a coastal ocean basin). It explains the idea and does not show study data.
View source evidence ↗Figures & tables
From the original paper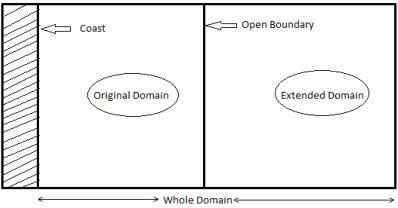 Figure 1
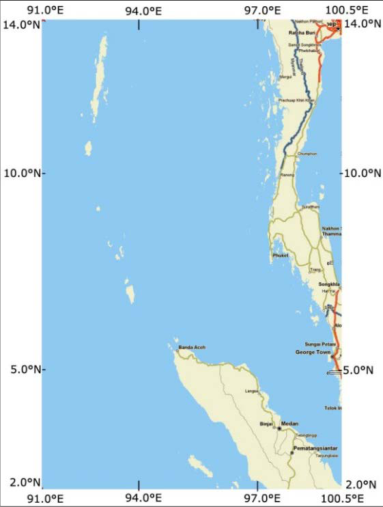 Figure 2
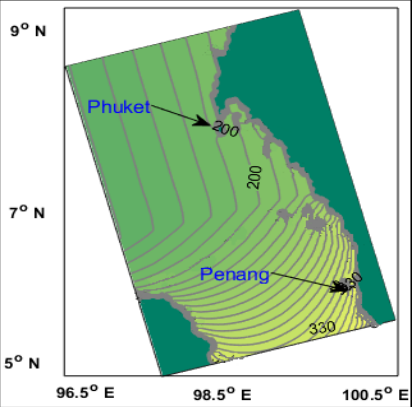 Figure 3
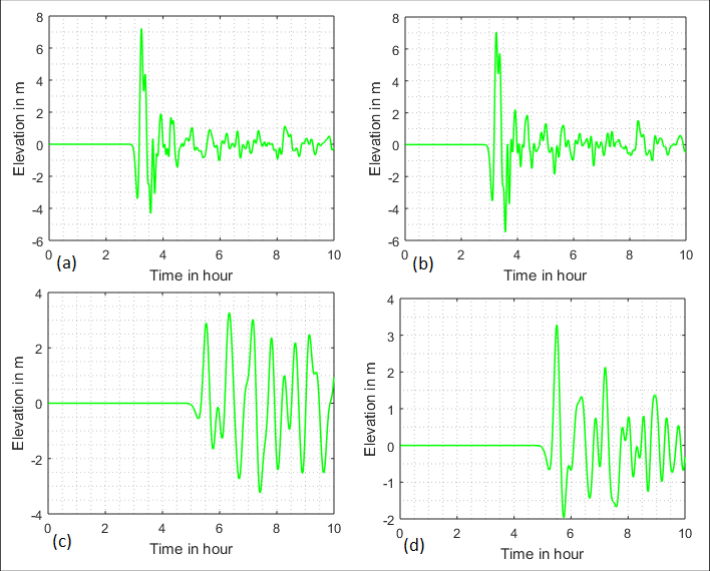 Figure 4
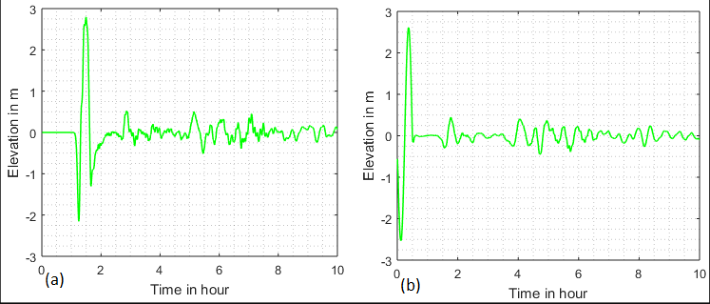 Figure 5
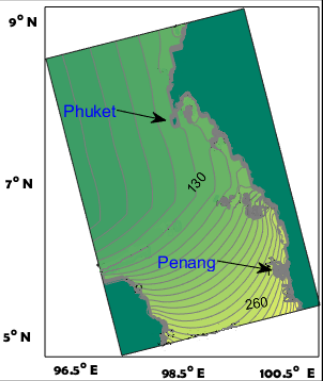 Figure 6
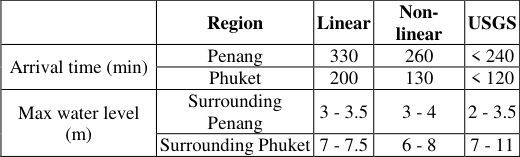 Table 1
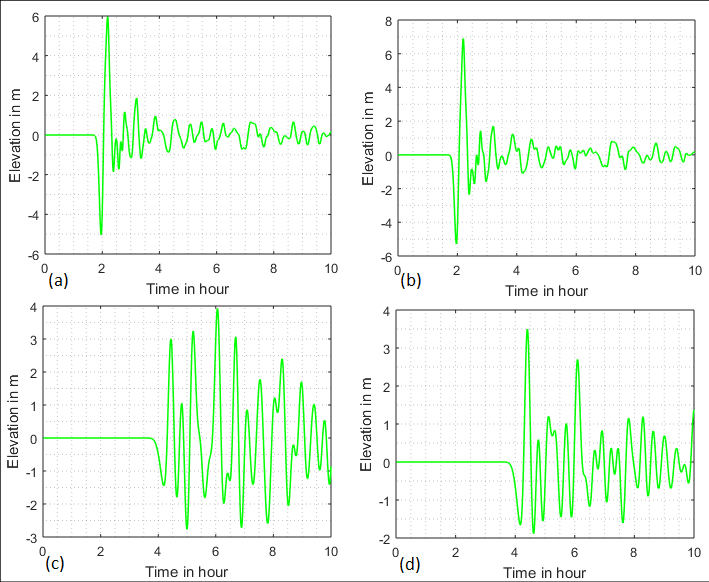 Figure 7
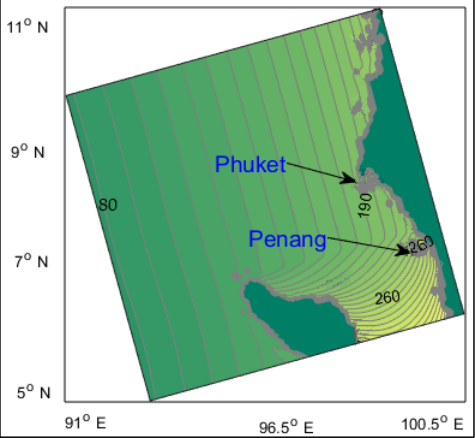 Figure 8
Introduction
Tsunami is one of the most explosive natural vulnerabilities causes damaging on both shores of bordering countries and also on shores of more distant countries of the glove. Local tsunamis affect limited coastlines close to the generating area and may be quit severe. But far field tsunami or distant tsunami may affect shoreline's far away from the source zone. Due to the great danger of the tsunami hazard, an accurate and effective warning system is required to minimize the loss of life and assets along the coastal belts. Real time tsunami modeling for distant or far-field tsunami is a challenging and important problem for the development of tsunami warning system. Numerical modeling is a strong method for understanding tsunami's actions and for forecasting their impacts on coastal areas. Many researchers, (Meah et al., 2016; Meah et al., 2012; Roy et al., 2006) [4,5,7] put their findings on tsunami run-up modeling for far field tsunami in a narrow area model domain. In those models, tsunami source zone were kept inside the model domain. In this research, an extended domain is considered which is elongated approximately 2000 km from the coast. So, there are two domains to be considered, Original Domain (OD) and Extended Domain (ED). So the whole domain is divided into two blocks so that it is easy to calculate the tsunami travel time and water elevation along some particular coastal belts. This technique will help to reduce the CPU calculation time and to save computer memory. There is no significance of the convective terms in the governing equations in deep ocean for computing tsunami travel time. However, near the coastal area, the nonlinear terms are blandly significant for the wave amplitude. Thus, a linear model has been applied for tsunami propagation in the deep sea and a non-linear model has been applied to calculate water level close to the coast (Meah et al., 2017) [3] . The benefit of the uses a linear model is that it is less expensive in terms of memory and calculation time as the convective terms have been ignored from the model. But the non-linear model is essential to compute the tsunami phenomena in the nearby coastal region. Two models are developed which will be simulated in the original domain and the whole domain. The linear SWE's are solved in the whole domain by using the method of lines technique to simulate the effect of tsunami source in the western open boundary of the original domain. During this simulation a fictitious tsunami source similar to 2004 Indian Ocean tsunami is used which is approximately 2000km away from the coast. The non-linear SWE's are solved in the original domain where the tsunami source was omitted. Instead of using the tsunami source a formulated boundary condition was applied to simulate tsunami run-up and travel time along the said coastal belts. During the formulation of the open boundary condition the amplitude of the fictitious source in the extended domain was used. The method of lines (MOL) is a special practice for solving partial differential equations (PDE's). This method is more real than the regular finite difference method in terms of exactness and simulation time (Sadiku and Gorcia, 2000) [9] . The technique has the benefits of less simulation time (Sun et al., 1993) [10] . In this research, a numerical scheme based on MOL is used for solving both the linear and nonlinear SWE's. Tsunami simulations are carried out through the two models. Computed results are matched with the available observed and the USGS data.
Governing equations and boundary conditions
To conduct numerical simulation, a vertically integrated shallow water equations and radiation boundary conditions like Roy (1998) [8] , is used in this study. [7] On the other hand, the number of grids in x-direction and ydirection in the whole computational domain (OD and ED) are respectively 𝑀𝑀 = 500 and 𝑁𝑁 = 319 so that there are 73370 grid points. In order to ensure stability of the simulation, as per CFL criterion, the time step ∆𝑡𝑡 is taken as 10. The value of 𝑐𝑐 𝑓𝑓 is taken as 0.0033 which is same as Kowalik et al., (2005) [2] throughout the model zone. The bathymetric for the model zone are compiled from the bathymetric charts.
Model Data Set-up
Model Data Set-up
Initial condition for linear model
Same as 2004 Indian ocean tsunami source, a fictitious tsunami source is introduced in the linear model. The source zone is approximately 1900 km away from the cost and kept in ED. A comprehensive explanation of the assessment of the magnitude of the rapture due to earthquake as well as the highest rise and fall of the seabed associated with 26 December 2004 tsunami is available in Kowalik et al. (2005) [2] and this assessment is established by Okada (1985) [6] . The source zone is considered with a highest uplift of 5.07 m at the west and maximum subsidence of 4.74 m at the east. The uplift to subsidence is roughly from west to east (Kowalik et al., 2005) [2] . The disturbance in the form uplift and subsidence of sea surface is designated as the initial condition in the model with a maximum rise of 5 m to maximum fall of 4.75 m. In all other zones of the whole computational area, the initial sea surface elevations are taken as zero. The initial velocity components for the linear model are also taken as zero all over the model region. The source parameters are available in Meah et al. 2017 [3] .
Tsunami simulation due to the linear model
The effects of the fictitious tsunami source similar to the source of Indonesian tsunami of 2004 along the concerned coast of Thailand and Penang Island are investigated. Wave propagation time from the source is calculated and elevation of the water levels along the coastal belts of Penang and Phuket Island are estimated. After generating from the extended domain the wave propagates the whole computational domain. Tsunami travel time from source zone to the coastal area has been investigated. Fig. 3 illustrates the time for attaining +0.1 m sea level rise at each grid point in the model area. Thus, considering the 0.1 m sea level increase as the appearance of tsunami, it is found that after initiating the source the wave propagates progressively towards the beach. The appearance time of tsunami at Phuket is between 195 min to 210 min and the arrival time at Penang is approximately 330 min. This time is calculated for the extended tsunami source. The calculated water levels at different places of the beach of the Island are collected at an interval of 30 seconds. Fig. 4 represents the time histories of for the Phuket region in southwest Thailand and at two locations at the coasts of Penang Island in Malaysia. After the earthquake, the tsunami arrived at Phuket in 2 hours and at Penang in Malaysia in 3.5 hours to 4 hours reported in USGS website [(http://staff.aist.go.jp/kenji.satake/Sumatra-E.html) and it is also reported that the computed time of attaining maximum wave is 100 min to 110 min.
Open Boundary Condition for Non-linear Model
The nonlinear model in OD will be activated after formulating the open boundary condition and in nonappearance of the tsunami source. The amplitudes of tsunami surge along the western boundary of the original domain have been calculated to assess the amplitude of surge. On the basis of time histories data and wave height due to the source in extended domain, similar to Roy et al., 2006 [7] , the formulated boundary condition that signifies the impact of distant tsunami is
which is imposed at the west free boundary. where, 𝑠𝑠 = 0 for 𝑡𝑡 ≤ 𝑇𝑇 and 𝑠𝑠 > 0 for 𝑡𝑡 > 𝑇𝑇 One wave is allowed through this condition, with complete amplitude, to go through into the area through the open boundary before the amplitude starts damping. The computed water levels for formulated boundary condition at several positions of the coastal belt of Phuket and Penang are stored at a period of 30 seconds. The maximum water levels surrounding Phuket and Penang are approximately 7 -7.5 m and 3 -3.5 m respectively (Fig. 7). The water level continues to oscillate for long time and the time series begins with a depression. The computed results and observed data show that, the west coast of Phuket and the north-west coasts of Penang Island are in danger for stronger tsunami waves.
The entrance time of tsunami and the highest surge levels calculated by the above said two models are assessed with the data in USGS website (Table 1). The
| — | Region | Linear | Non- linear | USGS |
|---|---|---|---|---|
| Arrival time (min) | Penang | 330 | 260 | < 240 |
| Phuket | 200 | 130 | < 120 | |
| Max water level (m) | Surrounding Penang | 3 - 3.5 | 3 - 4 | 2 - 3.5 |
| Surrounding Phuket | 7 - 7.5 | 6 - 8 | 7 - 11 |
Table text extracted from the original PDF; superscript letters are shown inline. The original table image is below.
View original table image
Conclusion
The effect of the mentioned tsunami is figured along the said model area. By the scales of tsunami with the modified values of period, phase, and scale factor of the boundary condition, a proper boundary condition is made to handle the faraway tsunami along the said model area. It is seen that the formulated boundary condition in nonexistence of the actual source is comparable to that of the actual source of that event.
The calculated sea surface readings along the beach of the both the mentioned islands are observed to be fair and reliable with the sea surface data. The entrance time of wave due to the boundary condition is not much late than the entrance time of tsunami due to the actual source because the boundary condition is away from the source region of that event. It is observed that the preliminary removal of surge from a beach alters upon the phase of the boundary condition. Thus, the outputs obtained by the formulated boundary condition are in good conformity with the observed data in the USGS website.
Hopefully, this research will contribute to develop tsunami warning system in a big domain where the domain is divided different blocks and tsunami simulation can be carried out in the particular interested coastal belts, not considering the other blocks, to save the CPU time and computer memory.
Figures and tables from the paper
References
9 in the original paper- Ismail AIM, Karim MF, Roy GD, Meah MA. Numerical Modeling of Tsunami via the Method of Lines. World Academy of Science, Engineering and Technology. 2007;32:177-185.
- Kowalik Z, Knight W, Whitmore PM. Numerical Modeling of the Tsunami: Indonesian Tsunami of 26 December 2004. Science Tsunami Hazards. 2005;23(1):40-56.
- Meah MA, Noor MS, Arefin MA, Karim MF. Tsunami Inundation Modeling in a Boundary Fitted Curvilinear Grid Model Using the Method of Lines Technique. International Journal of Computer, Electrical, Automation, Control and Information Engineering. 2017;11(1):137-145.
- Meah MA, Karim MF, Noor MS, Papri NN, Hossen MK, Ismoin M. Combined Effect of Moving and Open Boundary Conditions in the Simulation of Inland Inundation Due to Far Field Tsunami. International Journal of Computer, Electrical, Automation, Control and Information Engineering. 2016;10(2):219-227.
- Meah MA, Ismail AIM, Karim MF, Islam MS. Simulation of the Effect of Far Field Tsunami through an Open Boundary Condition in a Boundary -Fitted Curvilinear Grid System. Science of Tsunami Hazards. 2012;31(1):1-18.
- Okada Y. Surface Deformation due to Shear and Tensile Faults in a Half Space. Bulletin of the Seismological Society of AMERICA. 1985;75(4):1135-1154.
- Roy GD, Karim MF, Ismail AM. Numerical Computation of Some Aspects of 26 December 2004 Tsunami along the West Coast of Thailand and Peninsular Malaysia Using a Cartesian Coordinate Shallow Water Model. Far East Journal of Applied Mathematics. 2006;25(1):57-71.
- Sadiku MNO, Gorcia RC. Method of lines solutions of axisymmetric problems. Southeastcon 2000. Proceedings of the IEEE; c2000. p. 527-530.
- Sun W, Wang YY, Zhu W. Analysis of waveguide inserted by a metallic sheet of arbitrary shape with the method of lines. International Journal of Infrared and Millimeter Waves. 1993;14(10):2069-2084