
Research article · 2023 · Full text
International Journal of Statistics and Applied MathematicsExport performance and comparative analysis of onion-with reference to India
Volume 8(3) · Pages 133–140 · DOI: 10.22271/maths.2023.v8.i3b.999 ↗
Research areasAgricultural Economics and PracticesSilkworms and Sericulture ResearchGlobal Trade and Competitiveness
Abstract
Author-writtenAgriculture supports the country's ability to hold a dominant position in the world's trade market, particularly in the trade of onions. In India, exports are only allowed if domestic criteria have been satisfied; fluctuations in domestic conditions are the reason for export changes. This study examines the export competitiveness of Indian onions, analyzing trade direction and future export share from 2006 to 2021 in comparison to competitor countries. Utilizing measures such as Markov chain analysis, revealed comparative advantage, revealed symmetric comparative advantage, and comparative export performance Index. The findings reveal that Indian onion exports were highly competitive until 2018 when a ban was imposed, resulting in increased competition from Pakistan. This has posed a serious threat to India's onion export potential. However, India still maintains a comparative advantage compared to other top onion exporting countries, as indicated by the comparative export performance Index. Nepal has consistently been the top importer due to limited domestic production and the inability. On the other hand, Sri Lanka, Indonesia, and other countries were identified as unstable markets with uncertain destinations for Indian onion exports. However, India needs to implement proactive measures to sustain its position in the global market, such as producing onion varieties that meet foreign requirements and modifying export policies. Challenges from competitors require strategic efforts to maintain and enhance India's export competitiveness in the global onion trade.
Summary
Source-checkedPlain-language reading of the full paper, prepared with AI and checked against the text. Each point links to the authors' own words.
Why it matters
- India is the second-largest producer of onions globally and the leading foreign exchange earner among its fruit and vegetable exports. View evidence ↗
- In 2021-22, India exported 1,537,496.89 MT of fresh onions, generating Rs. 3,432.14 crores, highlighting the crop's economic importance. View evidence ↗
- Indian onion exports are subject to domestic criteria, meaning changes in domestic conditions directly cause fluctuations in export levels. View evidence ↗
The question
- The study aims to analyze the export competitiveness, trade direction, and future export shares of Indian onions from 2006 to 2021 relative to competing nations. View evidence ↗
What they did
- The researchers used secondary data from APEDA (2008-2021) for export destinations and FAO for export quantities to assess competitiveness. View evidence ↗
- Competitiveness and trade stability were measured using Revealed Comparative Advantage (RCA), Revealed Symmetric Comparative Advantage (RSCA), the Comparative Export Performance (CEP) Index, and Markov chain analysis. View evidence ↗
- The Markov chain analysis focused on eight categories: Bangladesh, Malaysia, UAE, Sri Lanka, Nepal, Indonesia, Saudi Arabia, and a grouped 'others' category. View evidence ↗
What they found
- India is the second-largest onion exporter globally with an 18% market share, trailing the Netherlands, which holds 20%. View evidence ↗
- India's comparative advantage grew significantly from 2006 to 2018, but declined after a 2019 export ban triggered by rising domestic prices. View evidence ↗
- According to the Comparative Export Performance (CEP) index, Indian onions outperform all other compared exporting nations. View evidence ↗
- Nepal was identified as the most stable importer, retaining 64.20% of its market share from the previous year. View evidence ↗
- Sri Lanka and Indonesia were found to be the most unstable markets for Indian onion exports. View evidence ↗
- Forecasts suggest that over 70% of Indian onion exports will be directed to Bangladesh, Sri Lanka, Malaysia, UAE, and Nepal in the coming years. View evidence ↗
What it means
- The authors conclude that the export ban has increased competition between India and Pakistan due to their shared geographical proximity to key markets. View evidence ↗
- The authors recommend that India modify its export policies and develop onion varieties that meet specific foreign market requirements to maintain global competitiveness. View evidence ↗
- The authors suggest expanding into Japanese and European markets by cultivating yellow onions with mild pungency and larger bulbs. View evidence ↗
Visual summary
3 visualsIllustrations explain the paper; charts are replotted from the paper's own table values.
Competitive Dynamics of Onion Exports
AI-generated conceptual illustration (Red onions and cargo ships). It explains the idea and does not show study data.
View source evidence ↗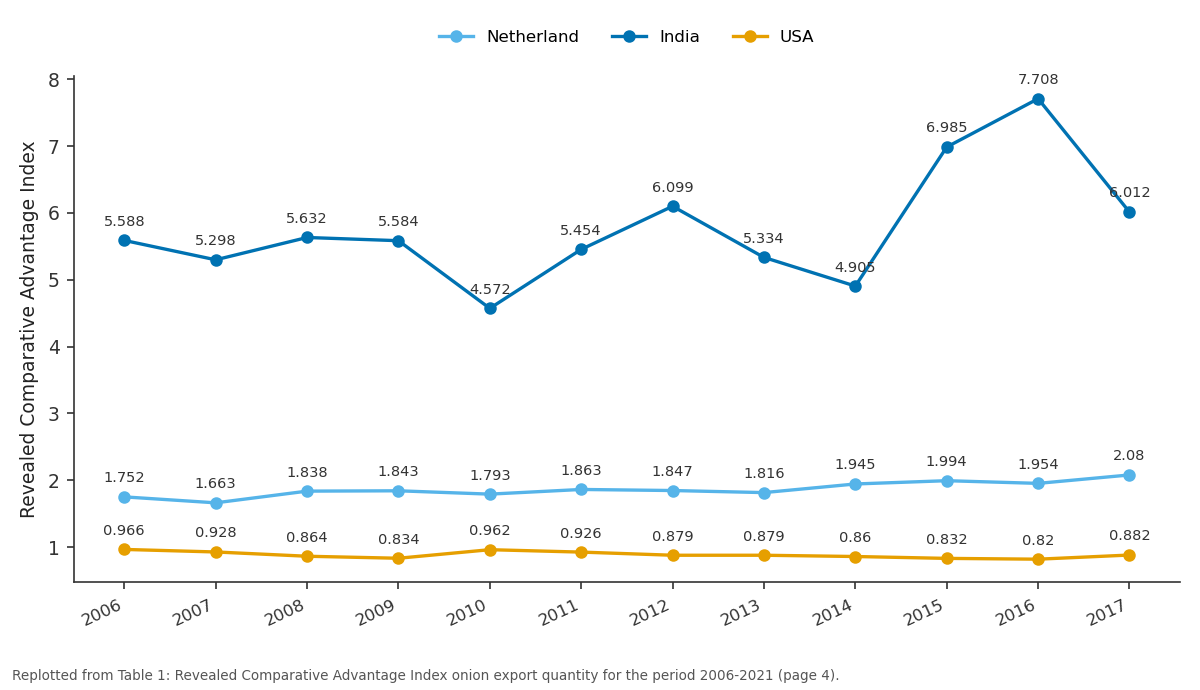
Netherland and India and more: 2006 vs 2007 vs 2008 vs 2009 vs 2010
Replotted from Table 1 (page 4) of the original paper. Every bar is the paper's own table value.
View source evidence ↗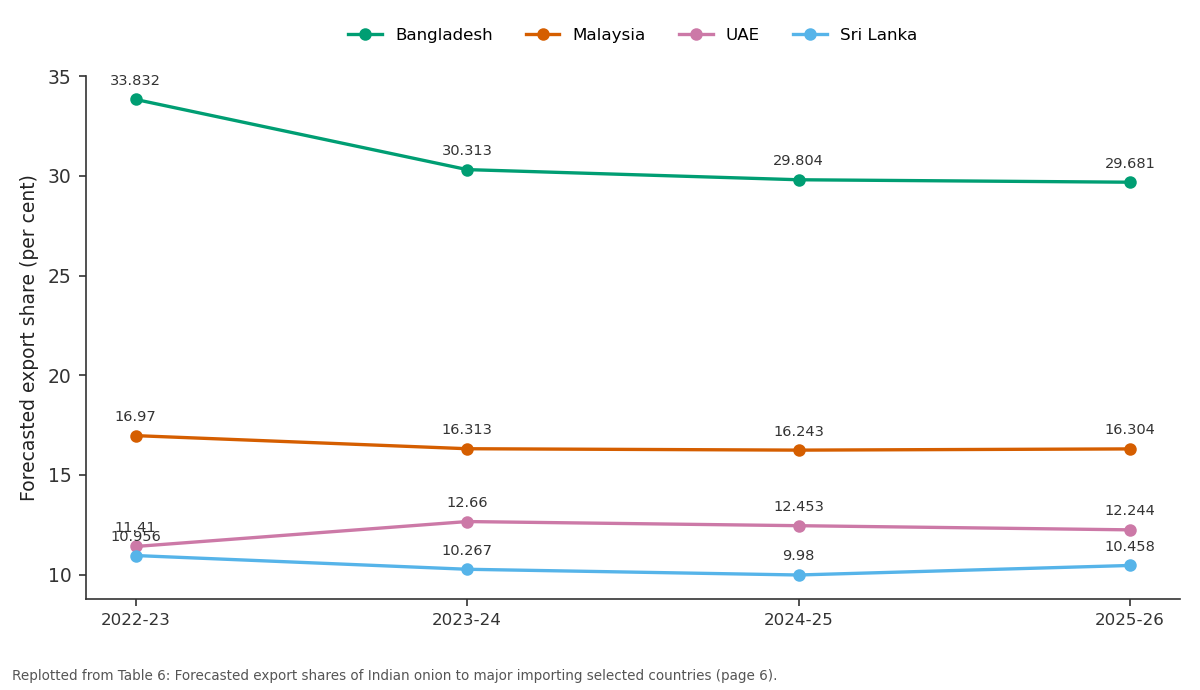
Bangladesh and Malaysia and more: 2022-23 vs 2023-24 vs 2024-25 vs 2025-26
Replotted from Table 6 (page 6) of the original paper. Every bar is the paper's own table value.
View source evidence ↗Figures & tables
From the original paper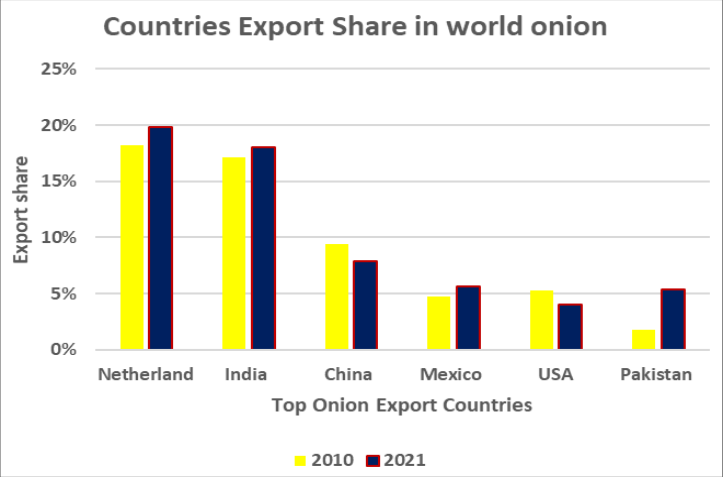 Figure 1
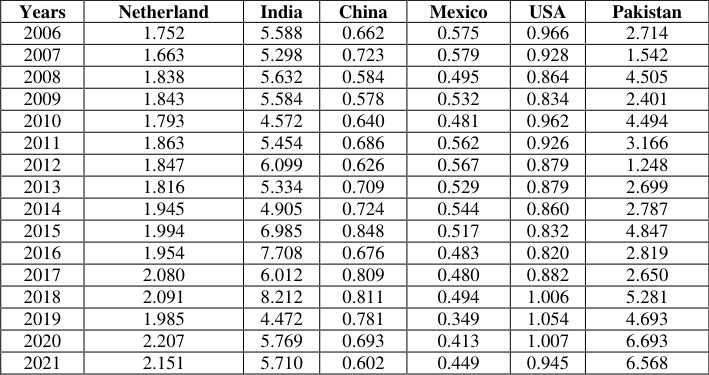 Table 1
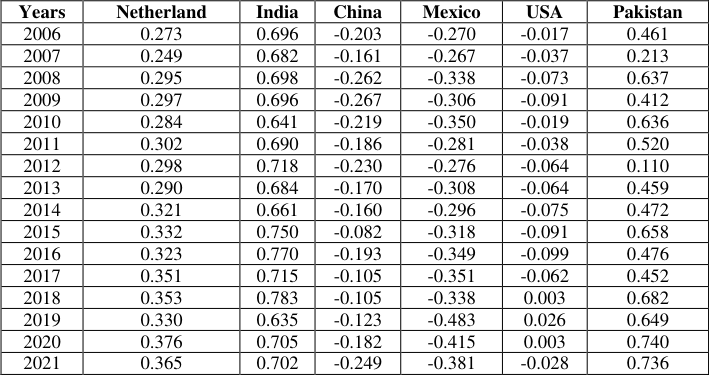 Table 2
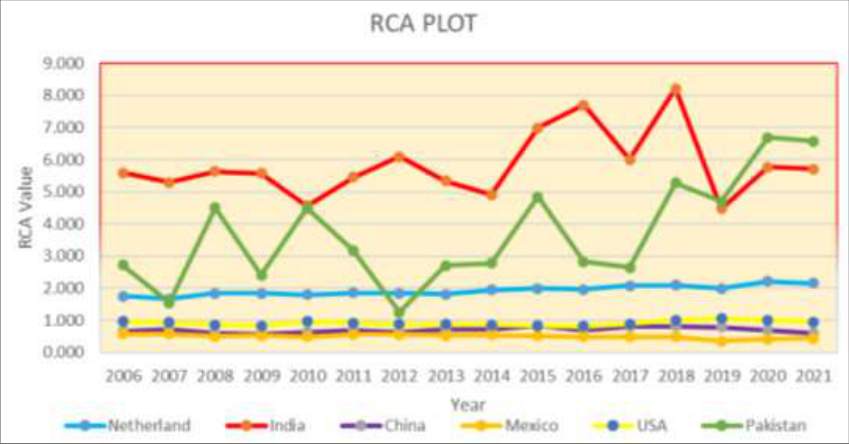 Figure 2
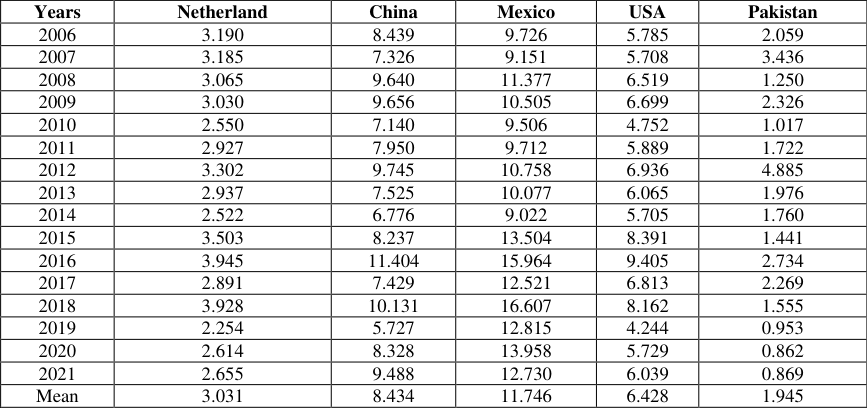 Table 3
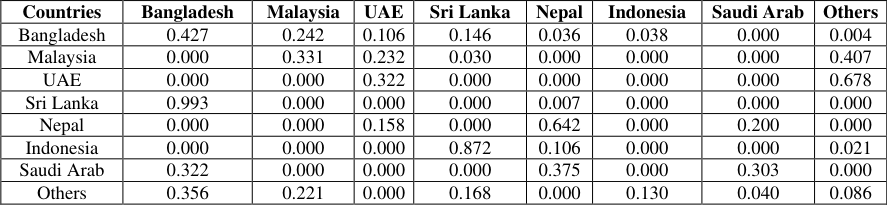 Table 4
 Table 6
 Table 5
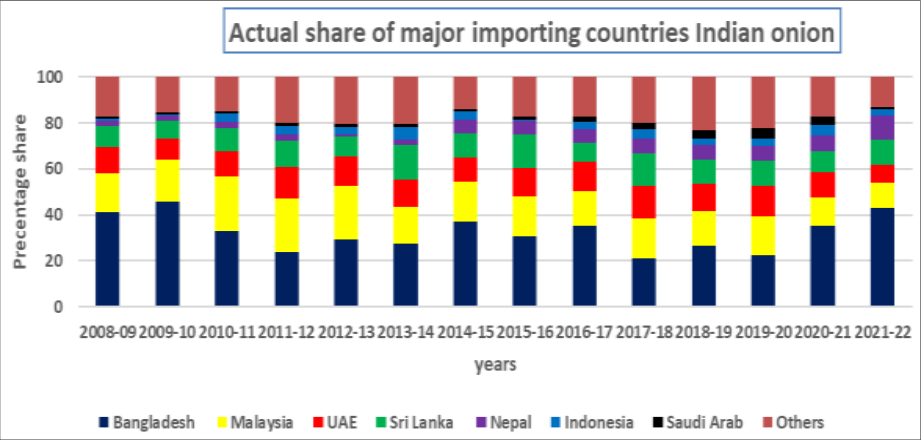 Figure 3
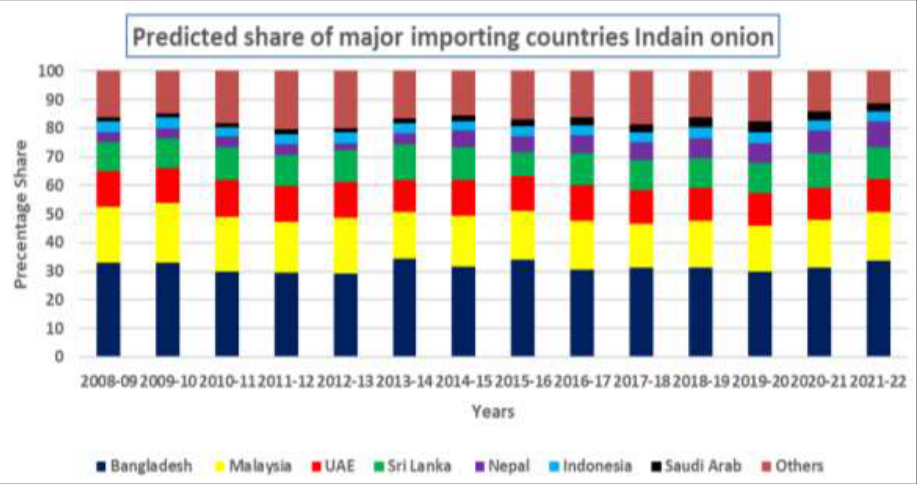 Figure 3
Introduction
Production and trade of agricultural commodities are essential to emerging nations' economic development (Akriti et al., 2017) [3] . During the Liberalization, Privatization, and Globalization (LPG) phase of 1991, India benefited from net agricultural exports as it enjoyed a comparative advantage in agricultural commodities (Ashpreet et al., 2022) [5] . India is the world's second-largest onion producer after China (Abhishek, 2015) [1] . It is the top earner in foreign exchange among fruits and vegetables, and not just for domestic consumption (Vani et al., 2022) [37] . Of the vegetables that India exported in 2021-22, the country exported 1,537,496.89 MT of fresh onions worldwide for a total of Rs. 3,432.14 crores (APEDA, 2022) [4] . This demonstrates how crucial onions are to India's export economy. Due to their widespread consumption, people from all socioeconomic classes. It is raised both for domestic consumption and for export (Sendhil et al., 2014) [31] . A total of 26.64 million tonnes will be produced in 2021-2022, on a 1.62 Mha area. The three states that produce the most onions are Maharashtra, Madhya Pradesh, and Karnataka (Abhishek, 2017) [2] . India contributes roughly 28.5% of the world's onion production, which places it second only to China (FAO, 2019) [16] . India exports onions to 150 different nations, ranking second after the Netherlands in terms of onion exports. In December 2018, the Indian government unveiled a new agricultural export policy to boost exports yet further. Bangladesh, Malaysia, the United Arab Emirates (UAE), Sri Lanka, Nepal, and Indonesia are the main destinations for Indian onions (Bhagat et al., 2022) [8] . Indian onion exports had many ups and downs, either due to price and production variations, continually increasing cultivation costs, domestic market prices that are higher than international prices, or occasionally as a result of exporting countries' prohibitions (Sonali and Rakesh, 2021) [34] .
As a result of our inconsistent policies regarding onion exports, we are losing significant importing nations. After India's ban on export, the price of onions has risen throughout Asia, forcing major importers like Bangladesh and Sri Lanka to import their produce from Pakistan, Myanmar, and China, which are close by and have been exporting to neighboring nations. Due to the problems mentioned above, the major importing countries changed their trade directions (Subramani, 2021) [35] . This indicates that it is necessary to reevaluate India's advantage in export competitiveness and the direction change of Indian onion exports. For policymakers and other stakeholders to identify measures for improving agricultural exports, it is necessary to examine how various commodities perform in dynamic shifts and movements when a country begins to export a commodity (Misu Kim, 2019) [24] . For that reason, the methods of export potential assessment (competitiveness) help countries evaluate their export prospects and raise their market share, and stability analysis might enable us to measure changes in market shares over time, both within and across markets (Sunil and Singh 2021) [36] . Several studies have examined the competitiveness and trade direction shifting of Indian agricultural commodities (Bhattacharya, P. 2019; Jha et al., 2019; Narayan and Bhattacharya, 2019; Yogesh and Srivastava, 2020; Ayu Sitanini, 2022) [9,18,28,39,6] , but none of them have specifically examined the Indian onion using recent data after the government implemented new agricultural export policies in terms of competitiveness and trade surpluses. In light of this context, we have attempted to study the current and projected export performance of Indian onions with their competitive advantage in international markets, along with comparing against other major exporters of onions and Indian onion export stability and performance.
Methods and Materials Data Collection
The study's goals are achieved by using secondary data. The Agriculture and Processed Food Products Export Development Authority (APEDA) provided data on the top export destinations for Indian onions from 2008 to 2021. Food and Agricultural Organization (FAO) provides export quantity data that is used to assess India's and other major exporting nations' competitiveness.
Export Competitiveness
Competitiveness is the capacity of a country to produce and market items that can compete on the world market while simultaneously improving the real incomes and living standards of the producers (Saxena et al., 2022) [30] . If a nation's domestic market price (DMP) is lower than its international price (IP) for a given commodity, it is said to be export competitive for that product. Examining export competitiveness involves using the metrics RCA (Revealed Comparative Advantage), RSCA (Revealed Symmetric Comparative Advantage), and CEP (comparative export performance) (Balassa, 1965) [7] . When an individual, organization, or country can supply a good or service at a lower opportunity cost than another producer, it is said to have a comparative advantage (Kumar, and Gummagolmath, 2021) [20] .
Revealed Comparative Advantage (RCA)
Balassa was the one who first calculated the RCA index (1965). It had undergone various changes (1977, 1979, and 1986). Instead of analyzing the reasons for comparative advantage, the index seeks to determine if a country has demonstrated an advantage. By dividing a commodity's share of total national exports by its share of total exports worldwide, the formula is calculated.
Where, 𝑅𝐶𝐴 𝑖𝑗 = Revealed Comparative Advantage of the ith country for the jth product. 𝑋 𝑖𝑗 = jth commodity exports by the ITH country. 𝑋 𝑖𝑡 = Total commodity exports of the ITH country. 𝑋 𝑤𝑗 = World exports of JTH commodity. 𝑋 𝑤𝑡 = Total commodity world exports.
The index's predicted value ranges from zero to infinity.
Based on Balassa's RCA, Hinloopen (2001) [17] suggested the classification shown below: 0 < but ≤ 1 then No comparative advantage. 1 < but ≤ 2 then Weak comparative advantage. 2 < but ≤ 4 then Moderate comparative advantage. 4 or more then Strong comparative advantage.
Revealed Symmetric Comparative Advantage (RSCA)
The term revealed symmetric comparative advantage (RSCA) was developed by Dalum et al., (1998) [11] and Widodo (2009) [38] as a result of the asymmetry problem with the RCA determined by the Balassa index, which is fundamentally not comparable on both sides of unity. RSCA has a value between -1 and +1. A modified formula is as follows:
When the value will be greater than 0 𝑅𝑆𝐶𝐴 𝑖𝑗 represents the country 'i' enjoy for product 'j' and vice versa if the value will be less than 0 (Shinoj and Mathur, 2008) [32] .
Comparative Export Performance Index (CEP)
The comparative export performance (CEP) index is used to evaluate two countries export competitiveness (Donges, 1982; Bobirca and Miclaus, 2011) [14,10] . The index's basis in export shares makes it possible to compare two indices.
Where, X ij = jth commodity exports by the ith country. X i = Total commodity exports of the ith country. X kj = jth commodity exports by the kth country. X k = Total commodity exports of the kth country.
The RCA and other indices are based on trade patterns that have been observed. An increase in RCA means an increase in the productivity of a country in a product market. Because of the simplicity of the measurements, this competitiveness measure is widely adopted (Darekar et al., 2015) [12] .
Markov chain analysis
Analyzing structural change in any system whose progress over time can be measured by a single outcome variable is the goal of Markov chain analysis (Dent, 1967) [13] . Specifically, we explored the gains and losses related to Indian onions' exports to key importing countries using the Markov chain model. An important part of a Markov chain analysis is developing a transitional probability matrix, P, which represents the probability that exports will switch from one nation 'i' to another nation 'j'. According to Yogesh and Srivastava (2010) [40] , the diagonal element measures a country's chances of maintaining its market share. Indian onions were imported into eight major countries in the context of the current application, viz. In addition to Bangladesh, Malaysia, the UAE, Sri Lanka, Nepal, Indonesia, Saudi Arabia, and all the other countries selected for analysis, all the other countries were grouped under the others selected category. We assumed that the average annual export of onions from India to countries that import onions was a function of previous exports and was constant over time (Mahadevaiah et al., 2005) [23] . This was algebraically expressed as
Where, 𝐸 𝑗𝑡 = Exports from India to the 𝑖 𝑡ℎ country during the year t 𝐸 𝑖𝑡-1 = Exports to the 𝑖 𝑡ℎ country during the year t -1 𝑃 𝑖𝑗 = Probability that exports will shift from the 𝑖 𝑡ℎ country to 𝑗 𝑡ℎ country 𝑒 𝑗𝑡 = Error-term which is statistically independent of 𝑒 𝑗𝑡-1 , and r = Number of importing countries.
According to Sathish and Khadar (2017) [29] , the properties of the transitional probabilities, which can be arranged in a (c × r) matrix, are as follows:
for all i India's expected export share for the given period t is based on the previous period's exports (t-1) multiplied by the estimated transition probability matrix (P) (Mohandas et al., 2018) [25] . By minimizing mean absolute deviation (MAD), the transition probability matrix was estimated using the linear programming (LP) framework (Joshi et al., 2015) [19] . According to the LP formulation for analysis was stated as
Min O P* + I e Subject to,
Where, P* is a vector of the probabilities 𝑃 𝑖𝑗 O is the vector of zeros. i is an appropriately dimensional vectors of areas. e is the vector of absolute errors. Y is the proportion of exports to each country. X is a block diagonal matrix of lagged values of Y.
V is the vector of errors.
G is a grouping matrix to add the row elements of P arranged in P* to unity.
Future projections for exports
Using the transitional probability matrix, the quantity of onion export share was predicted (Siddeshwar et al., 2017) [33] .
Where, 𝐵 𝑜 = Quantity exported in Base years, 𝐵 𝑡+𝑖 = Quantity exported in next year (prediction), T = Transitional probability matrix.
Results and Discussion
The required data were collected, analyzed, and interpreted in the context of the study's goal. The obtained results are displayed and discussed below.
Indian onion exports share
In terms of exporting onions, India dominates the world market and is the top exporter. India secured second place in terms of exports with a share of 18% after the Netherlands with 20%. The decadal export share comparison plot (Fig. 1) shows that China and the USA have decreased their export share compared to all other top exporting nations and countries. Worldwide, China and India are the top producers and consumers of onions; however, when it comes to exports, Indian onions are preferred more by customers due to their flavor and appearance.
Export Competitiveness
The results of a study by the RCA and RSCA indices indicate that onions have a significant comparative advantage over all other top major onion exporter countries (Tables 1 and2). India has a higher RCA index value than other countries, which indicates that India has an advantage in onion exports and that Indian onions have a unique demand and position on the world market (Nalini and Rai, 2007) [27] . According to Table 2, the values of the RSCA index for the export of Indian onion quantity are closer to one for India, followed by Pakistan and the Netherlands, indicating that these countries have a better position in onion exports. According to Fig. 2, Indian onion exports had a large increase in comparative advantage between 2006 and 2018, following which the RCA and RSCA indices gradually decreased. Due to rising domestic market prices, India was imposing an export ban in 2019 to maintain domestic market prices and supplies, and India's export policy for onions has been quite volatile. After the Indian government's September 2019 ban on onion exports, Pakistan onions are supposed to see an increase in demand and export prices on the global market. According to the RCA and RSCA, India is now competing with Pakistan for the export of onions as a result of the export ban on onions. Due to what might be their geographical proximity, Pakistan and India both export to similar countries? Together, Bangladesh, Malaysia, Sri Lanka, the United Arab Emirates, Sri Lanka, and Qatar contributed 86%. Examining Table 3 reveals the CEP index values of selected countries regarding India. All countries have values greater than one, indicating that Indian onions outperform all other countries (Pitcheswara and Balakrishna, 2018) [15] . However, the calculated values show a decreasing index in all countries over the years, which indicates the rise of Indian onion exports in the world market.
| Years | Netherland | China | Mexico | USA | Pakistan |
|---|---|---|---|---|---|
| 2006 | 3.190 | 8.439 | 9.726 | 5.785 | 2.059 |
| 2007 | 3.185 | 7.326 | 9.151 | 5.708 | 3.436 |
| 2008 | 3.065 | 9.640 | 11.377 | 6.519 | 1.250 |
| 2009 | 3.030 | 9.656 | 10.505 | 6.699 | 2.326 |
| 2010 | 2.550 | 7.140 | 9.506 | 4.752 | 1.017 |
| 2011 | 2.927 | 7.950 | 9.712 | 5.889 | 1.722 |
| 2012 | 3.302 | 9.745 | 10.758 | 6.936 | 4.885 |
| 2013 | 2.937 | 7.525 | 10.077 | 6.065 | 1.976 |
| 2014 | 2.522 | 6.776 | 9.022 | 5.705 | 1.760 |
| 2015 | 3.503 | 8.237 | 13.504 | 8.391 | 1.441 |
| 2016 | 3.945 | 11.404 | 15.964 | 9.405 | 2.734 |
| 2017 | 2.891 | 7.429 | 12.521 | 6.813 | 2.269 |
| 2018 | 3.928 | 10.131 | 16.607 | 8.162 | 1.555 |
| 2019 | 2.254 | 5.727 | 12.815 | 4.244 | 0.953 |
| 2020 | 2.614 | 8.328 | 13.958 | 5.729 | 0.862 |
| 2021 | 2.655 | 9.488 | 12.730 | 6.039 | 0.869 |
| Mean | 3.031 | 8.434 | 11.746 | 6.428 | 1.945 |
Table text extracted from the original PDF; superscript letters are shown inline. The original table image is below.
View original table image
| Years | Netherland | India | China | Mexico | USA | Pakistan |
|---|---|---|---|---|---|---|
| 2006 | 0.273 | 0.696 | -0.203 | -0.270 | -0.017 | 0.461 |
| 2007 | 0.249 | 0.682 | -0.161 | -0.267 | -0.037 | 0.213 |
| 2008 | 0.295 | 0.698 | -0.262 | -0.338 | -0.073 | 0.637 |
| 2009 | 0.297 | 0.696 | -0.267 | -0.306 | -0.091 | 0.412 |
| 2010 | 0.284 | 0.641 | -0.219 | -0.350 | -0.019 | 0.636 |
| 2011 | 0.302 | 0.690 | -0.186 | -0.281 | -0.038 | 0.520 |
| 2012 | 0.298 | 0.718 | -0.230 | -0.276 | -0.064 | 0.110 |
| 2013 | 0.290 | 0.684 | -0.170 | -0.308 | -0.064 | 0.459 |
| 2014 | 0.321 | 0.661 | -0.160 | -0.296 | -0.075 | 0.472 |
| 2015 | 0.332 | 0.750 | -0.082 | -0.318 | -0.091 | 0.658 |
| 2016 | 0.323 | 0.770 | -0.193 | -0.349 | -0.099 | 0.476 |
| 2017 | 0.351 | 0.715 | -0.105 | -0.351 | -0.062 | 0.452 |
| 2018 | 0.353 | 0.783 | -0.105 | -0.338 | 0.003 | 0.682 |
| 2019 | 0.330 | 0.635 | -0.123 | -0.483 | 0.026 | 0.649 |
| 2020 | 0.376 | 0.705 | -0.182 | -0.415 | 0.003 | 0.740 |
| 2021 | 0.365 | 0.702 | -0.249 | -0.381 | -0.028 | 0.736 |
Table text extracted from the original PDF; superscript letters are shown inline. The original table image is below.
View original table image
Export performance of Indian onion
Researchers examined the dynamics of changes in the export trade of a few selected commodities from India through the estimate of a transitional probability matrix (TPM). Because of their possible changes, it was important to know how trade among countries that import onions was changing direction in order to make the right decision (Kumar et al., 2007) [21] . Table 4 provides an overview of changes in India's exports of onions to major importers over the study period. The Comparative trade loss is measured by TPM row elements.
| Countries | Bangladesh | Malaysia | UAE | Sri Lanka | Nepal | Indonesia | Saudi Arab | Others |
|---|---|---|---|---|---|---|---|---|
| Bangladesh | 0.427 | 0.242 | 0.106 | 0.146 | 0.036 | 0.038 | 0.000 | 0.004 |
| Malaysia | 0.000 | 0.331 | 0.232 | 0.030 | 0.000 | 0.000 | 0.000 | 0.407 |
| UAE | 0.000 | 0.000 | 0.322 | 0.000 | 0.000 | 0.000 | 0.000 | 0.678 |
| Sri Lanka | 0.993 | 0.000 | 0.000 | 0.000 | 0.007 | 0.000 | 0.000 | 0.000 |
| Nepal | 0.000 | 0.000 | 0.158 | 0.000 | 0.642 | 0.000 | 0.200 | 0.000 |
| Indonesia | 0.000 | 0.000 | 0.000 | 0.872 | 0.106 | 0.000 | 0.000 | 0.021 |
| Saudi Arab | 0.322 | 0.000 | 0.000 | 0.000 | 0.375 | 0.000 | 0.303 | 0.000 |
| Others | 0.356 | 0.221 | 0.000 | 0.168 | 0.000 | 0.130 | 0.040 | 0.086 |
Table text extracted from the original PDF; superscript letters are shown inline. The original table image is below.
View original table image
Column elements show the probability that trade volume gained from competing countries, while diagonal elements show the probability that trade volume will be retained from its previous year's volume by TPM (Kandeeban, and Mahendran, 2019) [22] . Table 4 shows that Nepal was the most constant importer of Indian onions, maintaining 64.20 percent of the market from the previous year while losing 20 percent and gaining 37.50 percent with Saudi Arabia. Another consistent importer of Indian onions was Bangladesh, which maintained 42.70 percent of the market it had the previous year while losing 24 percent to Malaysia and 14.60 percent to Sri Lanka. Malaysia, the United Arab Emirates, and Saudi Arabia retain (33.31, 32.20, and 30.30 percent) of their share from the previous year. Sri Lanka, Indonesia, and other categories of countries had the most unstable markets since they did not of their shares from the previous year. The actual and expected export percentages for Bangladesh both showed an upward trend, rising from 41.04 percent to 42.84 percent and 33.07 percent to 33.83 percent, respectively. In the instance of Malaysia, the actual and expected export proportions (i.e., 17.00% to 11.04% and 19.41% to 16.97%) both indicated a decreasing trend. The actual and projected market share percentages for the UAE show a decreasing trend, going from 11.36 percent to 7.99 percent and from 12.34 percent to 11.41 percent, respectively. Saudi Arabia, Sri Lanka, and Indonesia all had a slight increase in share. A forecast of the Indian onion export shares from 2022-2023 to 2025-2026 is presented in Table 6. Over 70% of Indian onions are expected to be exported in the upcoming forecasted years to Bangladesh, Sri Lanka, Malaysia, the United Arab Emirates, and Nepal.
| Years | Bangladesh | Malaysia | UAE | Sri Lanka | Nepal | Indonesia | Saudi Arab | Others |
|---|---|---|---|---|---|---|---|---|
| 2022-23 | 33.832 | 16.970 | 11.410 | 10.956 | 9.235 | 3.336 | 3.002 | 11.259 |
| 2023-24 | 30.313 | 16.313 | 12.660 | 10.267 | 8.701 | 2.747 | 3.207 | 15.793 |
| 2024-25 | 29.804 | 16.243 | 12.453 | 9.980 | 8.241 | 3.200 | 3.342 | 16.737 |
| 2025-26 | 29.681 | 16.304 | 12.244 | 10.458 | 8.024 | 3.303 | 3.329 | 16.657 |
Table text extracted from the original PDF; superscript letters are shown inline. The original table image is below.
View original table image
Suggestion
To the government and decision-makers, the author suggested, now there is little opportunity for growth in India's onion exports because some nations have already started their own production. India currently exports onions to the Gulf countries, countries in the Far East, and Asian countries. But there is an opportunity to grow the market to include countries like Japan and Europe. These countries favor yellow onions with a mild pungency, a larger bulb size, and thick fleshy layers. The possibility of yellow onion cultivation in Maharashtra, Orissa, Madhya Pradesh, and other regions will help farmers earn more money and raise the GDP of local governments.
Conflict of interest
The authors declare that the research was conducted in the absence of any commercial or financial relationships that could be construed as a potential conflict of interest.
Funding:
This research received no external funding.
8. Institutional Review Board Statement: Not applicable.
9. Informed Consent Statement: Not applicable.
Acknowledgement
The authors would like to thank the Department of Farm Engineering, Institute of Agricultural Sciences, Banaras Hindu University, for providing the necessary requirements for this research work.
Figures and tables from the paper
| Years | Netherland | India | China | Mexico | USA | Pakistan |
|---|---|---|---|---|---|---|
| 2006 | 1.752 | 5.588 | 0.662 | 0.575 | 0.966 | 2.714 |
| 2007 | 1.663 | 5.298 | 0.723 | 0.579 | 0.928 | 1.542 |
| 2008 | 1.838 | 5.632 | 0.584 | 0.495 | 0.864 | 4.505 |
| 2009 | 1.843 | 5.584 | 0.578 | 0.532 | 0.834 | 2.401 |
| 2010 | 1.793 | 4.572 | 0.640 | 0.481 | 0.962 | 4.494 |
| 2011 | 1.863 | 5.454 | 0.686 | 0.562 | 0.926 | 3.166 |
| 2012 | 1.847 | 6.099 | 0.626 | 0.567 | 0.879 | 1.248 |
| 2013 | 1.816 | 5.334 | 0.709 | 0.529 | 0.879 | 2.699 |
| 2014 | 1.945 | 4.905 | 0.724 | 0.544 | 0.860 | 2.787 |
| 2015 | 1.994 | 6.985 | 0.848 | 0.517 | 0.832 | 4.847 |
| 2016 | 1.954 | 7.708 | 0.676 | 0.483 | 0.820 | 2.819 |
| 2017 | 2.080 | 6.012 | 0.809 | 0.480 | 0.882 | 2.650 |
| 2018 | 2.091 | 8.212 | 0.811 | 0.494 | 1.006 | 5.281 |
| 2019 | 1.985 | 4.472 | 0.781 | 0.349 | 1.054 | 4.693 |
| 2020 | 2.207 | 5.769 | 0.693 | 0.413 | 1.007 | 6.693 |
| 2021 | 2.151 | 5.710 | 0.602 | 0.449 | 0.945 | 6.568 |
Table text extracted from the original PDF; superscript letters are shown inline. The original table image is below.
View original table image
| Years | Bangladesh | — | Malaysia | — | UAE | — | Sri Lanka | — | Nepal | — | Indonesia | — | Saudi Arab | — | Others | — |
|---|---|---|---|---|---|---|---|---|---|---|---|---|---|---|---|---|
| A | P | A | P | A | P | A | P | A | P | A | P | A | P | A | P | |
| 2008-09 | 41.04 | 33.07 | 17.00 | 19.41 | 11.36 | 12.34 | 9.11 | 10.10 | 2.43 | 3.55 | 0.76 | 3.81 | 0.96 | 1.47 | 17.33 | 16.26 |
| 2009-10 | 45.89 | 33.12 | 18.21 | 20.57 | 8.84 | 12.31 | 7.77 | 10.37 | 2.34 | 3.62 | 0.58 | 3.75 | 0.91 | 1.36 | 15.46 | 14.90 |
| 2010-11 | 33.12 | 29.87 | 23.80 | 19.21 | 10.76 | 12.90 | 10.18 | 11.34 | 2.54 | 3.65 | 3.75 | 3.19 | 0.95 | 1.39 | 14.90 | 18.45 |
Table text extracted from the original PDF; superscript letters are shown inline. The original table image is below.
View original table image
References
34 in the original paper- Singh A. Trend Analysis of Onion (Allium cepa) Exports from India. Trends in Biosciences. 2015;8(18):49234927.
- Singh A. Using Seasonal Indices to Study Seasonal Variation in Export of Onion. Trends in Biosciences. 2017;10(18):3283-3286.
- Sharma A, Ojha A, Praveen KV, Aditya KS, Pokharna P. International Trade Potential of Indian Onion: An Analysis of Competitive Advantage and Direction of Trade. Indian Journal of Economics and Development. 2017;13(2):315-320.
- Sitanini A. Competitiveness of Indonesian coffee exports to japan. Perwira Journal of Economics and Business. 2022;2(1):72-79.
- Balassa B. Trade liberalization and revealed comparative advantage. The Manch Sch. 1965;33(1):99-123.
- Bhagat AA, Bhoge RS, Shete BJ. Stability analysis of Indian onion export: A Markov chain approach. Pharma Innovation Journal. 2022;11(10):2291-2293.
- Bhattacharya P. Determinants of export competitiveness of fresh fruits in India. International Journal of Sustainable Economy. 2019;11(1):61-80.
- Bobirca A, Paul-Gabriel M. A Multilevel Comparative Assessment Approach to International Services Trade Competitiveness: The Case of Romania and Bulgaria. International Journal of Human and Social Sciences. 2011;1(1):1-6.
- Dalum B, Laursen K, Villumsen G. Structural Change in OECD Export Specialization Patterns: Despecialisation and Stickiness. International Review of Applied Economics. 1998;12(3):423-443.
- Ashwini DS, Pokharkar VG, Snehal DB, Patil SG. Performance and Competitiveness of Onion Export from India. International Journal of Tropical Agriculture. 2015;33(2):1095-1099.
- Dent WT. Application of Markov Analysis to International Wool Flows, Review of Economics and Statistics. 1967;49(2):613-616.
- Rao EP, Ankalam B. Comparative Export Performance (CEP) and Revealed Comparative Advantage (RCA) of Paddy: with reference to India. Journal of Emerging Technologies and Innovative Research. 2018;5(2):306313.
- Hinloopen J, Van Marrewijk C. On the empirical distribution of the Balassa index. Weltwirtschaftliches Archive. 2001;137(1):1-35.
- Jha GK, Suresh A, Punera B, Supriya P. Growth of horticulture sector in India: trends and prospects. Indian Journal of Agricultural Sciences. 2019;89(2):314-321.
- Joshi D, Singh HP, Gurung B. Stability analysis of Indian spices export: A Markov chain approach. Economic Affairs. 2015;60(2):257-262.
- Kumar P, Badal PS, Achoth L. Changing direction of Indian mango exports. Indian Journal of Agricultural Marketing. 2007;21(1):130-137.
- Kandeeban M, Mahendran K. A study on export direction of Indian cashew kernels-Markov chain approach. International Journal of Farm Sciences. 2019;9(3):81-84.
- Mahadevaiah GS, Ravi PC, Chengappa PG. Stability analysis of raw cotton export markets of India -Markov chain approach. Agricultural Economics Research Review. 2005;18(2):253-259.
- Misu Kim. Export Competitiveness of India's Textiles and Clothing Sector in the United States. Economies. 2019;7(2):1-17.
- Mohandas K, Indhusree A, Anil Kuruvila. Exports of vegetables from India: An economic analysis. Journal of Tropical Agriculture. 2018;56(1):34-44.
- Yamini M, Pokharkar VG, Karthik HP. Stability analysis of Indian cotton: A markov chain approach. Journal of Pharmacognosy and Phytochemistry. 2020;9(4):406-408.
- Ranjan N, Rai KM. Performance, Competitiveness and Determinants of Tomato Export from India. Agricultural Economics Research Review. 2007;20:551-562.
- Narayan S, Bhattacharya P. Relative export competitiveness of agricultural commodities and its determinants: Some evidence from India. World Development. 2019;117(1):29-47.
- Sathish S, Khadar Babu SK. Markovian prediction of future values for food grains in the economic survey. IOP Conf. Series: Materials Science and Engineering. 2017;4(2):141-148.
- Saxena R, Kumar A, Singh R, Paul RK, Raman MS, Kumar R, et al. Examining export advantages in Indian horticulture: An approach based on product mapping and seasonality. Journal of Agribusiness in Developing and Emerging Economies, 2022.
- Sendhil R, Sundaramoorthy C, Venkatesh P, Thomas L. Testing market integration and convergence to the law of one price in Indian onions. African Journal of Agricultural Research. 2014;9(40):2975-2984.
- Shinoj P, Mathur VC. Comparative Advantage of India in Agricultural Exports vis-á-vis Asia: A Postreforms Analysis. Agricultural Economics Research Review. 2008;21(1):60-66.
- Shiraganvi SS, Guledagudda SS. Stability analysis of chickpea export markets of India -Markov chain approach. International Journal of Current Research. 2017;9(2):46542-46544.
- Sonali K, Singh R. Export Competitiveness of Dry Onion with Reference to India. Economic Affairs. 2021;66(04):629-633.
- Sunil J, Singh A. Structural Change Analysis of Groundnut Export Markets of India: Markov Chain Approach. Indian Journal of Economics and Development. 2021;9(5):1-6.
- Keerthana VK, Rajeswari S, Devi BI, Kumari LP. Study on export competitiveness of onion from India. Andhra Pradesh Journal of Agricultural Sciences. 2022;8(1):1-5.
- Widodo T. Comparative Advantage: Theory, Empirical Measures and Case Studies. Review of Economic and Business Studies. 2009;4:57-82.
- Yogesh HC, Srivastava SK. An Application of Markov Chain Model to Study on Trade Direction of Export of FCV Tobacco from India. Acta Scientific Agriculture. 2020;4(9):73-77.
- Yogesh HC, Srivastava SK. An Application of markov chain model to study on trade direction of export of FCV Tobacco from India, Acta Scientific Agriculture. 2010;4(9):562-569.
Cited by 1
From OpenAlex, OpenCitations and reference lists read by Scinovex
- Forecasting onion price volatility in Madhya Pradesh markets using Arma-Garch models
Nandish Patil, Umesh Singh, Kuldeep Rajpoot, Abha Mishra · International Journal of Statistics and Applied Mathematics · 2026
The present study examined and forecasted onion price volatility in major markets of Madhya Pradesh using the ARMA-GARCH modeling framework. Weekly price data covering nearly twelve years were obtained from AGMARKNET for four important onion markets, namely Indore, Mandsaur, Ratlam, and Sagar. Stationarity of the series was evaluated using Augmented Dickey-Fuller (ADF) and KPSS tests, and first-order differencing was applied to achieve stationarity. The presence of conditional heteroskedasticity was verified through the ARCH-LM test, justifying the application of GARCH models. The dataset was