
Research article · 2023 · Full text
International Journal of Statistics and Applied MathematicsRevenue generating model for transportation companies
Volume 8(3) · Pages 22–25 · DOI: 10.22271/maths.2023.v8.i3a.974 ↗
Research areasTransportation Planning and OptimizationAviation Industry Analysis and TrendsSupply Chain and Inventory Management
Abstract
Author-writtenThis work considers the seats on airplanes, trains, buses and cars as non-regular fixed lifetime inventories and developed a revenue generating function for each trip embarked upon by any of these means of transportation. Numerical examples on the use of the revenue generating function was also discussed.
Summary
Source-checkedPlain-language reading of the full paper, prepared with AI and checked against the text. Each point links to the authors' own words.
Why it matters
- Transportation seats are considered non-regular fixed lifetime inventories because a seat that is not used during one trip becomes available again for the next trip. View evidence ↗
- In transportation management, an unused seat is viewed as an 'outdated' item for that specific trip, while a lack of available seats results in a shortage. View evidence ↗
The question
- The objective of this research is to derive a revenue generating function for transportation managers by treating available seats as non-regular inventories. View evidence ↗
What they did
- The model assumes a fixed number of seats, which are either uniform in price and comfort (as in buses and cars) or divided into different classes (as in trains and airplanes). View evidence ↗
- The model incorporates an 'outdate cost' that is charged against the manager for every seat that remains unused at the end of a trip. View evidence ↗
- The model accounts for shortage costs when passenger demand exceeds the total number of available seats. View evidence ↗
- The authors used Mathematical 8 software to compute the results for their numerical examples. View evidence ↗
What they found
- In a numerical example for a 36-seater bus over seven days, 229 seats were used and 24 were unused, generating a total revenue of 1,026,000 naira. View evidence ↗
- The airplane example utilized a 260-seat configuration divided into economy (150), premium (60), business (30), and first class (20). View evidence ↗
What it means
- The authors conclude that their model effectively determines the number of seats used and unused, and accurately computes the revenue generated by a transportation company over any given period. View evidence ↗
- The authors recommend the model for use by transportation companies due to its ease of application. View evidence ↗
Visual summary
1 visualsIllustrations explain the paper; they do not show study data.
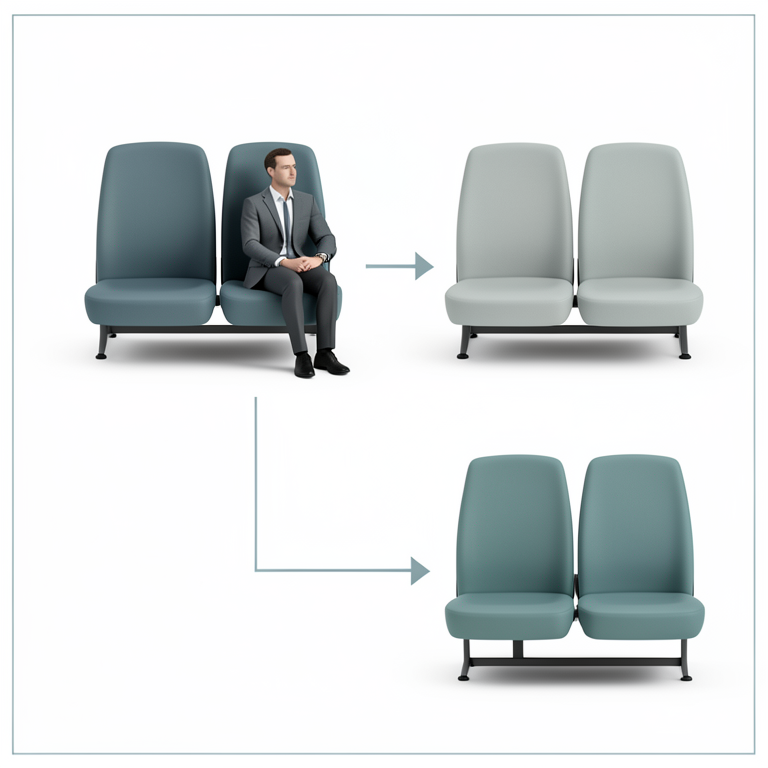
Non-Regular Inventory Cycle
AI-generated conceptual illustration (commercial passenger bus seats). It explains the idea and does not show study data.
View source evidence ↗Figures & tables
From the original paper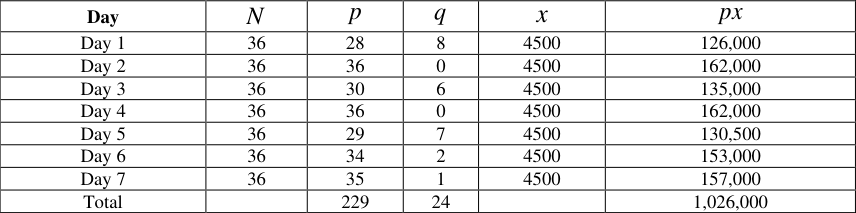 Table 1
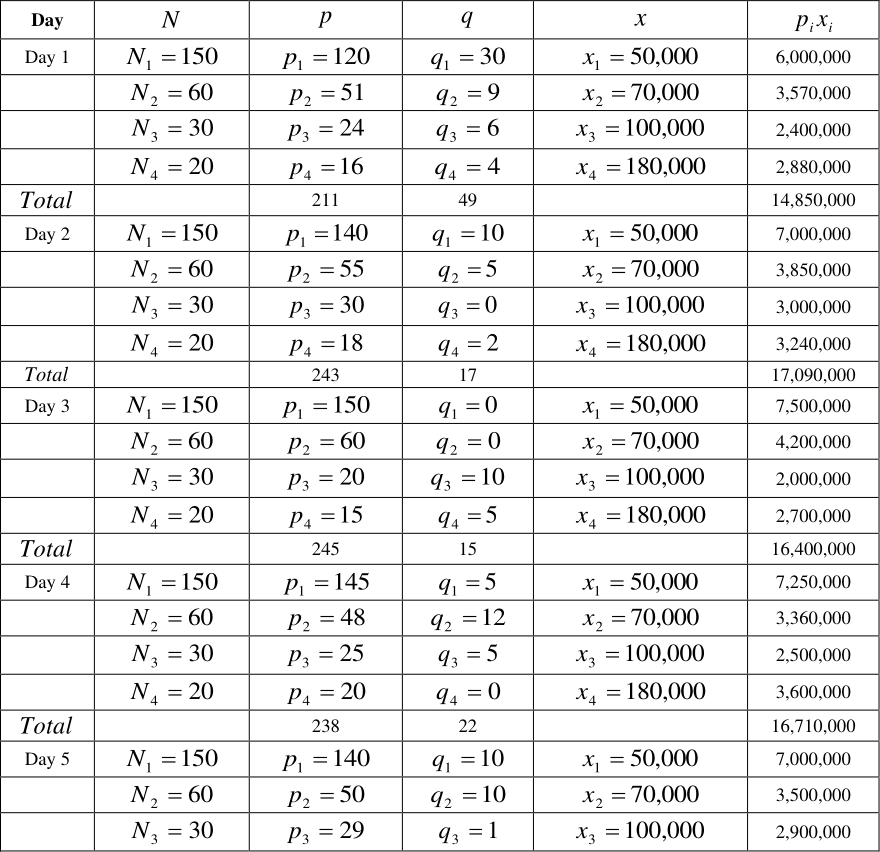 Table 2
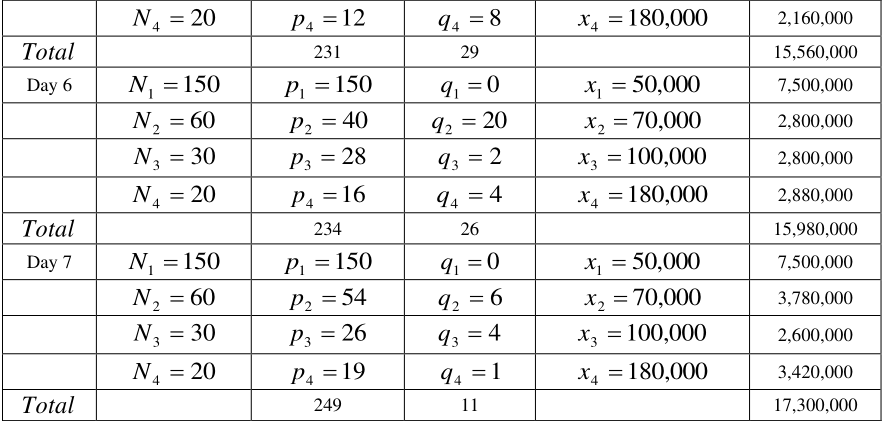 Table 3
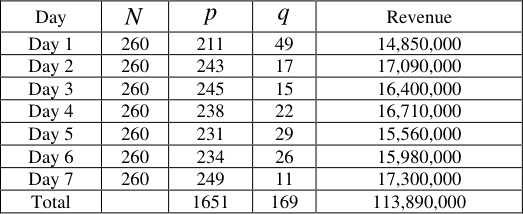 Table 3
Introduction
Non regular fixed lifetime inventory is any inventory system where items that outdate in one period become useful at the start of the next period. Examples of non-regular inventories include; seats on an airplane, seats on a train, seats on a bus and seats on a car, Igbinosun and Izevbizua (2020) [2] . This work consider the available seats on an airplane, train, bus and car as non-regular inventories and derived a revenue function for transportation managers. The total number of seats in an airplane, train, bus or a car are known and fixed. The seats are used to meet the demand of passengers moving from one point to another. Any seat not used to meet demand in a trip is considered outdated for that trip and when there are no seats available to meet a passengers demand, shortage occur, Chiu (1994) [3] , Nahmias (1978) [4] . Next, we give a brief description of the different types of seats available on an airplane and a train.
Airplane:
Every commercial airplane has four different types of seats or classes. These are economy class, premium economy class, business class and first class. The economy class also refer to as the main cabin is the most basic class. The seats are narrowest, ranging from 16inches to just over 19inches wide. The legroom ranges from 30inches to 34inches. It is the cheapest and always have more seats than the other classes. The premium economy class is mostly found on international flights and has slightly wider seats and more legroom when compared to the economy class. The business class is between the economy class and first class. The business class is also known as the executive class. The flight tickets are expensive, but much more affordable than first class seats. The business class have high quality accommodation and is intended mostly for business travels. First class service is typically the priciest of the classes. Passengers seating in the first class section have more comfortable seating and are often given extravagant services. It is most often occupied by celebrities and wealthy passengers. The first class seats are the most expensive, but most comfortable accommodations. (www.trainspred.com) Trains: Like the airplane, the train have different types of seats or classes. The classes include; first class (FC). The first class have 4 berths in a lockable compartment. Sheets and blankets are often provided to passengers at extra cost. The chain class (AC), the seats here are arranged as 3+2 seats across the carriage. Sleeper class (SL), here you can bring a sleeping sheet and blankets because they are not provided. It is suitable for travelers on a tight budget. Second class (2S), one of the cheapest classes on the train. The second class often have two rows of three passengers each. Lastly, the unreserved/ general class (2S), is the cheapest class on the train. Seats are reserved or designated. Its always over crowded, noisy and smelly. Some passengers without seats, seats on the floor. (www.trianspread.com)
Buses and Cars: the seat in most buses and cars are uniform. Since they are uniform, their prices are the same and they offer the same comfort.
Description of the model
The available seats on an aeroplane, train, bus or car are considered as an inventory, used to meet the demand of travelling passengers. The total number of available seats is fixed and may be uniform (for buses and cars) or subdivided into classes (for trains and aeroplanes). Where the seats are uniform the price per seat is the same for all seats and the price per seat varies from class to class, when the number of available seats are subdivided in classes. The total revenue is the sum of revenue from each subclasses.
Assumptions of
Assumptions of
Deriving the revenue function
The components of the revenue function are the generating function, the outdate cost, the shortage cost and the setup cost.
The generating function
The generating function is used to compute the revenue generated on a trip. We derived a function similar Izevbizua and Olowu (2023), for the case where the seats are uniform and the case where the seats are subdivided into classes.
Case 1: No subclasses. This is a situation where there is only one type of seat on the means of transportation and the price is uniform for all the seats, eg the bus or car. Since the total number of seat is N and the price per seat is x then revenue generated per trip will be while the number of seats not used to meet passengers demand on a trip are n q q q q . . . , , , 3 2 1 . This would imply that n n q q q q q and p p
. when all of the seats in a subclass is used to meet passengers demand, we have i i p N , when non of the seats in a subclass is used to meet passengers demand, we have i i q N and when some of the seats are used to meet demand, we have
. Therefore the revenue generated from subclasses for a trip is
Outdate cost
When the demand for seats is less than the number of available seats, outdate occur. That is any seat not used to meet passengers demand outdate at the end of a trip and an outdate cost per seat is charged against the transport manager.
For the no subclass case the outdate quantity is p N q and the outdate cost is
, where is outdate cost per seat. For the subclass case, the outdate quantity is
Shortage cost
Whenever passengers demand is higher than the number of available seats to meet the demand, shortage is said to occur.
That is N D and the shortage quantity will be
. With a shortage cost of per shortage, the shortage cost will be
Finally, there is a fixed setup cost Q for the model. Therefore, the revenue function for the case where there are no subclasses is
And for the case with subclasses
Numerical Examples
Next we implement equations ( 1) and (2). Mathematical 8 was used in computing our results.
Example 1
Table 1 shows the revenue generated by a 36 seater bus for a period of seven days. Note that this the case where subclasses dose not exits and price is uniform. The total number of seats on the bus is 36, the number of seats used over the seven days period is 229 and the number of seats not used over the period is 24. After seven days, the bus which operates one trip a day makes a total of one million and twenty-six thousand naira (N1,026,000).
| Day | N | p | q | x | px |
|---|---|---|---|---|---|
| Day 1 | 36 | 28 | 8 | 4500 | 126,000 |
| Day 2 | 36 | 36 | 0 | 4500 | 162,000 |
| Day 3 | 36 | 30 | 6 | 4500 | 135,000 |
| Day 4 | 36 | 36 | 0 | 4500 | 162,000 |
| Day 5 | 36 | 29 | 7 | 4500 | 130,500 |
| Day 6 | 36 | 34 | 2 | 4500 | 153,000 |
| Day 7 | 36 | 35 | 1 | 4500 | 157,000 |
| Total | 229 | 24 | 1,026,000 |
Table text extracted from the original PDF; superscript letters are shown inline. The original table image is below.
View original table image
Example 2
The next example is an airplane with a total of 260 seats subdivided into; economy class = 150 seats, premium class = 60 seats, business class = 30 seats and first class = 20 seats. We assume the airplane makes one trip a day and analyzed its operations for a period of seven days. The results are shown in Table 2
Figures and tables from the paper
| Day | N | p | q | Revenue |
|---|---|---|---|---|
| Day 1 | 260 | 211 | 49 | 14,850,000 |
| Day 2 | 260 | 243 | 17 | 17,090,000 |
| Day 3 | 260 | 245 | 15 | 16,400,000 |
| Day 4 | 260 | 238 | 22 | 16,710,000 |
| Day 5 | 260 | 231 | 29 | 15,560,000 |
| Day 6 | 260 | 234 | 26 | 15,980,000 |
| Day 7 | 260 | 249 | 11 | 17,300,000 |
| Total | 1651 | 169 | 113,890,000 |
Table text extracted from the original PDF; superscript letters are shown inline. The original table image is below.