
Research article · 2023 · Full text
International Journal of Statistics and Applied MathematicsRegression models for forecasting Nutri cereals area and production in India
Volume 8(3) · Pages 48–53 · DOI: 10.22271/maths.2023.v8.i3a.979 ↗
Research areasAgricultural Economics and PracticesSpectroscopy and Chemometric Analyses
Abstract
Author-writtenMaking of necessary steps for maintaining food security and overcome environmental problems is mainly achieved by undergoing estimation of crop production and prediction of crop area. The art of anticipating the future values of cultivated crop in advance before its harvest is called as forecasting of crop production. In this study, the main objective was to develop a clear portray about the area and production of nutria-cereals in India. India is the leading producer of nutri-cereals which is almost 33.3 percent of total nutri cereals produced all over the world. The largest nutri cereals-producing state in India is Rajasthan which almost contributes 41.03 percent of total nutri cereals produced with in the country. Regression modeling was applied for both area and production of nutri cereals in India for a period 70 years (1951-2020) using linear, logarithmic, quadratic, cubic, power and exponential models. The results concluded that cubic model shown better performance compared to other models for prediction of area and production of nutri cereals for India with maximum accuracy.
Summary
Source-checkedPlain-language reading of the full paper, prepared with AI and checked against the text. Each point links to the authors' own words.
Why it matters
- Estimating crop production and predicting crop area are essential steps for maintaining food security and addressing environmental issues. View evidence ↗
- India is a global leader in nutri-cereal production, accounting for approximately 33.3% of the world's total. View evidence ↗
- Nutri-cereals are valuable because they are tolerant to drought and extreme weather, and they require minimal fertilizers and pesticides. View evidence ↗
The question
- The primary objective of the study was to create a clear portrayal of the area and production of nutri-cereals in India. View evidence ↗
What they did
- Six different regression models, linear, logarithmic, quadratic, cubic, power, and exponential, were applied to forecast area and production. View evidence ↗
- The data was divided into a training set (1951-2015) for model fitting and a testing set (2016-2020) for model evaluation. View evidence ↗
- The best forecasting model was identified based on the lowest Root Mean Square Error (RMSE) and Mean Absolute Percentage Error (MAPE). View evidence ↗
What they found
- For area prediction, the cubic model performed best with an R² of 0.969, an RMSE of 1.314, and a MAPE of 3.08%. View evidence ↗
- For production prediction, the cubic model was the most accurate, showing an R² of 0.870, an RMSE of 2.637, and a MAPE of 7.24%. View evidence ↗
- Using the cubic model, the study forecasts that nutri-cereal area and production in India could reach 27.14 million hectares and 62.09 million tonnes by 2030. View evidence ↗
- The cubic model's MAPE values (3.08 for area and 7.24 for production) indicate that it provides high-accuracy predictions. View evidence ↗
What it means
- The authors conclude that the cubic regression model is the most effective for forecasting nutri-cereal area and production in India. View evidence ↗
- The authors suggest that future research should explore other modeling techniques, such as artificial intelligence, grey theory forecasting, and hybrid approaches. View evidence ↗
Visual summary
3 visualsIllustrations explain the paper; charts are replotted from the paper's own table values.
Model Comparison Concept
AI-generated conceptual illustration (Nutri cereals (finger millet, pearl millet, and foxtail millet) in Indian agricultural fields). It explains the idea and does not show study data.
View source evidence ↗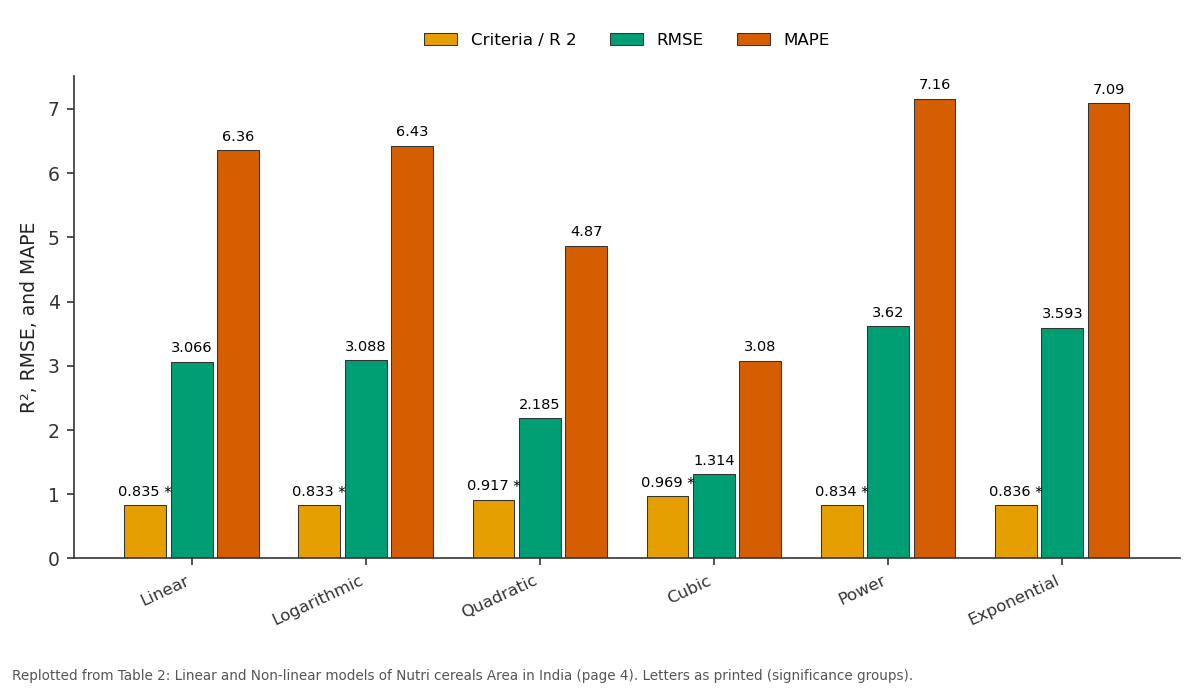
Criteria / R 2 and RMSE and more: Linear vs Logarithmic vs Quadratic vs Cubic vs Power
Replotted from Table 2 (page 4) of the original paper. Every bar is the paper's own table value.
View source evidence ↗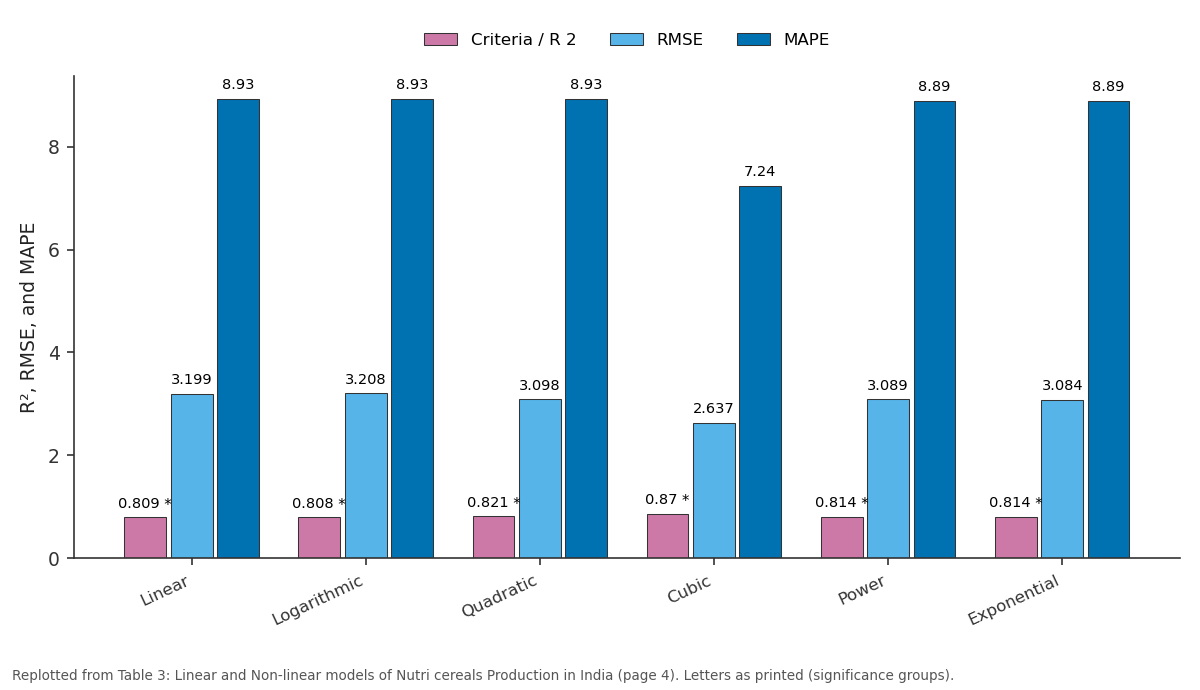
Criteria / R 2 and RMSE and more: Linear vs Logarithmic vs Quadratic vs Cubic vs Power
Replotted from Table 3 (page 4) of the original paper. Every bar is the paper's own table value.
View source evidence ↗Figures & tables
From the original paper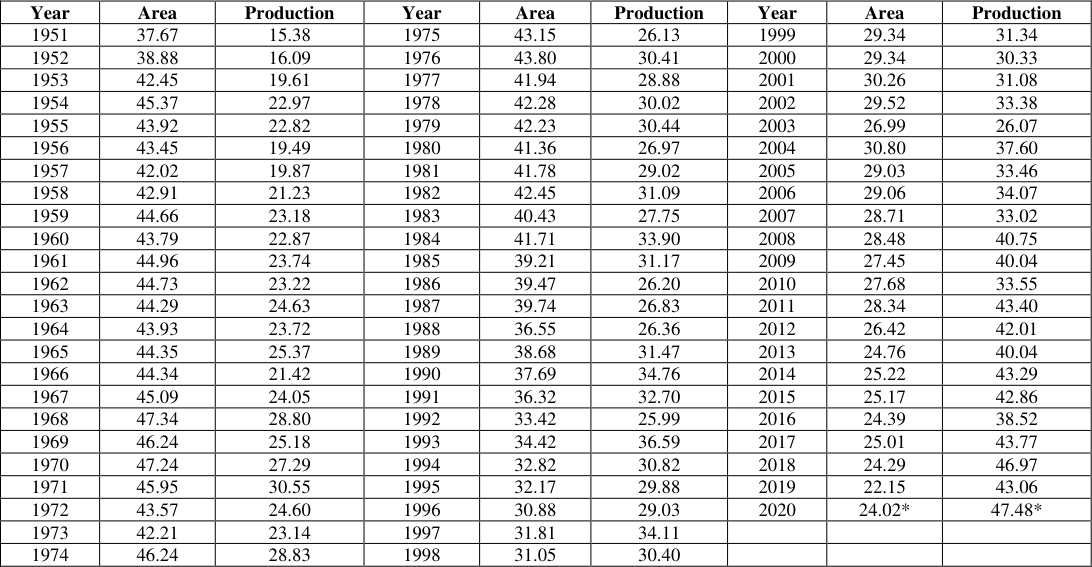 Table 1
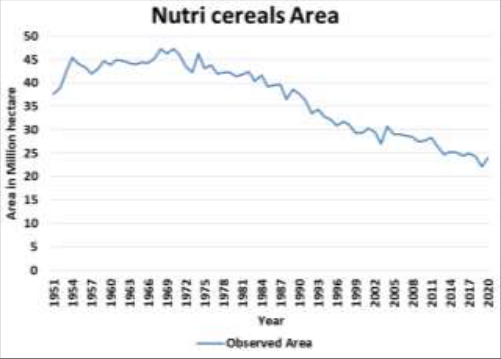 Figure 1
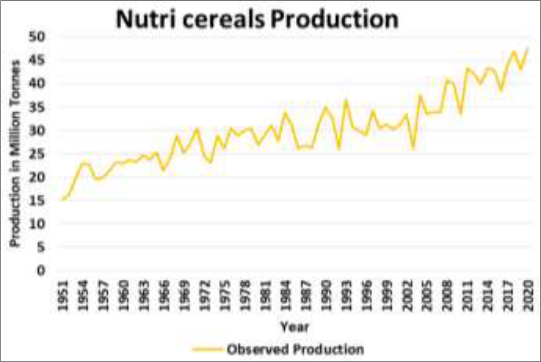 Figure 1
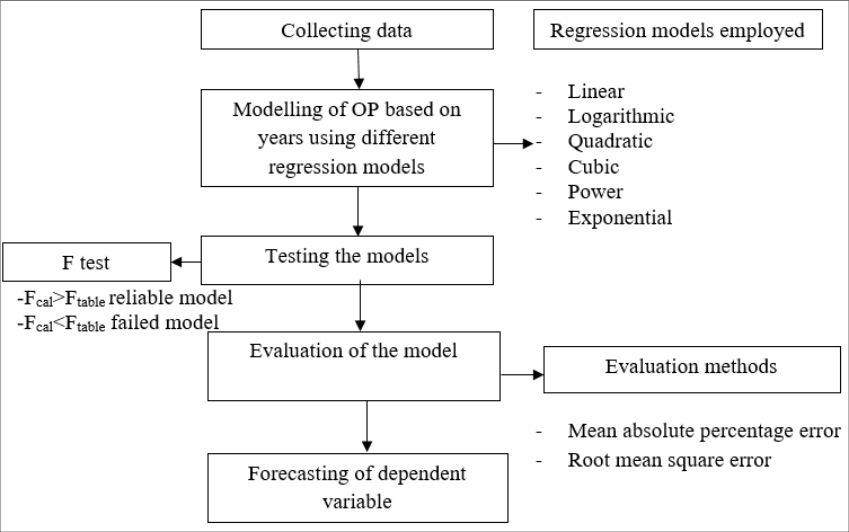 Figure 2
 Table 2
 Table 3
 Table 4
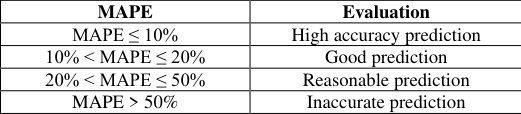 Table 5
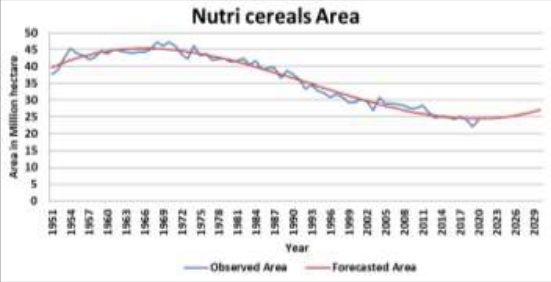 Figure 3
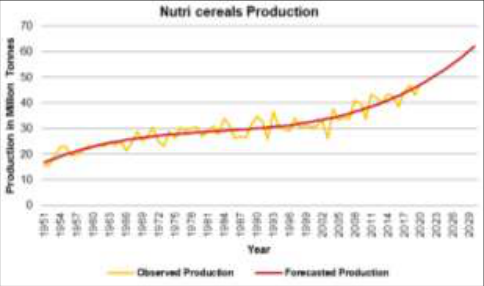 Figure 3
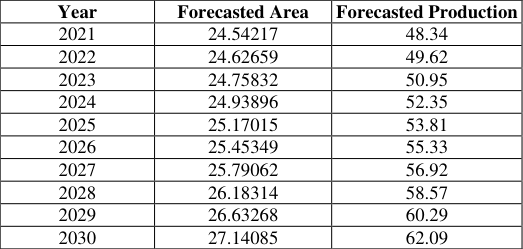 Table 6
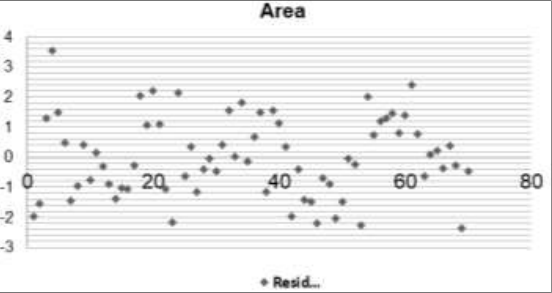 Figure 4
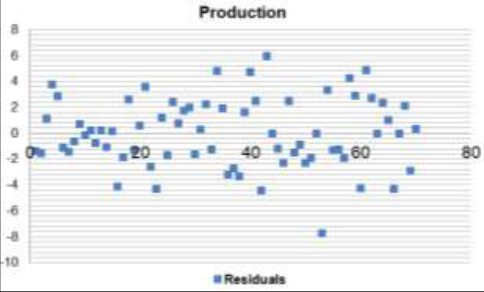 Figure 4
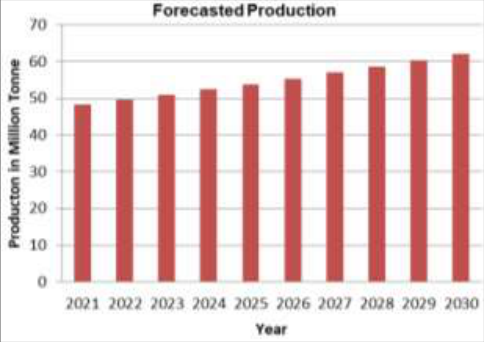 Figure 5
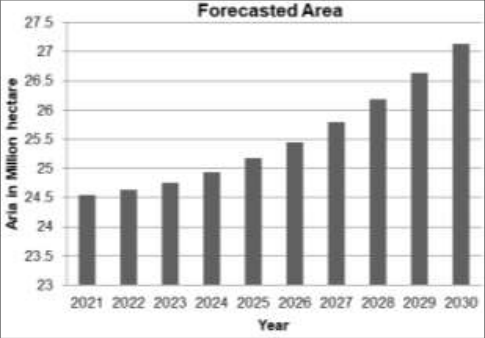 Figure 5
Introduction
The class of cereals like Sorghum (Jowar), barnyard millet (Sawa/Jhangora), kodo millet (Kodo), Pearl Millet (Bajra), etc., which are made of small seed and are placed in the Poaceae family. It is an important fact that our country, India, is termed as the original home of nutri cereals. Nutri cereals are tolerant to drought and other extreme weather conditions and it require only low inputs of fertilizers and pesticides. Almost there are thirty-five species of grasses from which 20 genera falls in the group called as small millets (https://nutricereals.dac.gov.in/). The world's largest leading producer of nutri cereals is India which almost share34 percent of total production all over the world [2] . A Nutri cereal is covering almost about 60 percent of gross cropped area of India [3] . During 2016-17, 14.72 million ha of land area in India was cultivated under nutri-cereal crops. Rajasthan is the leading state in India for nutri-ceral production which is approximately 4.515 million tonnes of nutri cereals which is 28 percent of total nutri cereals production [4] . In nutri cereals, Ragi has the highest mineral content [5] . In data science, regression plays a pivotal role in predicting different continuous targets such that it is not overemphasized and considered as ubiquitous task in practical and perception terms. Even nowadays, the studies related to regression methods are thoroughly inspected by researchers since it get maximum recognition in important [6] . In the present study, the nutri cereals area and production was fitted and predicted by regression modelling approach. The main outlook of the studywas application of regression models for forecasting of area and production. The main outcome expected from the current study was to obtain complete sketch about future anticipation on nutri cereals which may help the farmer to make and adopt the plans and also for the government for making related policies.
Data and Methodology Collection of data
The secondary data required for the study pertaining to area, production and yield of nutri cereals in India of 70 years (1951-2020) was collected from the Agricultural Statistics at a Glance 2020, Government of India (GOI) [7] .
*4th Advance Estimates Regression Analysis
In regression analysis, relationship associated between response variable and explanatory variables are obtained after undergoing analysis of the data. In this study, the variables selected for undergoing analysis are year, area and production. Area and production of nutri cereals are considered as response variables and year is recognized as explanatory variable for this study. The different steps undertaken for conducting this study is illustrated asa flow chart in Fig. 2. The collection of data for area and production of nutri-cereals was done for a period of 70 years (1951-2020) from Agricultural Statistics at a Glance 2020, Government of India. The modeling of area and production of nutri-cereals was undergone by using simple regression analysis. The future observation of response variable was predicted using the relationship existed in among an independent and a dependent variable. Therefore, the analysis was conducted with an assumption that the future values predicted for area and production of nutri-cereals would follow the past trend. The easiness and ability to predict any data accessible was told as the main asset of this approach [8,9,11] . Linear regression model:
Quadratic regression model:
Exponential regression model:
Modeling of nutri cereals area and production
The results of the regression analysis using different methods are described in Table 2. The 2 R values lie above 0.969 and 0.870 for fitted regression models, suggested an immense degree of ling among area and years, production and year respectively. The determination coefficients also revealed that only limited percent (0.011-0.010%) of the variation in the area and production are due other unknown factors rather than the predictors (see Eqs. 1to 6). According to model evaluation criterion, cubic model is best fit for forecasting for area and production of nutri-cereals (Eqs. 9 and 10). The validation results of fitted models are described above. The calculated value of F is higher than the F table value which confirmed that Eqs. ( 7) to ( 8) are significant at 95% confidence level. Thus, it was concluded that explanatory variables employed in this study for fitting the regression models for area and production of nutri-cereals are significant.
| Area Model | Parameter | — | — | — | Criteria | — | — | — |
|---|---|---|---|---|---|---|---|---|
| a | b | c | d | R 2 | Adj.R 2 | RMSE | MAPE | |
| Linear | 716.19* | -0.34* | 0.835* | 0.833* | 3.066 | 6.36 | ||
| Logarithmic | 5188.87* | -678.49* | 0.833* | 0.831* | 3.088 | 6.43 | ||
| Quadratic | -22506.50* | 23.05 | -0.01 | 0.917* | 0.914* | 2.185 | 4.87 | |
| Cubic | -2133901* | 3213.67* | -1.61* | 0.00* | 0.969* | 0.968* | 1.314 | 3.08 |
| Power | 153.14* | -19.69* | 0.834* | 0.831* | 3.620 | 7.16 | ||
| Exponential | 23.31* | -0.01* | 0.836* | 0.834* | 3.593 | 7.09 |
Table text extracted from the original PDF; superscript letters are shown inline. The original table image is below.
View original table image
Forecasted Cubic model is Area
Forecasted Cubic model is Area
Forecasting Nutri cereals
The MAPE values calculated for cubic model developed for area and production were determined as 3.08 and 7.24 respectively (see Table 2, 3). These results suggested that cubic model which is selected as best forming model can give decent prediction of the area and production of nutri-cereals. The cubic models have MAPE values which indicated that both models developed for area and production of nutricereals are high accuracy prediction models (see Table 2,3). It is also clearly visible in from Fig. 3 that the actual and predicted values for the area and production of nutri-cereals lying very close to each other. The area and production of nutri-cereals predicted using cubic model for the next 10 years are printed in Table 6 and illustrated in Fig. 3 and Fig. 5. The results suggested that the area and production of nutri-cereals may reach up to 27.14 million hectares and 62.09 million tonnes in 2030.
| Year | Forecasted Area | Forecasted Production |
|---|---|---|
| 2021 | 24.54217 | 48.34 |
| 2022 | 24.62659 | 49.62 |
| 2023 | 24.75832 | 50.95 |
| 2024 | 24.93896 | 52.35 |
| 2025 | 25.17015 | 53.81 |
| 2026 | 25.45349 | 55.33 |
| 2027 | 25.79062 | 56.92 |
| 2028 | 26.18314 | 58.57 |
| 2029 | 26.63268 | 60.29 |
| 2030 | 27.14085 | 62.09 |
Table text extracted from the original PDF; superscript letters are shown inline. The original table image is below.
View original table image
Conclusions
In this study, the regression modelling approach was used for predicting the area and production of nutri-cereals, which are defined for the prosperity of farmers in decision making and also helps the government in making of policy related to agriculture. The following are the main outcomes of the study: The study concluded that the cubic regression model outperformed all other models used in this study.
The determination coefficients for the training data sets of area and production of nutri-cereals are 0.969 and 0.870 respectively, which indicated that fitted models are highly reliable. The F test showed a statistically significant result for the cubic model fitted for the area and production of nutricereals. The small values for MAPE and RMSE for the fitted models also concluded that best selected cubic model have high accuracy.
In future, the researchers must undergo the application of other models like artificial intelligence, grey theory forecasting, hybrid approach, multiple linear regression and other econometric methods for modelling the area and production of nutri-cereals. The results derived from the
Figures and tables from the paper
| Year | Area | Production | Year | Area | Production | Year | Area | Production |
|---|---|---|---|---|---|---|---|---|
| 1951 | 37.67 | 15.38 | 1975 | 43.15 | 26.13 | 1999 | 29.34 | 31.34 |
| 1952 | 38.88 | 16.09 | 1976 | 43.80 | 30.41 | 2000 | 29.34 | 30.33 |
| 1953 | 42.45 | 19.61 | 1977 | 41.94 | 28.88 | 2001 | 30.26 | 31.08 |
| 1954 | 45.37 | 22.97 | 1978 | 42.28 | 30.02 | 2002 | 29.52 | 33.38 |
| 1955 | 43.92 | 22.82 | 1979 | 42.23 | 30.44 | 2003 | 26.99 | 26.07 |
| 1956 | 43.45 | 19.49 | 1980 | 41.36 | 26.97 | 2004 | 30.80 | 37.60 |
| 1957 | 42.02 | 19.87 | 1981 | 41.78 | 29.02 | 2005 | 29.03 | 33.46 |
| 1958 | 42.91 | 21.23 | 1982 | 42.45 | 31.09 | 2006 | 29.06 | 34.07 |
| 1959 | 44.66 | 23.18 | 1983 | 40.43 | 27.75 | 2007 | 28.71 | 33.02 |
| 1960 | 43.79 | 22.87 | 1984 | 41.71 | 33.90 | 2008 | 28.48 | 40.75 |
| 1961 | 44.96 | 23.74 | 1985 | 39.21 | 31.17 | 2009 | 27.45 | 40.04 |
| 1962 | 44.73 | 23.22 | 1986 | 39.47 | 26.20 | 2010 | 27.68 | 33.55 |
| 1963 | 44.29 | 24.63 | 1987 | 39.74 | 26.83 | 2011 | 28.34 | 43.40 |
| 1964 | 43.93 | 23.72 | 1988 | 36.55 | 26.36 | 2012 | 26.42 | 42.01 |
| 1965 | 44.35 | 25.37 | 1989 | 38.68 | 31.47 | 2013 | 24.76 | 40.04 |
| 1966 | 44.34 | 21.42 | 1990 | 37.69 | 34.76 | 2014 | 25.22 | 43.29 |
| 1967 | 45.09 | 24.05 | 1991 | 36.32 | 32.70 | 2015 | 25.17 | 42.86 |
| 1968 | 47.34 | 28.80 | 1992 | 33.42 | 25.99 | 2016 | 24.39 | 38.52 |
| 1969 | 46.24 | 25.18 | 1993 | 34.42 | 36.59 | 2017 | 25.01 | 43.77 |
| 1970 | 47.24 | 27.29 | 1994 | 32.82 | 30.82 | 2018 | 24.29 | 46.97 |
| 1971 | 45.95 | 30.55 | 1995 | 32.17 | 29.88 | 2019 | 22.15 | 43.06 |
| 1972 | 43.57 | 24.60 | 1996 | 30.88 | 29.03 | 2020 | 24.02* | 47.48* |
| 1973 | 42.21 | 23.14 | 1997 | 31.81 | 34.11 | |||
| 1974 | 46.24 | 28.83 | 1998 | 31.05 | 30.40 |
Table text extracted from the original PDF; superscript letters are shown inline. The original table image is below.
View original table image
| Production Model | Parameter | — | — | — | Criteria | — | — | — |
|---|---|---|---|---|---|---|---|---|
| a | b | C | d | R 2 | Adj.R 2 | RMSE | MAPE | |
| Linear | -616.071* | 0.326* | 0.809* | 0.806* | 3.199 | 8.93 | ||
| Logarithmic | -4874.36* | 645.887* | 0.808* | 0.805* | 3.208 | 8.93 | ||
| Quadratic | 8057.86* | -8.413 | 0.002 | 0.821* | 0.815* | 3.098 | 8.93 | |
| Cubic | -1956537* | 2960.369* | -1.493* | 0.0002* | 0.870* | 0.864* | 2.637 | 7.24 |
| Power | -160.995* | 21.646* | 0.814* | 0.814* | 3.089 | 8.89 | ||
| Exponential | -18.266* | 0.011* | 0.814* | 0.811* | 3.084 | 8.89 |
Table text extracted from the original PDF; superscript letters are shown inline. The original table image is below.
View original table image
| Validation test | Regression type | — | — | — | — | — |
|---|---|---|---|---|---|---|
| Linear | Logarithmic | Quadratic | Cubic | Power | Exponential | |
| t (area) | 345.90 | 339.96 | 367.90 | 707.54 | 340.42 | 347.25 |
| t (production) | 287.25 | 285.58 | 153.28 | 147.24 | 297.54 | 297.19 |
Table text extracted from the original PDF; superscript letters are shown inline. The original table image is below.
View original table image
| MAPE | Evaluation |
|---|---|
| MAPE ≤ 10% | High accuracy prediction |
| 10% < MAPE ≤ 20% | Good prediction |
| 20% < MAPE ≤ 50% | Reasonable prediction |
| MAPE > 50% | Inaccurate prediction |
Table text extracted from the original PDF; superscript letters are shown inline. The original table image is below.
View original table image
References
6 in the original paper- Website: https://ipad.fas.usda.gov/cropexplorer/cropview/commodi tyView.aspx?cropid=0459100&sel_year=2018&rankby= Production
- Anbukkani P, Balaji SJ, Nithyashree ML. Production and consumption of minor millets in India-A structural break analysis. Annals of Agricultural Research. New Series. 2017;38(4):1-8.
- Altman N, Krzywinski M. Simple linear regression. Nature Methods. Energy Sources. 2015;12(11):999-1000.
- Kone CA, Buke T. Forecasting of CO 2 emissions from fuel combustion using trend analysis. Renew. Sustain. Energy Rev. 2010;14:2906-2915.
- Aydin G. The application of trend analysis for coal demand modeling. Energy Sources Part B. 2015;10:183191.
- Yadav RS, Mehta V, Tiwari A. An application of time series ARIMA forecasting model for predicting nutri cereals area in India. The Pharma Innovation Journal. 2022;11(3):1260-1267.
Cited by 1
From OpenAlex, OpenCitations and reference lists read by Scinovex
- Forecasting pearl millet area and production in India using regression models
Pooja ., Rajendra Prasad Kaushal, Abhay Kumar Yadav · International Journal of Statistics and Applied Mathematics · 2026
Estimating crop production and forecasting crop area are the key to taking the necessary actions to preserve food security and solve environmental issues. Crop production forecasting is the skill of predicting a crop's future values before it is harvested. The primary goal of this study was to get a precise picture of India's pearl millet output and area. One of the four major cereals rice, maize, sorghum, and millets grown in tropical semi-arid regions of the world, mostly in Africa and Asia, is pearl millet (Pennisetum glaucum), sometimes referred to as bajra. In northwest India, pearl mille