
Research article · 2023 · Full text
International Journal of Statistics and Applied MathematicsWeather forecasting through mathematical ability
Volume 8(2) · Pages 83–89 · DOI: 10.22271/maths.2023.v8.i2b.956 ↗
Research areasSolar Radiation and PhotovoltaicsComputational Physics and Python ApplicationsMeteorological Phenomena and Simulations
Abstract
Author-writtenMathematics plays a fundamental role in forecasting the weather. Numerical weather prediction uses mathematical models of the atmosphere and oceans to predict the weather based on current weather conditions. Since the advent of supercomputers & weather satellites, forecasting weather has become more accurate. In this article, it is discussed how the advent of mathematics in weather forecasting has made it precise and reliable on a global scale. This paper tries to bring out a best sample to find reliable output with these parameters. The major factors are considered as predictors for the mathematical model formulation.
Summary
Source-checkedPlain-language reading of the full paper, prepared with AI and checked against the text. Each point links to the authors' own words.
Why it matters
- Accurate weather forecasting is essential because it allows communities to better prepare for the impacts of changing weather on daily life. View evidence ↗
- Weather factors such as wind, heavy rain, floods, and extreme heat impact public health, safety, trade, agriculture, and aviation. View evidence ↗
- Mathematics is fundamental to weather forecasting, specifically through numerical weather prediction which uses models of the atmosphere and oceans. View evidence ↗
The question
- The paper aims to discuss how mathematics has made weather forecasting more precise and reliable globally and seeks to identify a best sample for reliable output. View evidence ↗
What they did
- Weather data is collected using tools including IoT sensors, weather balloons, and weather radar. View evidence ↗
- Data from doppler radar, radiosondes, buoys, and satellites are integrated into National Weather Service (NWS) numerical forecast models. View evidence ↗
- Weather models employ 3D grids and systems of differential equations based on physics laws, including thermodynamics, fluid motion, chemistry, and radiative transfer. View evidence ↗
- Statistical hypothesis tests discussed in the paper typically utilize a 5% level of significance. View evidence ↗
What they found
- The spectral method provides more accurate results than the finite difference method, although the latter is more commonly used due to ease of implementation. View evidence ↗
- Despite advancements in supercomputing, the predictive skill of numerical weather models is limited to approximately six days. View evidence ↗
- Solar tsunamis (magnetohydrodynamic waves) can reach heights of roughly 100,000 km and travel at speeds up to 901,000 km/h. View evidence ↗
What it means
- The author concludes that 95% accuracy can be achieved through scientific predictions based on the latest various samples collected from identical topological conditions and applied to large samples. View evidence ↗
- The author suggests that future forecasts will become more detailed and that mathematicians may eventually overcome the current two-week limit for long-range forecasting. View evidence ↗
- A stated limitation is that certain theoretical methods for improving forecast quality cannot be implemented because of insufficient computer power. View evidence ↗
Visual summary
1 visualsIllustrations explain the paper; they do not show study data.
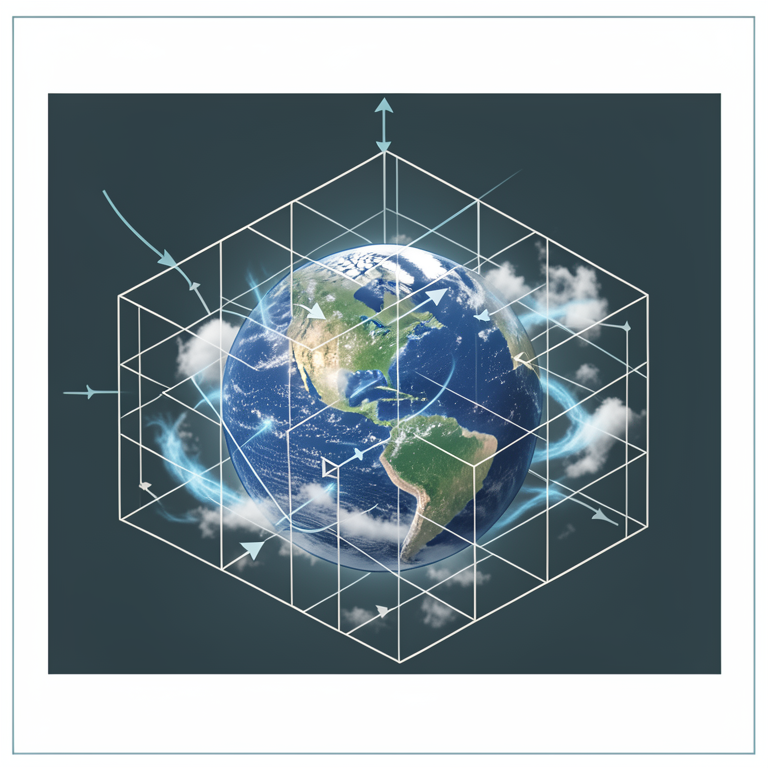
3D Grid Weather Modeling
AI-generated conceptual illustration (Planet Earth with a 3D atmospheric grid). It explains the idea and does not show study data.
View source evidence ↗Figures & tables
From the original paper Figure 1
Introduction
It was Nicolaus Copernicus in the beginning of the sixteenth century who introduced the revolutionary idea that the sun is at the centre of the universe and the earth moves around the sun. Earth is composed of four main layers, starting with an inner core at the planet's center enveloped by the outer core, mantle, and right on top is the crust. The inner core is a solid sphere made of iron and nickel metals about 1221 kilometres (about the distance from Florida to New York City) in radius, according to NASA. It is the innermost layer of our planet, and it plays a crucial role in maintaining the planet's overall stability and magnetic field. Even though it is deep beneath the Earth's surface, the core is an integral part of the planet. However, there might be cause for concern as a study reveals it may have stopped and started spinning in the opposite direction. (NASA). Weather affects people's daily lives and accurate weather forecasting allows communities to better prepare for the impacts of changing weather. Weather forecasting determines the likelihood of a severe weather event or strong storm. By leveraging this information, utilities can strengthen the grid and schools can determine if it's safe for parents to drive their children. The various weather factors viz., wind speed and direction, (strong wind currents at high altitudes (the jet streams, which can affect aircraft speed), Heavy rains (strong rains that have been responsible for some plane crashes), Floods (Floods affecting us all globally every year), Heat and Drought, Precipitation, Humidity, Visibility, Air Quality, Pollutants, Ocean Waves, Tsunami, Strong Storms, Tornadoes, Cyclones, Hurricanes, Earthquakes, etc., that have been responsible for some way or other impacting Public Health, Public Safety, Trade, Commerce, Agriculture (extreme heat and drought can affect Crop Production), Aviation, Weather forecasting became an important tool for Aviation & Naval Aviation, etc. A landmark study has found, the world's forests are losing their ability to absorb carbon due to increasingly 'unstable' conditions caused by humans. Dramatic changes to forests, and other habitats that store carbon in plants and soils, are becoming more likely in some regions across Earth, with less carbon consistently absorbed by the 'land carbon sink' provided by trees, soil and plants, according to scientists writing in Nature.
Global Warming
The surface of the planet is changing, because of consistent global warming, resulting melting glaciers, making rise in the sea-level. Global warming could unleash ancient viruses, like, fear around Zombie virus, that have been lying dormant for millions of years in the frozen earth. According to future estimates based on climate models and ocean-atmosphere physics, the WMO reported that the speed of melting of the largest global ice mass in Antarctica is uncertain. As per the report, Mumbai, Dhaka, London, New York among metros in line of sea-level rise threat.
Multiple Solar Storms
Solar activity is on the rise due to the approaching peak of solar cycle 29. (NASA), updated on 24 th Feb., 2023. Multiple Solar storms are becoming very frequent, as Sun reaches the peak of its solar cycle.
When Earth in the firing line of solar winds, Geomagnetic storm danger increases Dangerous solar winds emanating from the Sun could hit Earth and spark a G1-class Geomagnetic storm. The solar storm was not caused by coronal mass ejections (CME) but by a corotating interaction region (CIR), which opened a hole in the Earth's magnetosphere. A G1-class solar storm is capable of causing shortwave radio blackouts and GPS disruptions. The solar flares are capable of triggering planet-wide radio blackouts and long-lasting radiation storms. And this time, the flare triggered a rare type of shockwave called a solar tsunami or a magnetohydrodynamic wave. This tsunami rippled across the Sun's visible surface in a giant wave of hot plasma capable of travelling up to 901,000 km/h across the solar surface and reaching heights of roughly 100,000 km. Further, the flare also released a Type Il solar radio burst, essentially a stream of mainly ultraviolet and X-ray radiation. This radio burst hit Earth not long after the flare erupted, ionising our planet's upper atmosphere. The above 6 figures, for the year 2022. Solar activity is expected to increase more the closer we get to the peak activity phase of the Sun's 11-year solar cycle in 2025.
Weather forecasts play an important role NOAA runs numerical weather models operationally to predict global weather, seasonal climate, hurricanes, ocean waves, storm surge, flooding and air quality. As gains are made in supercomputing capacity and power, models are upgraded to take advantage of the growing volume of earth observations. Although no single model is accurate 100 percent of the time and observations are imperfect, access to a wide range of models with different abilities, strengths, and characteristics allow scientists to run ensemble forecasts with perturbed initial conditions or physics, helping increase certainty in the prediction. Model agreement leads to higher certainty in forecasts. If the models are not in agreement, forecasters can present that uncertainty to the public. Meteorology is a branch of the atmospheric sciences (which include atmospheric chemistry and physics) with a major focus on weather forecasting.
Atmospheric scientists, including meteorologists study weather, climate, and other aspects of the atmosphere. They develop reports and forecasts from their analysis of weather and climate data. They collect and provide us additional temperature, snowfall and rainfall data. The observational data our ASOS and volunteers collect are essential for improving forecasts and warnings. Also, the team of researchers conducted the study by analyzing seismic waves from earthquakes which have rocked the Earth for the past 60 years.
Data collection
In fact data plays a significant role in every walk of life such as population growth, climate change, weather predictions and many more.
Equipments used
Meteorologists at NOAA's National Weather Service have always monitored the conditions of the atmosphere that impact the weather, but over time the equipment they use has changed. As technology advanced, our scientists began to use more efficient equipment to collect and use additional data.
These technological advances enable our meteorologists to make better predictions faster than ever before. The study uses step involves using various tools to collect weather data, such as IoT sensors, weather balloons, and weather radar. Observational data collected by doppler radar, radiosondes, weather satellites, buoys and other instruments are fed into computerized NWS numerical forecast models. The models use equations, along with new and past weather data, to provide forecast guidance to our meteorologists. Weather Satellites monitor Earth from space, collecting observational data our scientists analyze. NOAA operates three types of weather satellites. Polar orbiting satellites orbit the Earth close to the surface, taking six or seven detailed images a day. Geostationary satellites stay over the same location on Earth high above the surface taking images of the entire Earth as frequently as every 30 seconds. Deep space satellites face the sun to monitor powerful solar storms and space weather. NOAA also uses data from satellites operated by other agencies and countries.
ISRO receives Indo-US jointly developed NISAR satellite, March, 2023
powerful demonstration of the capability of radar as a science tool and help us study Earth's dynamic land and ice surfaces in greater detail than ever before. NISAR will be the first radar of its kind in space to systematically map Earth, using two different radar frequencies (L-band and S-band) to measure changes in our planet's surface less than a centimeter across. The mission will provide critical information to help manage natural disasters such as earthquakes, tsunamis, and volcanic eruptions, enabling faster response times and better risk assessments. NISAR data will be used to improve agriculture management and food security by providing information about crop growth, soil moisture, and land-use changes. The mission will provide data for infrastructure monitoring and management, such as monitoring of oil spills, urbanization, and deforestation. NISAR will help to monitor and understand the impacts of climate change on the Earth's land surface, including melting glaciers, sea-level rise, and changes in carbon storage. Also, NASA and the Italian Space Agency are partnering on the MAIA mission which will use data from an Earth observation satellite to help scientists find correlations between air pollution and health problems in major cities across the world including New Delhi. Today's forecasts and the improved forecasts of the future are made possible by sustained investments in observing systems, weather and climate models, and the supercomputers that power them.
Data analysis
Analysis of weather patterns involves taking this data and using forecasting models to determine future trends, forecast the temperature, or determine the likelihood of a severe weather event of course, fundamental research both in mathematics and in physics concerning atmospheric processes and the underlying mathematical and physical laws will continue to be crucial for the development of better forecasting models.
Mathematical models
Mathematicians can use data and modelling to assess the consequences of global warming. In order to predict future trends, scientists look to the past. For example, ice cores from the Arctic show how carbon dioxide levels have changed over time.
To get to the point, most of today's research in meteorology is devoted to improving current forecasting models. This involves the use of enhanced observation and measurement techniques as well as refining the mathematical models. Several ways to improve forecast quality are already known in theory, but they cannot be implemented due to a lack of computer power. The fastest computers in civilian use are already used by the leading weather services, meaning that many weather services, especially in developing countries, have to resort to much slower computers. Since the 1960s, when issuing numerical weather forecasts calculated by computers on a regular basis begun, forecast accuracy has been accompanied by the development of faster computers, and it seems that this will be the case for the foreseeable future. Mathematics plays a fundamental role in forecasting the weather. Numerical weather prediction uses mathematical models of the atmosphere and oceans to predict the weather based on current weather conditions. The two different types of forecasting models, one of them based on finite differences, the other one based on the spectral method, are currently competing as to which one of them yields more accurate forecasts for a given computational cost. But at the end of the day, each model has its strengths and weaknesses; so using both models side by side will probably give the best results. In the future, weather forecasts will be even more accurate and more detailed than forecasts nowadays. And who knows, maybe one day mathematicians will find a way to overcome the two weeks forecasting limit, so that long-range forecasts can be produced. Weather models use systems of differential equations based on the laws of physics, which are in detail fluid motion, thermodynamics, radiative transfer, and chemistry, and use a coordinate system which divides the planet into a 3D grid. Winds, heat transfer, solar radiation, relative humidity, phase changes of water and surface hydrology are calculated within each grid cell, and the interactions with neighbouring cells are used to calculate atmospheric properties in the future. Mathematical models based on the same physical principles can be used to generate either short-term weather forecasts or longer-term climate predictions; the latter are widely applied for understanding and projecting climate change. The improvements made to regional models have allowed for significant improvements in tropical cyclone track and air quality forecasts; however, atmospheric models perform poorly at handling processes that occur in a relatively constricted area, such as wildfires. Manipulating the vast datasets and performing the complex calculations necessary to modern numerical weather prediction requires some of the most powerful supercomputers in the world. Even with the increasing power of supercomputers, the forecast skill of numerical weather models extends to only about six days. Factors affecting the accuracy of numerical predictions include the density and quality of observations used as input to the forecasts, along with deficiencies in the numerical models themselves. Post-processing techniques such as model output statistics (MOS) have been developed to improve the handling of errors in numerical predictions. The two different types of forecasting models, one of them based on finite differences, the other one based on the spectral method, are currently competing as to which one of them yields more accurate forecasts for a given computational cost. But at the end of the day, each model has its strengths and weaknesses; so using both models side by side will probably give the best results. The spectral method gives much more accurate results than the finite difference method. Many weather services still use the finite difference method though because it is much easier to implement.
The usefulness of Sampling, Correlation & Regression, has been discussed in this paper, at length, so as to signify the importance of forecasting accuracy Sampling This statistical data helps to contrive a mathematical model. These inputs should be considered with care since it may lead to a catastrophic error if they are formulated improperly Also, Processing a huge set of data costs more time and money. Since weather prediction needs more accuracy and it has to deal with large volume of statistical data, formulation of mathematical model and choosing appropriate sampling method turns out to a challenge [10] . Sampling should be done, to check reliability of the predictions, with less cost and less time. Meteorologists need multiple datasets to make the best predictions possible. Meteorologists need multiple datasets to make the best predictions possible.
Tests of significance
Tests of Significance are the tests of significance of Statistical hypothesis. We test whether the difference between the sample proportion (or values) and the population proportion (or values) is so small as could be due to fluctuations of sampling or large enough as to signify evidence against the hypothesis. For this, we follow the six step procedure, as given below :
Step 1: Null hypothesis: We set up an hypothesis about the population. This hypothesis is called the null hypothesis. Since it asserts that there is no difference between the sample and the population regarding the particular matter under consideration.
Step 2: Alternative hypothesis: Contrary to Null Hypothesis is Alternative Hypothesis
Step 3: α: Level of significance or amount of risk: The probability level below which we reject the hypothesis is called the level of significance. Usually we take 5% level of significance. Step 6: Inference or Judgement If z 0 ∉ W, Accept H 0 at α. If z 0 ∈ W, Reject H 0 at α. 1. If z 0 > 1.96 (W is significant). 2. If z 0 > 3 (W is highly significant).
Confidence Limits or Fiducial Limits
The values x̄ -1.96 σ / √n and x̄ + 1.96 σ / √n are called fiducial limits Or confidence limits for the mean of the population corresponding the given sample.
Confidence Interval
The interval x̄ -1.96 σ / √n to x̄ + 1.96 σ / √n is called confidence interval.
Probable Limits
Where Var (X) stands for Variance of X.
Note:
To compute these probable limits, we use the sample estimate p for P which generally proves to be satisfactory for N ≥ 30. Probable limits are always found when Null hypothesis is rejected. Now we can define sampling as a process through which we choose a smaller group to collect data that can be the best representative of the population. We can extend our results obtained from the sample group to the entire population. There are a number of ways in which the sampling process can be carried out. As an example, if tested on a sample of 1000 data collected & 5195 data values give the inclination for a particular weather factor, say rainfall, one can apply this test, to conclude or draw the inference, whether the prediction is unbiassed one or not. The predictions could be made, based on 5%, level of risk [1]. The probable error and Standard error could also be determined.
Test 2: To test the difference between two sample proportions, from two populations: p 1 and p 2 = proportions of two large samples of an attribute 'A'. n 1 and n 2 = sample sizes of two samples.
Under the Null hypothesis, P 1 = P 2 = P (say)
As an example, if tested on a sample of 500 data collected from Town A, 200 data values are in favour of a rain prediction & 400 data collected from town B, 250 are in favour of the same weather prediction, namely rainfall, as that of town A, where, Town A & town B, both chosen from same region. The test could be applied to discuss whether the data reveal a significant difference between the samples of Towns A and B, so far as the proportion of specific weather factor is concerned. To conclude or draw the inference, whether the weather forecast is unbiassed one or not, the appropriate sampling test could be applied, based on 5%, level of risk.
Test 3: To test the significance of the difference between x̄ and μ, where σ is known: z = (x̄ ~ μ) / (σ / √ n) x̄ = sample mean μ = population mean S.E = σ / √ n As an example, if a sample of 400 data values have given average to a particular weather factor say, 67.47.Can it be reasonably be regarded as sample from large population with mean 67.39 and S.D 1.30 ? If yes, then the results could be predicted accurately, though with 5% level of risk [1]. S.E = √ (σ 1 2 / n 1 + σ 2 2 / n 2)
As an example, if the means of two single large samples of 1000 & 2000 data values are 67.5 and 68.0 respectively, in favour of a particular weather factor, can the samples be regarded as drawn from the same population [same region], of S.D 2.5 ? Again, it could be tested at 5 % level of significance. The above large sample tests could be proved very useful, as data is collected from the weather satellites and processed through Super computer's, and applied by a well equipped Statistician.
Some relevant, useful, efficient & accurate small sample tests for weather forecast, are discussed below 5. Correlation & Regression
Atmospheric scientists must understand the mathematics used to develop models for weather forecasts and to calculate relationships [6,7] , between atmospheric properties, such as how changes in air pressure may affect air temperature. Mathematicians can use data and modelling to assess the consequences of global warming. In order to predict future trends, scientists look to the past. For example, ice cores from the Arctic show how carbon dioxide levels have changed over time.
96, the difference is significant at 5 % level, i.e., t 0 ∈ W or W is significant. Null hypothesis will be rejected in this case.
As an example, the correlation coefficient 0.90 from a sample of 28 pairs. It could be tested whether this value of r differs significantly from ρ = 0.84 ?
Contingency Table
Let the data be classified into p classes, A 1 , A 2 , …., A p , according to the attribute A, and q classes, B 1 , B 2 , …., B q , according to the attribute B, so that there will be p q classes, according to both the attributes A & B.
Let O i j denotes the cell frequency of the cell, belonging to both the classes A i and B j. ; i = 1, 2, ….., p ; j = 1, 2, ….., q. Let (A i) and (B j. ) be the totals of the frequencies belonging to both the classes A i and B j respectively. Then the data can be set out in the form of the
Conclusion
With rapidly changing Environment conditions globally, the weather predictions have become more challenging.
Only scientific predictions, based on very latest, various samples collected, from same topoligically conditions, applied on large samples, could be the answer, with 95% accuracy. Since the advent of supercomputers, forecasting weather has become more accurate. They have made the job more precise, a lot quicker and are used extensively by the National Oceanic and Atmospheric Administration (NOAA) to predict nearperfect weather. All this helps our meteorologists create more accurate forecasts and faster than ever before.
In the future, weather forecasts will be even more accurate and more detailed than forecasts nowadays. And who knows, maybe one day mathematicians will find a way to overcome the two weeks forecasting limit, so that long-range forecasts can be produced. These early warnings not just prevent life loss, but also curbs extensive property damage and aids in swift recovery.
Figures and tables from the paper
References
3 in the original paper- Helton JC, Johnson JD, Sallaberry CJ, Storlie CB. Survey of sampling-based methods for uncertainty and sensitivity analysis. Reliability Engineering & System Safety. 2006;91(10):1175-1209.
- Matala A. 60968U (20.5.2008) on Sample Size Requirement for Monte Carlo -simulations using Latin Hypercube Sampling Helsinki University Of Technology, Department of Engineering Physics and Mathematics, Systems Analysis Laboratory Mat-2.4108 Independent Research Projects in Applied Mathematics; c2008.
- Santhi B, Yasir M, Christopher NS. Study of uncertain weather data using different Sampling methods, International Journal of Engineering & Technology. 2013;5(3):2884-2890.