
Research article · 2021 · Full text
International Journal of Veterinary Sciences and Animal HusbandryRelationships between body conformation, hematological, and serum biochemical parameters in Kiko and Nubian goat bucks under a semi-intensive management system
Volume 6(5) · Pages 20–30 · DOI: 10.22271/veterinary.2021.v6.i5a.378 ↗
Research areasAnimal Diversity and Health StudiesGenetic and phenotypic traits in livestockLivestock Management and Performance Improvement
Abstract
Author-writtenThe objective of this study was to investigate breed and body conformation influences on the serum biochemical and hematological parameters of Kiko-meat and Nubian-dairy goat bucks. Most body conformation traits were significantly higher (P
Summary
Source-checkedPlain-language reading of the full paper, prepared with AI and checked against the text. Each point links to the authors' own words.
Why it matters
- Meat and dairy goat production in the southeastern United States is challenged by warm, humid conditions that favor gastrointestinal parasites. View evidence ↗
- Blood parameters, including hematology and serum biochemistry, reflect an animal's physiological, nutritional, and pathological status, as well as the effects of their diet. View evidence ↗
- Because blood parameters vary significantly between goat breeds, it is difficult to create a single universal metabolic profile test. View evidence ↗
The question
- The study aimed to investigate how breed and body conformation influence the serum biochemical and hematological parameters of Kiko meat goats and Nubian dairy goats in southeast Alabama. View evidence ↗
What they did
- The study used 15 healthy Kiko bucks (9-12 months old) and 15 Nubian bucks (7-9 months old) under a semi-intensive management system. View evidence ↗
- Bucks grazed on tall fescue and bermudagrass pastures, with ad libitum bermudagrass hay and a daily supplement of 341 g of alfalfa and corn. View evidence ↗
- Body conformation was assessed via body weight, subjective body condition scores (1-5), and measurements of shoulder width, chest girth, body length, hip width, and height at wither. View evidence ↗
- Blood was collected via jugular venipuncture, then centrifuged at 3000 rpm for 15 minutes to obtain serum for analysis. View evidence ↗
What they found
- Kiko bucks exhibited significantly higher hematocrit (41.6%, P<0.05) and hemoglobin levels (up to 12.4 g/dl) compared to Nubian bucks. View evidence ↗
- Kiko bucks had a higher maximum red blood cell count (24.3 M/µl) than Nubian bucks (19.4 M/µl). View evidence ↗
- Nubian bucks had significantly higher total calcium levels (9.3 mg/dL) than Kiko bucks (8.4 mg/dL). View evidence ↗
- Kiko bucks had significantly higher creatinine levels (0.80 mg/dL) than Nubian bucks (0.48 mg/dL) (P<0.01). View evidence ↗
What it means
- The authors conclude that assessing the nutritional status of goats in pasture systems requires combining blood biochemical profiles with traditional body conformation traits. View evidence ↗
- The authors state this is a preliminary study intended to serve as a reference for establishing breed-specific values to help veterinarians interpret lab data and select treatments. View evidence ↗
Visual summary
2 visualsIllustrations explain the paper; charts are replotted from the paper's own table values.
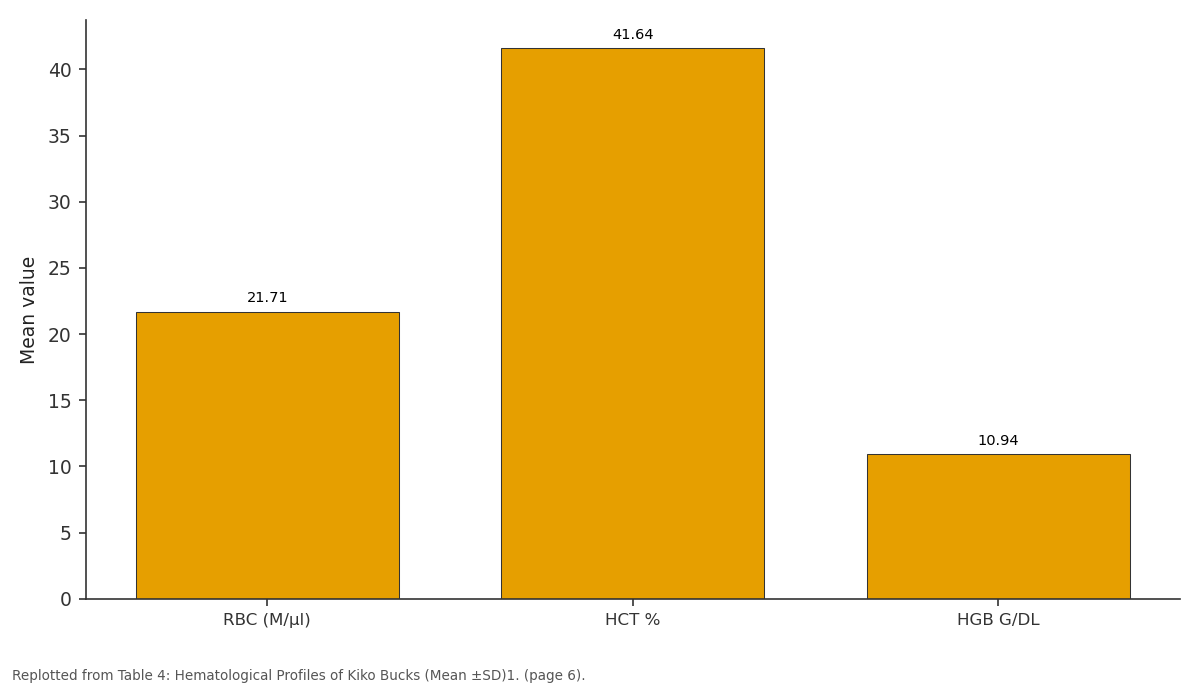
Mean: RBC (M/µl) vs HCT % vs HGB G/DL
Replotted from Table 4 (page 6) of the original paper. Every bar is the paper's own table value.
View source evidence ↗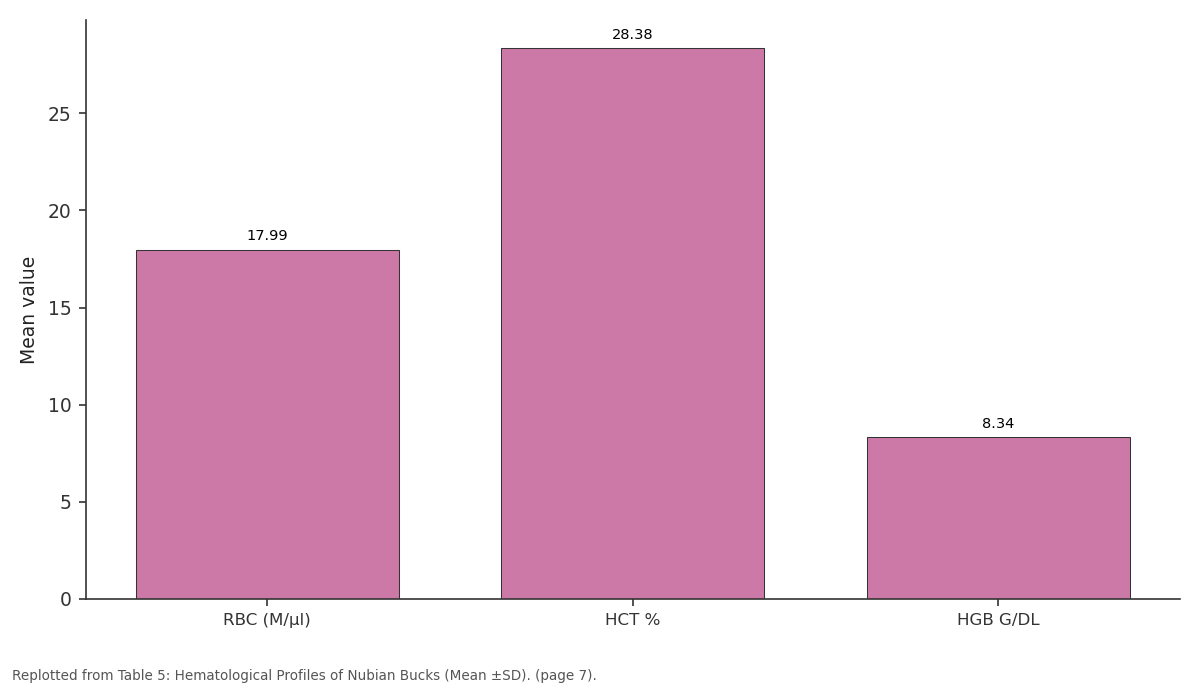
Mean: RBC (M/µl) vs HCT % vs HGB G/DL
Replotted from Table 5 (page 7) of the original paper. Every bar is the paper's own table value.
View source evidence ↗Figures & tables
From the original paper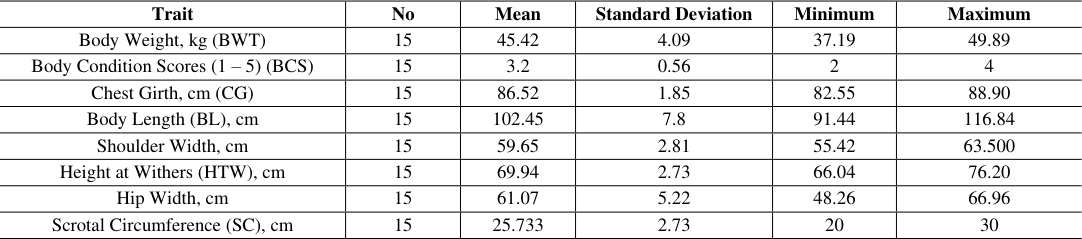 Table 1
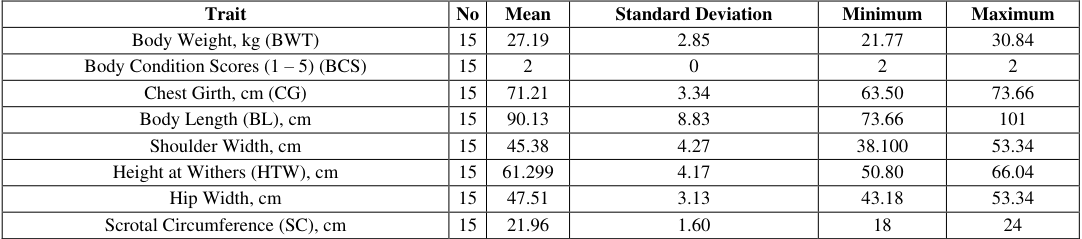 Table 2
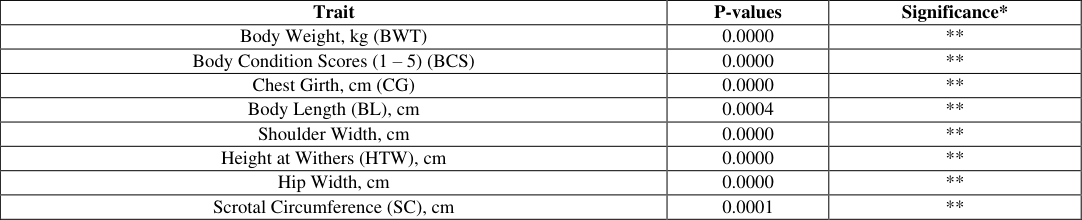 Table 3
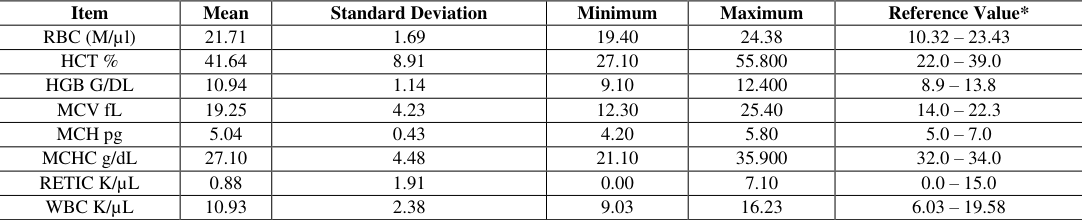 Table 4
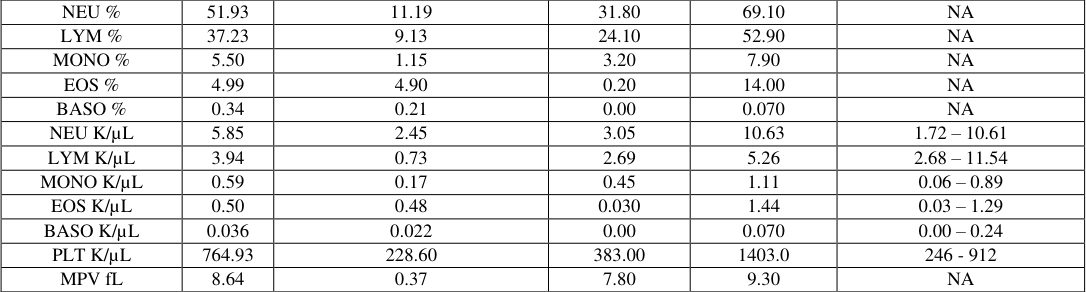 Table 5
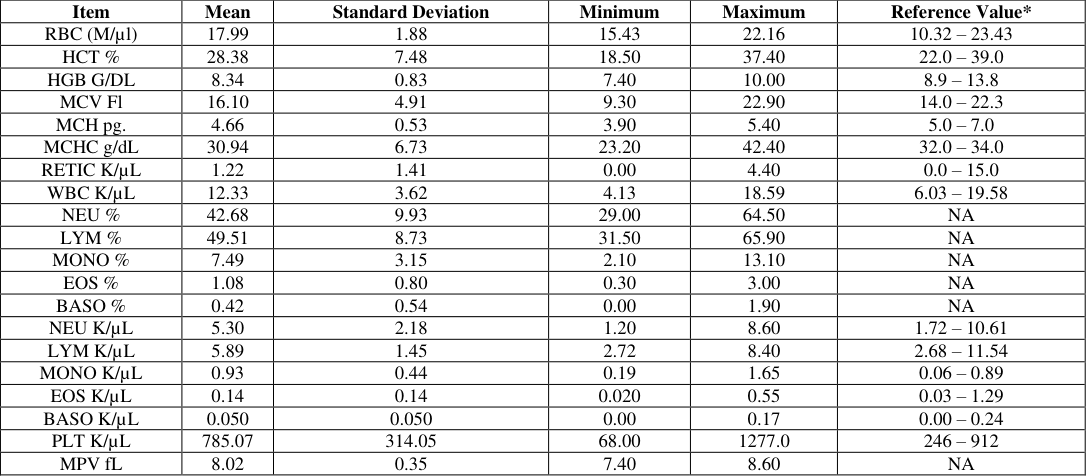 Table 5
 Table 6
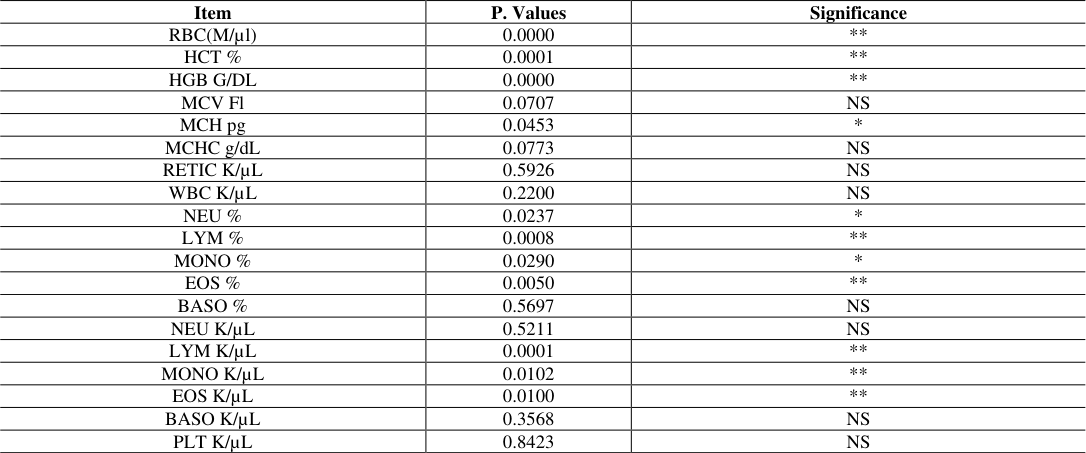 Table 6
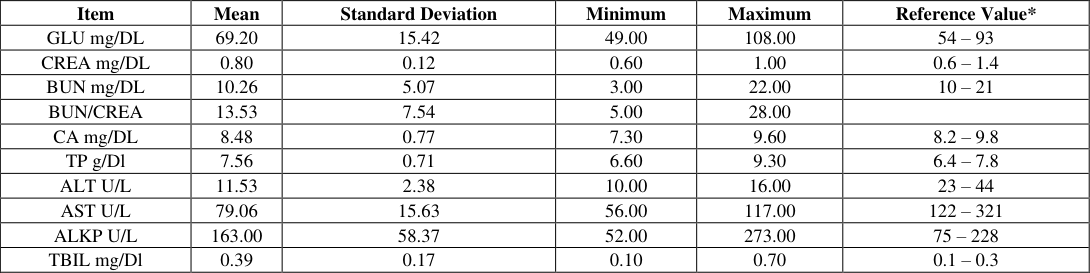 Table 7
 Table 8
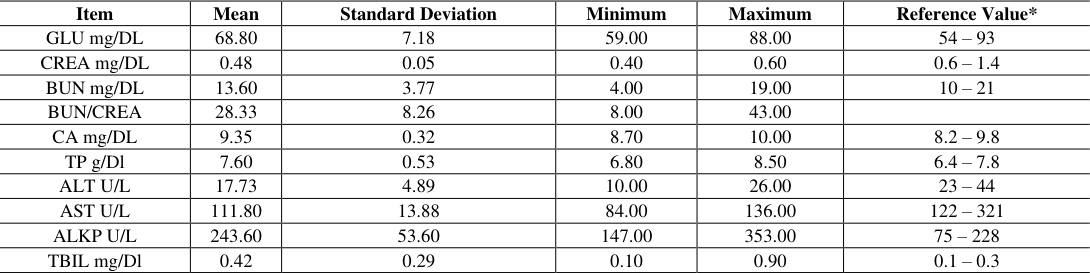 Table 8
 Table 9
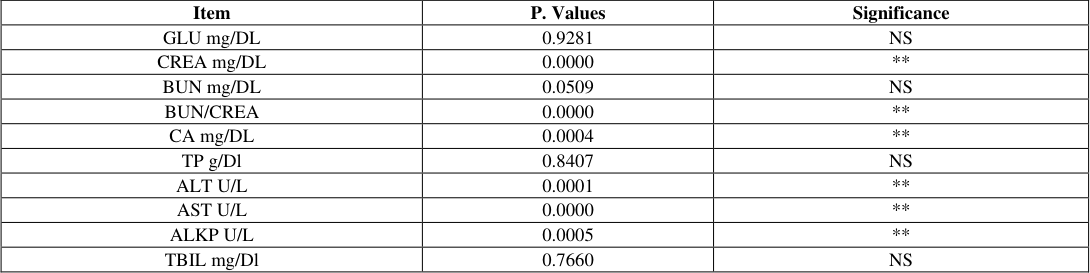 Table 9
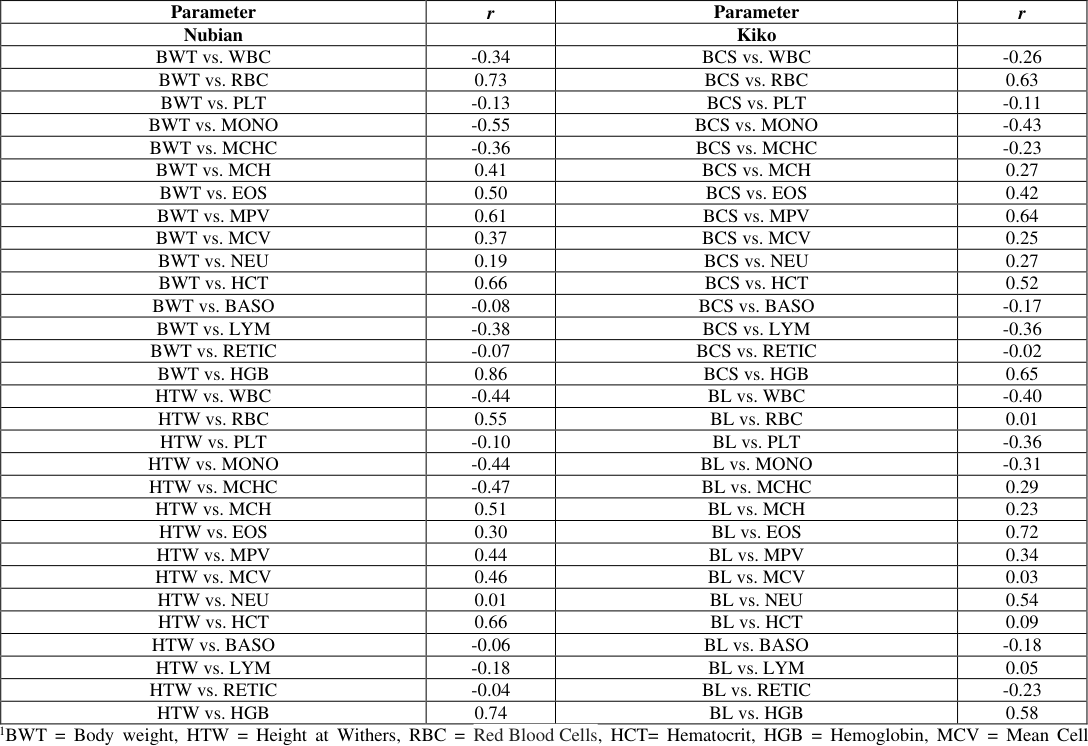 Table 10
 Table 11
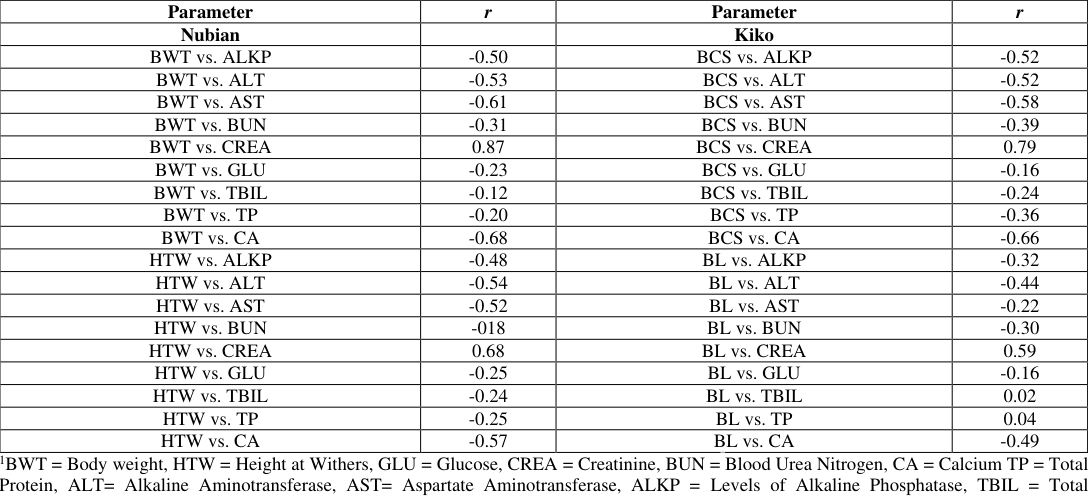 Table 11
Introduction
In southeast United States, efficient meat and/or dairy goat production is difficult because warm, humid pasture conditions are optimum for gastrointestinal parasites. Internal parasites represent the greatest threat to goat productivity, health, and survival (Solaiman, 2007) [51] . Kiko breed of meat goat was developed in New Zealand and introduced to the US. The composite Kiko breed resulted from a series of crosses involving feral does and varying breeds of dairy bucks (Batten et al. 1987) [10] . Anglo-Nubian goats were developed in England by crossing British goats with bucks of African and Indian origin (Briggs, et al. 1980) [14] . The Anglo Nubian is an all-purpose goat, useful for meat, milk and hide production. Blood act as a pathological reflector of the status of the exposed animals to toxicants and other conditions. The examination of blood provides the opportunity to clinically investigate the presence of metabolites and other constituents in the body of animals and it plays a vital role in the physiological, nutritional and pathological status of an animal. The hematological and serum biochemical parameters are often a reflection of the effects of dietary treatment on the animals in terms of the type and amount of feed ingested and were available for the animals to meet its physiological and metabolically necessities (Pradhan, 2016) [45] , also the level of antinutritional element factors present in the feed will also influence the hematological and biochemical values (Awodi et al. 2005) [8] . There is a great variation in the hematological and serum biochemical parameters observed between breeds of goats (Pradhan, 2016) [45] , and this regard, it may be difficult to formulate a universal metabolic profile test for goat. These differences have further underlined the need to establish appropriate physiological baseline values for various breeds of goats in Alabama, which could help in the realistic evaluation of the management practice, nutrition and diagnosis of their health condition.
Hematological studies are useful in the diagnosis of many diseases as well as investigation of the extent of damage to blood (Onyeyili, et al. 1992; Togun et al. 2007) [40,56] . Hematological studies are of ecological and physiological interest in helping to understand the relationship of blood characteristics to the environment (Ovuru and Ekweozor, 2004) [43] and so could be useful in the selection of animals that are genetically resistant to certain diseases and environmental conditions (Mmereole, 2008) [32] . As reported by Isaac et al. (2013) animals with good blood composition are likely to show good performance. Laboratory tests on the blood are vital tools that help detect any deviation from normal in the animal or human body (Ogunbajo et al, 2009) [37] . The examination of blood gives the opportunity to investigate the presence of several metabolites and other constituents in the body of animals and it plays a vital role in the physiological, nutrition and pathological status of an organism (Aderemi, 2004) [4] . According to Olafedehan et al. (2010) [38] , examining blood for their constituents can provide important information for the diagnosis and prognosis of diseases in animals. Blood constituents change in relation to the physiological conditions of health (Togun et al. 2007) [56] . These changes are of value in assessing response of animals to various physiological situations (Khan and Zafar, 2005) [27] . According to Afolabi et al (2010), changes in hematological parameters are often used to determine various status of the body and to determine stresses due to environmental, nutritional and/or pathological factors. There is considerable information about the normal blood hematological and biochemical parameters the domestic animal species, but the values are expected to vary according to the breeds, different environmental factors and the different methods of management Influence (Ekiz, and Yalcintan, 2013) [23] . Variations exists in hematological and serum biochemical parameters in breeds of goat because of genotype, ages, and gender or livestock production systems. These differences have further underlined the need to establish appropriate physiological baseline values for common breeds of meat goats (Boer Kiko, Spanish) and dairy goats (Anglo-Nubian) in Alabama. The objective of this study was to investigate breed and body conformation influences on the serum biochemical and hematological parameters of Kiko-meat and Nubian-dairy goats managed under semi-intensive production system in south east Alabama, and establish reference values that can be used to aid veterinarians and producers in the interpretation of the laboratory data and for the selection of the appropriate treatment for meat and dairy goats in the region.
Materials and Methods
Materials and Methods
Animal Management
This study was conducted at the Caprine Research and Education Unit of the George Washington Carver Agricultural Experiment Station at Tuskegee University, Tuskegee, Alabama (32.43N, 85.71W). Tuskegee is located in the southeastern region of the United States, sits 183 m above sea level, and has an annual precipitation amount of 1222 mm. The Tuskegee University Animal Care and Use Committee approved herd management protocol used in this project. For this project, mature and healthy Kiko bucks (n = 15; body weight (BWT) = 45. 4± 2.0 kg; age = 9-12 months, Nubian bucks (n= 15; BWT = 21.9± 2.8 kg; age = 7-9 months) semi intensively managed bucks were utilized. Bucks were strategically dewormed twice during the research period. All animals were managed on tall fescue (Festuca arundinacea) and bermudagrass (Cynodondactylon) pastures, and supplemented with bermudagrass hay (Cynodondactylon) for ad libitum consumption. Animals were also supplemented with 341 g/d of alfalfa (17% crude protein, 1.5% crude fat, 30% crude fiber) and corn (7% crude protein, 3% crude fat, 4% crude fiber), and had access to trace mineral salt block.
Body Conformation Measurements
Prior to bleeding, bucks were physically examined. For each animal body weight was recorded using a scale, and body condition scores (BCS) were evaluated subjectively (ranging from 1= emaciated to 5= obese). Shoulder width (SW) was determined with the aid of a tape measure, as the horizontal distance between the processes on the left shoulder and those of the right shoulder blade. Chest girth (CG) was measured with the aid of a measuring tape around the chest, just behind the front legs; body length (BL) was measured from the sternum to the aitch bone and hip width (HW) was measured using a plastic measuring tape, while height at wither (HTW) was measured vertically from thoracic vertebrae to the ground using a metal ruler.
Blood Sampling and Analysis
Blood samples were collected with 18-ga needle by jugular venipuncture. The samples were left to clot and then centrifuged at 3000 rpm for 15 min, and the serum is collected. Serum was kept frozen at -20°C until it was used for the biochemical analysis.
Serum Biochemistry
Serum biochemistry was carried out by using the IDEXX (USA) Catalyst One Automated Chemistry Analyzer which includes the following parameters: Albumin (ALB), alanine aminotransferase (ALT), alkaline phosphatase (ALP), bile acids (BA), cholesterol (CHOL), gamma glutamyl transferase (GGT), total bilirubin (TBIL), and blood urea nitrogen (BUN), aspartate aminotransferase (AST), glucose (GLU), creatinine (CREA), calcium (CA), total protein (TP), and total bilirubin (TBIL) Hematology Hematological profiles were also examined in these bucks of Damascus breed. Blood samples were collected with an 18-ga needle by jugular venipuncture. All samples were analyzed within two hours of collection by using IDEXX (USA) Procyte Dx Automated Hematology Analyzer. The EDTA blood samples were analyzed for total white blood cells (WBC), red blood cells (RBCS), hemoglobin (HGD), hematocrit (HCT), mean corpuscular volume (MCV), mean corpuscular hemoglobin (MCH), mean corpuscular hemoglobin concentration (MCHC) and number of platelets (PLT), neutrophils (N), lymphocytes (L), monocyte (M), eosinophil (E), basophil (B) and red blood cells (RBC), hemoglobin (Hb), mean corpuscular volume (MCV),, red cell distribution width (RDW), mean platelet volume (MPV), procalcitonin (PCT) and platelet distribution width (PDW).
Statistical Analysis
All results are expressed as means ± standard deviation (SD). SAS 2012 ® statistical software was used to calculate the minimum and maximum values to determine the range, mean, standard deviation of the mean. The effects of breed on biochemical parameters and hematology profiles of bucks were analyzed by one-way analysis of variance (ANOVA) using SAS 2012 ® statistical software. If ANOVA showed an acceptable level of significance (P<0.05), Duncan Multiple Range Test was applied for post hoc comparison by using the General Linear Model (GLM), procedures of SAS 2012 ®. Pearson's correlation (Statistix 7, 2000) Analytical Software, Tallahassee, FL) was used to calculate correlation coefficient (r) and determine the degree of relationship body conformation traits and serum biochemical or hematological variables in Nubian and Kiko bucks.
Results and Discussion
Results and Discussion
Body Conformation Traits
The mean (± SD) of different linear traits in both Kiko and Nubian bucks is presented in Tables 1 and2 respectively. Measurements of most of the traits were significantly higher (P<0.01, Table 3) in Kiko than in the Nubian bucks (45.4 [5] . It has been found to be very effective in assessing the reproductive efficiency in goats (Bongso et al. 1982) [13] and it provides readily obtainable and informative measure of selection, feeding and healthcare (Thiruvenkanden, 2005) [55] . Bhadula et al, (1979) [49] and is a mode for producers to assess adequate or insufficient poise of nutrition required to sustain a healthy animal for grazing and reproductive efficiency (Treacher et al. 1986) [57] . However, body condition alone cannot be assessed by visual inspection but by palpable evaluation. According to Treacher et al (1986) [57] , three regions, the lumbar region (loin), sternum, and rib cage are evaluated during BCS assessment. The lumbar region measures the amount of fat over the vertebrae, the sternum (breastbone) measures the size of fat on the sternum, and lastly, the rib cage evaluates the fat covering of the ribs. Additionally, there are two methods used to assess the degree of muscle thickness on goats. The first method is evaluating the fat depots over the ribs, shoulder and back, whereas, the second assessment is to measure the fat depots covering over the short rib and tail head.
| Trait | P-values | Significance* |
|---|---|---|
| Body Weight, kg (BWT) | 0.0000 | ** |
| Body Condition Scores (1 – 5) (BCS) | 0.0000 | ** |
| Chest Girth, cm (CG) | 0.0000 | ** |
| Body Length (BL), cm | 0.0004 | ** |
| Shoulder Width, cm | 0.0000 | ** |
| Height at Withers (HTW), cm | 0.0000 | ** |
| Hip Width, cm | 0.0000 | ** |
| Scrotal Circumference (SC), cm | 0.0001 | ** |
Table text extracted from the original PDF; superscript letters are shown inline. The original table image is below.
View original table image
Breed Differences in Hematology
The results of the hematological values for adult goat in both Kiko and Nubian bucks is shown in Tables 4, 5 and 6 respectively. The hematocrit (HCT) was significantly different (P<0.05) between breeds with Kiko goats buck having the highest (41.6%). The hemoglobin (HGB) values ranged from (9.1 to 12.4 g/dl and 7.4 to 10.0 g/dl with the Kiko bucks also having the highest value (12.4g/dl). The highest value of 24.3 M/µl was observed in Kiko goat bucks for red blood cell count (RBC) while Nubian goats buck had the least (19.4 M/µl) MCH values ranged from 4.2 to 5.8 pg in Kiko bucks to 3.9 and 5.4 pg in Nubian bucks. Nubian goats were observed to have the highest mean corpuscular hemoglobin concentration (MCHC) (30.9 vs. 27.1 g/dL) and white blood cell count (WBC) (12.3 vs. 10.9 K/ µL) respectively. The lymphocytes values ranged from 49.5.00% in Nubian bucks to 37.0% in Kiko bucks. Kiko bucks had the highest neutrophils (69.00%) followed by Nubians that had (64.00%). Eosinophils was observed to be highest (4.9%) for Kiko buck followed by Nubians (1.08%). Monocytes values ranged from 3.2 to 7.9% in Kiko bucks and 2.1 to 13.0% in Nubians (Tables 4 and5). HGB (Hemoglobin) values in this study was higher than values obtained for Bolangir goats (Adegun et al .2011) [3] . Earlier reports in Baladi goats Aletor and Egberongbe (1992) [6] and Bolangir goats (Adegun et al. 2011) [3] showed lower HGB values. The findings of this study support that HGB varies among breeds of goats. Increase in HGB values in this study may be attributing to increase in environmental temperature. High HGB values indicates either an increase in the number of circulating RBC or reduction in circulating plasma volume (Baneejee, 2007) [9] . Hematological traits especially PCV and HGB often correlated with nutritional status of the animal. However, the primary functions of the erythrocyte are to serve as a carrier of hemoglobin. The higher HGB values observe in this study might likely be a sign of healthier goats. Males have higher PCV and HGB values than females and is a likely hood of inherent sex differences among male and female (Bianca, 1955). Hemoglobin (HGB) concentration in this study fell within the range of high values obtained for Bolangir goats (Adegun et al 2011) [3] . The significant breed (Kiko vs. Nubian) of HGB observed in this study may be an indication of better adaptability of the Kiko breed to the humid conditions in south eastern Alabama. The results of the RBC shows that Kiko bucks had higher RBC values than Nubians. The difference due to breed is a signal of the health status and better adaptability of the Kiko breed in sub-tropical climates Alabama, which is in agreement with the findings of Alex and Verne, (1993) and Addas et al (2010) [2] . The values of mean corpuscular volume (MCV) significantly increased while MCHC indicate macrocytic and hypochromic anemia (Campbell et al. 2003), probably due to the increased activity of bone marrow and deficiency of some hemopoietic factors. MCHC is very significant in the diagnosis of anemia and also serve as a useful index of the capacity of bone marrow to produce red blood cells. Increased MCV has also been observed in regenerative anemia due to hemolysis and hemorrhages. A higher MCV values indicates macrocytosis (Coles, 1980) [20] . The total White Blood Cell (WBC) count was higher in this study than values obtained for other breeds of goats and cattle (Anosa, 1988) [7] . Total WBC counts differentials in these adult goats compared well with values obtained for young goats in a study by Pradhan (2016) [45] for three breeds of goats. The higher values obtained in this study suggest well develop immune system of all Kiko and Nubian breeds of goats. In goats like other ruminants, there are more lymphocytes than Neutrophils in circulation (Daramola et al. 2005) [22] . The higher values of the WBC observed may also be attributed to the extensively managed goats which makes them face challenges from microbes when on free range. However, the values obtained in this study fell within the broad range recorded for various breeds of goats (Abdelatif et al. 2010) [1] . The white blood cell differentials (lymphocytes and neutrophils) levels are comparable to values obtained for several ruminant animals. In goats like other ruminants, there are more lymphocytes than neutrophils in circulation (Daramola et al. 2005) [22] . Lymphocytes are the key elements in the production of immunity. Low levels are observed in some cases of bacterial infections, aplastic anemia, and in some forms of leukemia while high values can be observed in viral infections, and in some forms of leukemia (Dacie, 1991) [21] . Pradhan (2016) [45] obtained the values of (64.8 to 70%) for adult goats and 67.8 to 55.4% for goat kids, while Duke et al (1995) reported values ranging from 43.89 to 45.86% for kid goats respectively. Addass et al. (2012) [2] reported that management system had significant effect on PCV indicating a higher effect on semiintensively kept chicken recording higher values. According to Addass et al. (2012) [2] intensively kept chickens recorded higher values for most hematological parameters than semiintensively kept chickens. Olayemi, et al (2000) [39] conducted a study to determine the hematology of the West African Dwarf (WAD) sheep under intensive and extensive management systems in Nigeria. The intensively reared animals showed higher PCV, HGB concentration and MCV than those under extensive management. Both groups of animals had similar MCH, MCHC, Red Blood Cell, (RBC) Total White Blood Cell, lymphocyte, neutrophil, eosinophil and monocyte counts. In another study conducted by Olayemi et al. (2000) [39] on the influence of management on the hematology of the white Fulani cattle. The intensively reared animals showed higher Packed Cell Volume (PCV), Red and White cell counts but lower Mean Corpuscular Hemoglobin than those under extensive management. Furthermore, Coles (1986) [20] and Schalm et al. (1975) [48] reported that regardless of age, sex and climate, sheep and goats reared under traditional husbandry system have low hematological values compared to those reared under modern husbandry. Chineke et al. (2006) [19] reported that apart from genotype, age, sex, differences in hematological indices may be caused by nutritional, environmental and hormonal factors. According to Ogunbajo, et al. (2009) [37] low nutritional grassland, pasture, stress, parturition, climatic factors among others greatly alter the blood values of goats and sheep, as well as other farm animals. Hematological parameters and its knowledge can be used to assess the health as well as the physiological status of farm animals under consideration. Changes of these parameters have been studied in cattle, sheep and Red Sokoto goats (NAPRI, 1984) [33] There is great variation in the hematological parameters as observed between breeds, ages, sexes, management systems among others in farm animals. These differences have further underlined the need to establish appropriate physiological baseline values for livestock in in Alabama, which could help in realistic evaluation of the management practice, nutrition, diagnosis of health as well as in determining the physiological status of farm animals. Moreover, it is important to establish a baseline index for hematological parameters based on the factors studied and carry out further studies to determine the effects of these factors on these indices.
Breed Differences in Serum Biochemistry
The results of some blood chemistry parameters (means ±SD) of the Kiko and Nubian bucks in this study is shown in Tables 7, 8 and 9 respectively. These include the fallowing parameters: Glucose (GLU), Creatinine (CREA), Blood Urea Nitrogen (BUN), Calcium (CA), Total Protein (TP), Alkaline Aminotrnasferase (ALT), Aspartate Aminotransferase (AST), Alkaline Phosphatase (ALKP) and Total Bilirubin (TBIL). Total protein levels in Kiko and Nubian bucks in this study fall within the ranges published for other goat breeds (Pradhan, 2016; Daramola et al 2005) [45,22] , although as with albumin levels breed variations were noted in the Indian goats which cannot be assessed in this study (Ekiz and Yalcintan, 2013) [23] . Ogunbajo et al (2009) [37] reported that total protein value in goat serum could be increased until 7.5 g/dl in extensively raised animals. Tambuwal et al. (2002) [54] also reported a normal value of 7.0 g/dl; however, they also found significant differences between sexes. Blood proteins play an important role in maintaining overall oncotic potential preventing significant extravasation of fluid from the circulation and so again, it is not surprising that there is no significant variation between the two breeds (7.56 vs.7.60 g/dL; P>0.05, Table 9) for total proteins or the overall levels of the globulins or albumin. This s study showed lower ALKP values than that reported in Sokoto red, Sahel and Saanen goats (Tambuwal et al 2002) [54] . However, the values of AKLP were slightly higher than that reported in WAD goats (Opara et al. 2010) [41] . ALKP constitutes a large group of isoenzymes, which plays important roles in the transportation of sugar, phosphate and it originates from different tissues such as liver, bone, placenta, and intestine (Adedeji, 1992). Alkaline phosphatase (ALKP) is a leakage enzyme found in bone, the intestines and the liver predominantly (Oduye et al 1976) [36] . Elevations can therefore occur due to bone, intestinal or liver disease, or due to bone growth in young animals. Values for the Kiko and Nubian bucks in this study were similar to those reported for other goats (Opara et al. 2010) [41] . Electrolyte (calcium) values are also similar to that reported for goats and other ruminants. In all mammals, physiologically normal values for calcium potassium do not exceed 7.5mmol/L as cardiac dysfunction occurs, or become less than 2.5mmol/L due to muscular dysfunction (Elitok, 2012). Diet may also account for the significantly increased total calcium levels in the Nubian versus the Kiko bucks (9.3 vs. 8.4 mg/DL). Calcium: phosphorus ratios often follow an inversely proportionate relationship and again this may account for the results seen here. Calcium and phosphate levels reported here are within the range for other breeds of goats (Opara et al. 2010) [41] . Elevated phosphorus levels may also be seen in cases of advanced renal failure. Lowered calcium levels may be seen in diets deficient in calcium, high in phosphorus or containing compounds such as oxalates (e.g., beet leaves) or phytates (e.g., grains) which bind ionized calcium in the gut and prevent its absorption. This study showed a wide variation in the concentrations of both Aspartate Amino Transferase and the Alanine Amino Transferase (AST and ALT). The comparative value of alkaline phosphate (ALP) in both Kiko and Nubian bucks is in contrast to the findings of Tambuwal et al (2002) [54] for Red Sokoto goats. Although ALP level can be influenced by pregnancy, blood pH and disease (Kelly, 1974), the animals in this study were apparently healthy, nonpregnant, and these parameters could not have been influenced by these factors. Age was also observed to have a significant effect on ALP in this study similar to Red Sokoto goats (Tambuwal et al, 2002) [54] . Creatinine and urea are often used as an indicator of renal function in mammals with elevations in both parameters being seen in the latter stages of renal failure (Bush, 1991) [16] . It is interesting to note that there is a statistically significant difference between the two breeds studied (0.80 mg/DL vs. 0.48 mg/DL; P<0.01, Table 9) here with the Kiko bucks being greater than the Nubian bucks for both parameters. This is an important feature to note when attempting to interpret results in any renal health assessment. Values from are similar to published values for nutria for creatinine but lower than nutria for urea (Ekiz and Yalcintan, 2013) [23] . However, White Aardi showed significantly higher (p≤0.01) value (1.57 mg/dl) compared to Black Aardi. Belewu and Ogunsola (2010) [11] reported different low creatinine concentrations because of the diet fed to goats, 0.7 mg/dl for un-treated kernel cake (Jatropha curcas) and 1.2 mg/dl for goats fed with fungi-treated Kernel cake. The level of creatinine in the blood serum could be altered due to differences in energy and protein content of feeds. Solaiman et al. (2009) [50] showed that creatinine levels in male kids increased linearly when cottonseed (Gosspium hirsutum) ration was offered to them. Moreover, a study on goat grazed on rangeland showed that the level of creatinine had varied values depended on certain roughages available in wet and dry periods of grazing (Mellado et al. 2006) [29] . The level of creatinine could also be elevated in the serum of goats after water deprivation (Abdelatif et al. 2010) [1] . The amount of creatinine secreted daily is a function of the muscle mass and is not affected by diet, age, sex or exercise. It amounts to approximately 2% of the body stores of creatinine phosphate and is roughly 1-2g/day for adult. Female excrete less creatinine than males because of their smaller muscle mass Ganong (2005) [24] . The levels of BUN for the examined bucks were within the normal range (Tables 7 and8) for goats (10.6 vs. 13.6 mg/dl). Studies reported varied values of BUN in different goat breeds. Benjamin (1989) [12] suggested an average BUN concentration of 21.4 mg/dl, while Bush (1991) [16] found that BUN concentration ranged between 34.6 and 57.4 mg/dl in goats. Many reports suggested that BUN concentration was lower in kids than in adults with no significant differences between the sexes (Castro et al. 1977) [17] . Solaiman et al (2009) [50] reported a breed by diet interactions effect on BUN values in a study where three goat breeds, that is, Boer, Nubian, and meat Spanish goat were offered lespedeza (Lespedeza cuneate) or alfalfa hay (Medicago sativa L). In general, lower concentration of BUN is an indication of low dietary protein level or hepatic chronic disease. On the other hand, the increase of BUN could be the result of renal failure and body dehydration (Mishra et al. 2013) [31] . Also, Others (Mishra, et al. 2013) [31] suggest that lower concentration of BUN is an indication of the dietary protein level or liver chronic diseases.
| Item | P. Values | Significance |
|---|---|---|
| GLU mg/DL | 0.9281 | NS |
| CREA mg/DL | 0.0000 | ** |
| BUN mg/DL | 0.0509 | NS |
| BUN/CREA | 0.0000 | ** |
| CA mg/DL | 0.0004 | ** |
| TP g/Dl | 0.8407 | NS |
| ALT U/L | 0.0001 | ** |
| AST U/L | 0.0000 | ** |
| ALKP U/L | 0.0005 | ** |
| TBIL mg/Dl | 0.7660 | NS |
Table text extracted from the original PDF; superscript letters are shown inline. The original table image is below.
View original table image
Hematological and biochemical variables versus body conformation traits
For both Kiko and Nubian bucks, the relationships between various hematological parameters and body conformation traits are presented in Table 10. Body weight (BWT) at bleeding and WBC showed negative correlation (r = -0.34), however, was highly correlated with RBC (r = 0.73), lowly correlated with PLT (r = -0.13), negatively correlated with MONO (r = -0.55), and showed positive relationship with MCH (r = 0.41) and EOS (r = 0.50) and HCT (r = 0.66) respectively. Body condition scores (BCS) showed significant low negative relationship with WBC (r = -0.26), PLT (r= -0.11), MONO (r = -0.43) and MCHC (r = -0.23). However, BCS showed significant (P<0.05) positive correlations with HCT (r=0.52), HGB (r = 0.65) and MPV (r = 0.64). Body length (BL) showed significant (P<0.05) negative correlations with most hematological variables except HGB (r = 0.58) and EOS (r = 0.73) The relationships between various biochemical variables and body conformation traits in Kiko and Nubian bucks is presented in Table 11. Body weight (BWT) and ALKP (R = -0.50), ALT (r = -0.53), AST (r = -0.61) and BUN (r = -0.31) showed negative correlation. However, CREA was highly correlated with TP (r = -020), lowly correlated with GLU (r = -0.23), negatively correlated with TBIL (r = -012). Body condition scores (BCS) showed significant low negative relationship with most serum biochemical variables except CREA (r = 0.79). In addition, Body length (BL) showed significant (P<0.05) negative correlations with most all measured biochemical parameters except CREA (r = 0.59) The body conformation traits and blood variables data of bucks are presented in Tables 2, 3, 4 and 5 respectively. The mean and STD of body weights of Kiko and Nubian bucks were (45.4 ± 4.0 and 27.1 ± 2.8 kg) respectively. Highly Significant (P<0.01) breed differences were obtained for body weights. The mean and STD of body condition scores of Kiko and Nubian bucks were (3.2 ± 0.56 and 2.0 ±0.0) respectively. Highly Significant (P<0.01) breed differences were obtained for body condition scores for Boer, Kiko and Boer and Kiko crosses. Okere et al (2017), have also reported similar findings. The mean and STD of blood glucose (mg/ dl) in the Kiko and Nubian buck were 69.2 ± 15.4. 68.8 ±7.8, respectively. Nonsignificant (P>0.05) breed differences were obtained for blood glucose levels. Serum total protein (g/dL) values were 7.6 ± 0.5 and 7.5 ± 0.7 respectively. The mean and STD of serum calcium levels (mg/dL) were 8.4±0.7 and 9.35 ±0.32 respectively. The mean values of WBC, RBC, HGB, MONO, MCHC MPV, and MCV within the normal physiological range, whereas the levels of serum calcium and CREA were lower than the normal physiological range (Swenson, 1970) [53] . Body weights are commonly used because measurement is easier and quicker to perform and does not require much expertise. Body weights are commonly used for monitoring nutritional status and growth of animals (Chimonyo et al. 2000) [18] . However, the body weight of an animal per se does not reflect its nutritional status (Chimonyo et al. 2000) [18] . Body condition scoring describes the systematic process of assessing the degree of fatness of an animal (Nicholson and Sayers, 1987) [34] . The score reflects the plane of nutrition on which an animal has been exposed over a reasonable length of time (Stuth et al., 1998) [52] . The loin, ribs, tail head, brisket, flank, vulva and/or rectum and udder are the important parts of the body used in determining the score. Physiologically, the proportions of protein and water of the animal's bodyweight decrease as it gains body condition (NRC, 1996) [35] . Several authors have documented association between body condition scoring and fertility (Buckley et al., 2003) [15] and health (Roche and Berry, 2006) [47] . The blood metabolites values in ruminant animals are used to assess the nutritional status, to predict occurrence of metabolic diseases and to diagnose the diseases, and to assess the fertility status of animals (Ingraham and Kappus, 1988) [26] . Although the success of the metabolic profile test is limited because several non-dietary factors like herd origin, stage of lactation, milk yield and season of the year affect the concentration of blood metabolites (Lee et al. 1978) [28] . Blood metabolite concentrations represent an integrated index of the adequacy of nutrient supply in relation to nutrient utilization of goats. They give an immediate indication of an animal's nutritional status at that point in time (Pambu-Gollah et al, 2000) [4] . In the dairy industry, the use of metabolic profile les for assessing the nutritional and health status of cows is widespread (Grunwaldt et al. 2005) [25] . Use of such metabolites in the management of pasture-raised goats is still uncommon. Blood glucose has a moderate diagnostic value in the assessment of nutritional status of buffaloes as it varies moderately in blood. Insufficient nutrient intake can reduce circulatory glucose and cholesterol levels. In conditions of undernutrition, the blood levels of propionate and other precursors derived from the diet decrease thus causing a reduction in the rate of glucose synthesis (Reynolds et al. 2003) [46] . Total protein levels are lower in young animals and higher in mature animals whilst albumin levels are lower at birth and then increase (Otto et al, 2000) [42] . Malnutrition decreases albumin levels. Total protein and albumin reflect availability of protein, and their concentration decline in the face of protein deficiency. On the basis of above observations, it can be concluded that both Kiko and Nubian bucks under a semiintensive system deficient in the minerals calcium and phosphate whereas their energy requirements are being met with their diet. It is also concluded that blood biochemical profile must be combined with body conformation traits a traditional method for assessment of nutritional status for goats in a pasture management production system.
| Parameter | r | — | Parameter | — | r |
|---|---|---|---|---|---|
| Nubian | Kiko | ||||
| BWT vs. WBC | -0.34 | BCS vs. WBC | -0.26 | ||
| BWT vs. RBC | 0.73 | BCS vs. RBC | 0.63 | ||
| BWT vs. PLT | -0.13 | BCS vs. PLT | -0.11 | ||
| BWT vs. MONO | -0.55 | BCS vs. MONO | -0.43 | ||
| BWT vs. MCHC | -0.36 | BCS vs. MCHC | -0.23 | ||
| BWT vs. MCH | 0.41 | BCS vs. MCH | 0.27 | ||
| BWT vs. EOS | 0.50 | BCS vs. EOS | 0.42 | ||
| BWT vs. MPV | 0.61 | BCS vs. MPV | 0.64 | ||
| BWT vs. MCV | 0.37 | BCS vs. MCV | 0.25 | ||
| BWT vs. NEU | 0.19 | BCS vs. NEU | 0.27 | ||
| BWT vs. HCT | 0.66 | BCS vs. HCT | 0.52 | ||
| BWT vs. BASO | -0.08 | BCS vs. BASO | -0.17 | ||
| BWT vs. LYM | -0.38 | BCS vs. LYM | -0.36 | ||
| BWT vs. RETIC | -0.07 | BCS vs. RETIC | -0.02 | ||
| BWT vs. HGB | 0.86 | BCS vs. HGB | 0.65 | ||
| HTW vs. WBC | -0.44 | BL vs. WBC | -0.40 | ||
| HTW vs. RBC | 0.55 | BL vs. RBC | 0.01 | ||
| HTW vs. PLT | -0.10 | BL vs. PLT | -0.36 | ||
| HTW vs. MONO | -0.44 | BL vs. MONO | -0.31 | ||
| HTW vs. MCHC | -0.47 | BL vs. MCHC | 0.29 | ||
| HTW vs. MCH | 0.51 | BL vs. MCH | 0.23 | ||
| HTW vs. EOS | 0.30 | BL vs. EOS | 0.72 | ||
| HTW vs. MPV | 0.44 | BL vs. MPV | 0.34 | ||
| HTW vs. MCV | 0.46 | BL vs. MCV | 0.03 | ||
| HTW vs. NEU | 0.01 | BL vs. NEU | 0.54 | ||
| HTW vs. HCT | 0.66 | BL vs. HCT | 0.09 | ||
| HTW vs. BASO | -0.06 | BL vs. BASO | -0.18 | ||
| HTW vs. LYM | -0.18 | BL vs. LYM | 0.05 | ||
| HTW vs. RETIC | -0.04 | BL vs. RETIC | -0.23 | ||
| HTW vs. HGB | 0.74 | BL vs. HGB | 0.58 | ||
| 1BWT = Body weight, HTW = Height at Withers, RBC = | Red Blood Cells | , HCT= Hematocrit, HGB = Hemoglobin, MCV = Mean Cell |
Table text extracted from the original PDF; superscript letters are shown inline. The original table image is below.
View original table image
Conclusions
The components of the hematological and serum biochemical parameters in Kiko and Nubian bucks in this study seem to point out some differences from those obtained for other ruminant species. The observed differences further support the fact that the physiological parameters reported for other ruminant animals may not be applied on Kiko and Nubian goats kept in this ecological zone. Breed was observed to have a significant effect on parameters like HGB, RBC and HCT values. Breed was also observed to have effect on the lymphocytes and Neutrophils, where the Kiko goats had increased lymphocyte values compared to the Nubian bucks. It may be concluded that the biochemical and hematological parameters were mostly within the physiological range for goats as reported from previous studies. These data will contribute to our knowledge for monitoring health status, diagnosis of diseases and management in the Kiko and Nubian breeds of goat under semi-intensive pasture production system in southeast Alabama. This study is considered as preliminary study that can be used as a reference for further studies to determine reference values for the studied breeds to aid the veterinarians in the interpretation of the laboratory data and for the selection of the appropriate treatment.
Acknowledgement
AcknowledgmentThe authors wish to acknowledge the staff (Dr. Frank Abrahamsen, Mr. Russell Johnson, and Mr. Ronald Davis) of Caprine Research Unit, George Washington Carver Experimental Station, College of Agriculture, Environmental & Nutrition Sciences (CAENS), Tuskegee University for technical support and USDA-NIFA for financial support. Many thanks are also given to Dr. Hamid Mahama, Mrs. Monira Awad of the Tuskegee University College of Veterinary medicine clinical assistance.
Figures and tables from the paper
| Trait | No | Mean | Standard Deviation | Minimum | Maximum |
|---|---|---|---|---|---|
| Body Weight, kg (BWT) | 15 | 45.42 | 4.09 | 37.19 | 49.89 |
| Body Condition Scores (1 – 5) (BCS) | 15 | 3.2 | 0.56 | 2 | 4 |
| Chest Girth, cm (CG) | 15 | 86.52 | 1.85 | 82.55 | 88.90 |
| Body Length (BL), cm | 15 | 102.45 | 7.8 | 91.44 | 116.84 |
| Shoulder Width, cm | 15 | 59.65 | 2.81 | 55.42 | 63.500 |
| Height at Withers (HTW), cm | 15 | 69.94 | 2.73 | 66.04 | 76.20 |
| Hip Width, cm | 15 | 61.07 | 5.22 | 48.26 | 66.96 |
| Scrotal Circumference (SC), cm | 15 | 25.733 | 2.73 | 20 | 30 |
Table text extracted from the original PDF; superscript letters are shown inline. The original table image is below.
View original table image
| Trait | No | Mean | Standard Deviation | Minimum | Maximum |
|---|---|---|---|---|---|
| Body Weight, kg (BWT) | 15 | 27.19 | 2.85 | 21.77 | 30.84 |
| Body Condition Scores (1 – 5) (BCS) | 15 | 2 | 0 | 2 | 2 |
| Chest Girth, cm (CG) | 15 | 71.21 | 3.34 | 63.50 | 73.66 |
| Body Length (BL), cm | 15 | 90.13 | 8.83 | 73.66 | 101 |
| Shoulder Width, cm | 15 | 45.38 | 4.27 | 38.100 | 53.34 |
| Height at Withers (HTW), cm | 15 | 61.299 | 4.17 | 50.80 | 66.04 |
| Hip Width, cm | 15 | 47.51 | 3.13 | 43.18 | 53.34 |
| Scrotal Circumference (SC), cm | 15 | 21.96 | 1.60 | 18 | 24 |
Table text extracted from the original PDF; superscript letters are shown inline. The original table image is below.
View original table image
| Item | Mean | Standard Deviation | Minimum | Maximum | Reference Value* |
|---|---|---|---|---|---|
| RBC (M/µl) | 21.71 | 1.69 | 19.40 | 24.38 | 10.32 – 23.43 |
| HCT % | 41.64 | 8.91 | 27.10 | 55.800 | 22.0 – 39.0 |
| HGB G/DL | 10.94 | 1.14 | 9.10 | 12.400 | 8.9 – 13.8 |
| MCV fL | 19.25 | 4.23 | 12.30 | 25.40 | 14.0 – 22.3 |
| MCH pg | 5.04 | 0.43 | 4.20 | 5.80 | 5.0 – 7.0 |
| MCHC g/dL | 27.10 | 4.48 | 21.10 | 35.900 | 32.0 – 34.0 |
| RETIC K/µL | 0.88 | 1.91 | 0.00 | 7.10 | 0.0 – 15.0 |
| WBC K/µL | 10.93 | 2.38 | 9.03 | 16.23 | 6.03 – 19.58 |
Table text extracted from the original PDF; superscript letters are shown inline. The original table image is below.
View original table image
| NEU % | 51.93 | 11.19 | 31.80 | 69.10 | NA |
|---|---|---|---|---|---|
| LYM % | 37.23 | 9.13 | 24.10 | 52.90 | NA |
| MONO % | 5.50 | 1.15 | 3.20 | 7.90 | NA |
| EOS % | 4.99 | 4.90 | 0.20 | 14.00 | NA |
| BASO % | 0.34 | 0.21 | 0.00 | 0.070 | NA |
| NEU K/µL | 5.85 | 2.45 | 3.05 | 10.63 | 1.72 – 10.61 |
| LYM K/µL | 3.94 | 0.73 | 2.69 | 5.26 | 2.68 – 11.54 |
| MONO K/µL | 0.59 | 0.17 | 0.45 | 1.11 | 0.06 – 0.89 |
| EOS K/µL | 0.50 | 0.48 | 0.030 | 1.44 | 0.03 – 1.29 |
| BASO K/µL | 0.036 | 0.022 | 0.00 | 0.070 | 0.00 – 0.24 |
| PLT K/µL | 764.93 | 228.60 | 383.00 | 1403.0 | 246 - 912 |
| MPV fL | 8.64 | 0.37 | 7.80 | 9.30 | NA |
Table text extracted from the original PDF; superscript letters are shown inline. The original table image is below.
View original table image
| Item | Mean | Standard Deviation | Minimum | Maximum | Reference Value* |
|---|---|---|---|---|---|
| RBC (M/µl) | 17.99 | 1.88 | 15.43 | 22.16 | 10.32 – 23.43 |
| HCT % | 28.38 | 7.48 | 18.50 | 37.40 | 22.0 – 39.0 |
| HGB G/DL | 8.34 | 0.83 | 7.40 | 10.00 | 8.9 – 13.8 |
| MCV Fl | 16.10 | 4.91 | 9.30 | 22.90 | 14.0 – 22.3 |
| MCH pg. | 4.66 | 0.53 | 3.90 | 5.40 | 5.0 – 7.0 |
| MCHC g/dL | 30.94 | 6.73 | 23.20 | 42.40 | 32.0 – 34.0 |
| RETIC K/µL | 1.22 | 1.41 | 0.00 | 4.40 | 0.0 – 15.0 |
| WBC K/µL | 12.33 | 3.62 | 4.13 | 18.59 | 6.03 – 19.58 |
| NEU % | 42.68 | 9.93 | 29.00 | 64.50 | NA |
| LYM % | 49.51 | 8.73 | 31.50 | 65.90 | NA |
| MONO % | 7.49 | 3.15 | 2.10 | 13.10 | NA |
| EOS % | 1.08 | 0.80 | 0.30 | 3.00 | NA |
| BASO % | 0.42 | 0.54 | 0.00 | 1.90 | NA |
| NEU K/µL | 5.30 | 2.18 | 1.20 | 8.60 | 1.72 – 10.61 |
| LYM K/µL | 5.89 | 1.45 | 2.72 | 8.40 | 2.68 – 11.54 |
| MONO K/µL | 0.93 | 0.44 | 0.19 | 1.65 | 0.06 – 0.89 |
| EOS K/µL | 0.14 | 0.14 | 0.020 | 0.55 | 0.03 – 1.29 |
| BASO K/µL | 0.050 | 0.050 | 0.00 | 0.17 | 0.00 – 0.24 |
| PLT K/µL | 785.07 | 314.05 | 68.00 | 1277.0 | 246 – 912 |
| MPV fL | 8.02 | 0.35 | 7.40 | 8.60 | NA |
Table text extracted from the original PDF; superscript letters are shown inline. The original table image is below.
View original table image
| Item | P. Values | Significance |
|---|---|---|
| RBC(M/µl) | 0.0000 | ** |
| HCT % | 0.0001 | ** |
| HGB G/DL | 0.0000 | ** |
| MCV Fl | 0.0707 | NS |
| MCH pg | 0.0453 | * |
| MCHC g/dL | 0.0773 | NS |
| RETIC K/µL | 0.5926 | NS |
| WBC K/µL | 0.2200 | NS |
| NEU % | 0.0237 | * |
| LYM % | 0.0008 | ** |
| MONO % | 0.0290 | * |
| EOS % | 0.0050 | ** |
| BASO % | 0.5697 | NS |
| NEU K/µL | 0.5211 | NS |
| LYM K/µL | 0.0001 | ** |
| MONO K/µL | 0.0102 | ** |
| EOS K/µL | 0.0100 | ** |
| BASO K/µL | 0.3568 | NS |
| PLT K/µL | 0.8423 | NS |
Table text extracted from the original PDF; superscript letters are shown inline. The original table image is below.
View original table image
| Item | Mean | Standard Deviation | Minimum | Maximum | Reference Value* |
|---|---|---|---|---|---|
| GLU mg/DL | 69.20 | 15.42 | 49.00 | 108.00 | 54 – 93 |
| CREA mg/DL | 0.80 | 0.12 | 0.60 | 1.00 | 0.6 – 1.4 |
| BUN mg/DL | 10.26 | 5.07 | 3.00 | 22.00 | 10 – 21 |
| BUN/CREA | 13.53 | 7.54 | 5.00 | 28.00 | |
| CA mg/DL | 8.48 | 0.77 | 7.30 | 9.60 | 8.2 – 9.8 |
| TP g/Dl | 7.56 | 0.71 | 6.60 | 9.30 | 6.4 – 7.8 |
| ALT U/L | 11.53 | 2.38 | 10.00 | 16.00 | 23 – 44 |
| AST U/L | 79.06 | 15.63 | 56.00 | 117.00 | 122 – 321 |
| ALKP U/L | 163.00 | 58.37 | 52.00 | 273.00 | 75 – 228 |
| TBIL mg/Dl | 0.39 | 0.17 | 0.10 | 0.70 | 0.1 – 0.3 |
Table text extracted from the original PDF; superscript letters are shown inline. The original table image is below.
View original table image
| Item | Mean | Standard Deviation | Minimum | Maximum | Reference Value* |
|---|---|---|---|---|---|
| GLU mg/DL | 68.80 | 7.18 | 59.00 | 88.00 | 54 – 93 |
| CREA mg/DL | 0.48 | 0.05 | 0.40 | 0.60 | 0.6 – 1.4 |
| BUN mg/DL | 13.60 | 3.77 | 4.00 | 19.00 | 10 – 21 |
| BUN/CREA | 28.33 | 8.26 | 8.00 | 43.00 | |
| CA mg/DL | 9.35 | 0.32 | 8.70 | 10.00 | 8.2 – 9.8 |
| TP g/Dl | 7.60 | 0.53 | 6.80 | 8.50 | 6.4 – 7.8 |
| ALT U/L | 17.73 | 4.89 | 10.00 | 26.00 | 23 – 44 |
| AST U/L | 111.80 | 13.88 | 84.00 | 136.00 | 122 – 321 |
| ALKP U/L | 243.60 | 53.60 | 147.00 | 353.00 | 75 – 228 |
| TBIL mg/Dl | 0.42 | 0.29 | 0.10 | 0.90 | 0.1 – 0.3 |
Table text extracted from the original PDF; superscript letters are shown inline. The original table image is below.
View original table image
References
56 in the original paper- Abdelatif AM, Elsayed SA, Hassan YM. Effect of state of hydration on body weight, blood constituents and urine excretion in Nubian goats (Capra hircus). World J Agric. Sci 2010;6(2):178-188.
- Addass PA, David DL, Edward A, Zira KE, Midau A. Effect of Age, Sex and Management System on Some Hematological Parameters of Intensively and Semi-Intensively Kept Chicken in Mubi, Adamawa State, Nigeria. Iranian Journal of Applied Animal Science 2012;2(3):277-282.
- Adegun MK, Aye PA, Dairo FA. Evaluation of Moringa oleifera, Gliricidia sepium and Leucaena leucocephalabased multinutrient blocks as feed supplements for sheep in South Western Nigeria. Agriculture and Biology Journal of North America 2011;2(11):1395-1401.
- Aderemi FA. Effects of replacement of wheat bran with cassava root sieviate supplemented or unsupplemented with enzyme on the hematology and serum biochemistry of pullet chicks. Tropical Journal of Animal Science 2004;7:147-153.
- Adeyinka IA, Mohammed ID. Relationship between Live Weight and Linear Body Measurements in Two Breeds of Goats of Nothern Nigeria. Journal of Animal and Veterinary Advances 2006, 891-893.
- Aletor VA, Egberongbe O. Feeding differently processed Soyabean. Part 2: An assessment of hematological responses in the characteristics, hematology and serum chemistry of chickens. Die Nahrung 1992;36:364-369.
- Anosa VO. Hematological and biochemical changes in human and animal trypanosomiasis. Rev d'Elev et de Med. Vet. Des pays. Trop Part 1. 41 (1): 65-78, Part II, 1988;41(2):151-164.
- Awodi S, Ayo JO, Atodo AD, Dzende T. Some hematological parameters and the erythrocyte osomotic fragility in the laughing dove (Streptopella senegalensis) and the village weaner bird (Ploceus cucullatus) (p.384387). Proceedings of the 10th Annual Conference of Animal Science Association of Nigeria 2005.
- Baneejee GC. A Textbook of Animal Husbandry. 8th Edn. Published by Raju Primlani for Oxford and IBJ publishing Co. PVT Ltd, New Delhi 2007, 1079.
- Batten GJ. A new meat goat breed. In: Proc. 4 th Int. Conf. on Goats. Brasilia, Brazil 1987;2:1330-1336.
- Belewu MA, Ogunsola FO. Hematological and serum indices of goat fed fungi treated Jatropha curcas kernel cake in a mixed ration. J Agric. Biotechnol. Sustain. Dev 2010;2(3):35-38.
- Benjamin MM. Outline of Veterinary Clinical Pathology. 3rd edition. USA: Iowa State University Press 1989, 5575.
- Bongso TA, Jainudeen MR, Siti Zahrah A. Relationship of Scrotal Circumference to Age, Body Weight and Onset of Spermogenesis in Goats. Journal of Theriogeneology 1982;18:513-524.
- Briggs HM, Briggs DM. Modern Breeds of Livestock. Fourth Edition, MacMillan Company 1980.
- Buckley FK, O'Sullivan JF Mee, Evans RD, Dillon P. Relationships among milk yield, body condition, cow weight, and reproduction in spring-calving HolsteinFriesians. J. Dairy Sci 2003;86:2308-2319.
- Bush BM. Interpretation of laboratory results of small animal clinics. Blackwell scientific publication, London 1991.
- Castro A, Dhinsa DS, Hoversland AS, Malkus H, Rosenthiel C, Metcalf J. Serum biochemistry values in normal Pygmy goats. Am. J Vet. Res 1977;38(12):20852087.
- Chimonyo MNT, Kusina H, Hamudikuwanda, Nyoni O. Reproductive performance and body weight changes in draught cows in a smallholder semi-arid farming area of Zimbabwe. Trop. Anim. Health Pro 2000;32(6):405-415.
- Chineke CA, Ologun AG, Ikeobi CON. Hematological parameters in rabbit breeds and crosses in humid tropics. Pakistan Journal of Biological Sciences 2006;9(11):21022106.
- Coles EH. Veterinary Clinical Pathology 4th edition NB Sandes Company. Harcourt Brace Jovarinch Inc 1986.
- Dacie JV. Practical Haematology. 7th Edn. Churchill Livingstone, London England 1991.
- Daramola JO, Adeloye AA, Fatoba TA, Soladoye AO. Haematological and biochemical parameters of West African Dwarf goats. Livestock Research for Rural Development 2005;17(8):95. Retrieved January 22, 2014, from http://www.lrrd.org/lrrd17/8/dara17095.htm.
- Ekiz EE, Yalcintan F. Comparison of certain haematological and biochemical parameters regarding pre-slaughter stress in saanen, maltese, gokceada and hair goat kids. Journal of the faculty of veterinary medicine, Istanbul University 2013;39(2):189-196.
- Ganong WF. Review of Medical Physiology 22nd edition McGraw Hill Medical Publication Asia 2005, 459-516532.
- Grunwaldt EG, Guevara JC, Estevez OR, Vicente A, Rousselle H, Alcunten N, et al. Biochemical and haematological measurements in beef cattle in Mendoza plain rangelands (Agerntina). Trop. Anim. Health Pro 2005;37(6):527-540.
- Ingraham RH, Kappus LC. Metabolic profile testing Veterinary Clinics North America. Food Animal Practice 1988;4:391-411.
- Khan TA, Zafar F. Hematological Study in Response to Varying Doses of Estrogen in Broiler Chicken. International Journal of Poultry Science 2005;4(10):748751.
- Lee AJ, Twardock AR, Bubar RA, Hall JE, Davis CL. Blood metabolic profiles: their use and relation to nutritional status of dairy cows. J Dairy Sci 1978;61:1652-1670
- Mellado M, Olivares I, Rodriguez A, Mellado J. Relation among blood profiles and goat diets on rangeland. J. Appl. Anim. Res 2006;30:93-98.
- Merck Manual. The Merck Veterinary Manual, seventh edition, 1991. Merck and Co., Inc. Rahway, N.J., U.S.A 1991, 79-82. 812-817. Haematologic reference ranges. Mareck Veterinary Manual. Retrieved from http://www.merckmanuals.com/.
- Mishra A, Chatterjee US, Mandal TK. Induction of Chronic Renal Failure in Goats Using Cisplatin: A New Animal Model. Toxicol. Int 2013;20(1):56-60.
- Mmereole FUC. The Effects of Replacing Groundnut Cake with Rubber Seed Meal on the Hematological and Serological Indices of Broilers. International Journal of Poultry Science 2008;7(6):622-624.
- NAPRI. Highlights of Research Achievements on Animal Production. Science and Technology Briefing Lagos December. Arch. Zootech 1984;48(89-94):3-17.
- Nicholson MJ, Sayers AR. Reliability, reproducibility, and sequential use of condition scoring of Bos indicus cattle. Trop. Anim. Health Pro 1987;19:127-135.
- NRC. Nutrient Requirements of Dairy Cattle., 7th rev. ed. National Research Council. National Academic Press, Washington, DC 1996.
- Oduye OO, Adadevoh BK. Biochemical Values of Apparently Normal Nigerian sheep. Nigerian Veterinary Journal 1976;5(1):43-50.
- Ogunbajo SO, Alemede IC, Adama JY, Abdullahi J. Hematological parameters of Savannah brown does fed varying dietary levels of flamboyant tree seed meal (p. 88-91). Proceedings of 34th Annual Conference of Nigerian Society for Animal Production 2009.
- Olafedehan CO, Obun AM, Yusuf MK, Adewumi OO, Oladefedehan AO, Awofolaji AO, et al. Effects of residual cyanide in processed cassava peal meals on hematological and biochemical indices of growing rabbits (p.212). Proceedings of 35th Annual Conference of Nigerian Society for Animal Production 2010.
- Olayemi FO, Farotimi JO, Fagbohun OA. Hematology of the West African Dwarf Sheep under Two Different Management Systems in Nigeria. African Journal of Biomedical Research 2000;3(2):197-198.
- Onyeyili PA, Egwu GO, Jibike GI, Pepple DJ, Ohaegbulam JO. Seasonal variation in haematological indices in the grey-breasted guinea fowl (Numida mealagris Gallata pallas). Nigerian Journal of Animal Production 1992;18(2):108-110.
- Opara M, Udevi N, Okoli I. Hematological parameters and blood chemistry of apparently healthy West African Dwarf Goats. N. Y. Sci. J 2010;3(8):68-72.
- Otto F, Baggasse P, Bogin E, Harun M, Vilela F. Biochemical blood profile of Angoni cattle in Mozambique. Israel Veterinary Medical Association 2000;55(3):1-9.
- Pambu-Gollah R, Cronje PB, Casey NH. An evaluation of the use of blood metabolite concentrations as indicators of nutritional status in free-ranging indigenous goats. S. Afr. J Anim. Sci 2000;30(2):115-120
- Pradhan BC. Evaluation of hematological and biochemical parameters of goats of central Odisha environment fed on natural grazing land of Odisha, India. The Pharma Innovation Journal 2016;5(5):83-90.
- Reynolds CK, Aikman PC, Lupoli B, Humphries DJ, Beever DE. Splanchnic metabolism of dairy cows during the transition from late gestation through early lactation. J. Dairy Sci 2003;86:1201-1217
- Roche JR, Berry DP. Peri-parturient climatic, animal and management factors influencing the incidence of milk fever in grazing systems. J Dairy Sci 2006;89:27752783.
- Schalm OW, Jain NC, Carroll EJ. Veterinity haematology (3rd ed., p.15-218). USA: Lea & Fabiger, Philadelphia 1975.
- Singh R, Randhawa SNS, Randhawa CS. Body Condition Score and its correlation with ultrasonographic back fat thickness in transition crossbred cows. Vet World 2015;8:290-294.
- Solaiman SG, Gurung NK, McCrary Q, Goyal H, McElhenney WH. Feeding performance and blood parameters of male goat kids fed Easiflo cottonseed. Small Rumin. Res 2009;81(2-3):137-145.
- Solaiman SG. Assessment of the meat goat industry and future outlook for U.S. small farms. Tuskegee University. Tuskegee, AL 2007.
- Stuth W, Dyke P, Jama A, Corbett J. The use of NIR/NUBTAL, PHYGROW, and APEX in a metamodelling environment for an early warning system to monitor livestock nutrition and health. National Workshop on Early Warning System for Monitoring Livestock Nutrition and Health, Addis Ababa, Ethiopia 1998.
- Swenson MJ. Physiological properties, cellular and chemical constituents of blood. In M. J. Swenson (Ed.), Dukes' physiology of domestic animals (8th ed., p.7583). Cornstock Publishing Associates, Cornell University Press, Ithaca, London 1970.
- Tambuwal FM, Agale BM, Bangana A. Haematological and serum biochemical values of apparently healthy red Sokoto goats (p. 50-53). Proceeding of 27th Annual Conference of Nigerian Society of Animal Production. March 2002, 17-21
- Thiruvenkanden AK. Determination of Best-Fitted Regression Model for Estimation of Body Weight in Kanni Adu Kids under Farmer's Management System. Livestock Research for Rural Development 2005;17(7).
- Togun VA, Oseni BSA, Ogundipe JA, Arewa TR, Hammed AA, Ajonijebu DC, Mustapha F. Effects of chronic lead administration on the haematological parameters of rabbits -a preliminary study (p. 341). Proceedings of the 41st Conferences of the Agricultural Society of Nigeria 2007.
- Treacher RJ, Reid IM, Roberts CJ. Effect of body condition at calving on the health and performance of dairy cows. Animal Production 1986;43:1-6.