
Research article · 2023 · Full text
International Journal of Biology SciencesBiomonitoring using stream invertebrates in Kenya: A review of status, challenges and future prospects
Volume 5(1) · Pages 171–181 · DOI: 10.33545/26649926.2023.v5.i1c.161 ↗
Research areasFish Ecology and Management StudiesFreshwater macroinvertebrate diversity and ecologyAquatic Invertebrate Ecology and Behavior
Abstract
Author-writtenBiomonitoring refers to the use of living organisms to evaluate the ecological condition of the environment. Although aquatic biomonitoring using invertebrates has a long historical background in developed countries, its application in assessment of aquatic ecosystems in developing countries is relatively limited. The objective of this paper is to review the status, challenges and future prospects for invertebrate-based biomonitoring in Kenya. In Kenya, stream invertebrates are increasingly being applied in biomonitoring of running water ecosystems. However, there are challenges that hinder the biomonitoring process such as a lack of published identification keys, scarcity of information on the ecology and distribution of Kenyan stream invertebrates and a lack of a nation-wide biomonitoring programme. Potential future directions with regard to biomonitoring of Kenyan streams using invertebrates include publication of identification keys, establishment of a nation-wide biomonitoring programme using stream invertebrates as bioindicators, inclusion of stream biomonitoring in legislations and policies dealing with environmental monitoring and management, and allocation of more funds to research projects dealing with stream biomonitoring. In conclusion, invertebrate-based biomonitoring is important in evaluation of stream ecological conditions in Kenya. However, the challenges that hinder its application need to be addressed for its full potential to be realized.
Summary
Source-checkedPlain-language reading of the full paper, prepared with AI and checked against the text. Each point links to the authors' own words.
Why it matters
- Freshwater ecosystems are among the most threatened on Earth, making the understanding of their ecological condition critically important. View evidence ↗
- Human activities, including agriculture, deforestation, mining, damming, and industrial processes, negatively impact freshwater ecosystems. View evidence ↗
- Benthic invertebrates are effective bioindicators because they are widespread, diverse, sensitive to stressors, and relatively easy to sample and process. View evidence ↗
The question
- The study aims to review the current status, existing challenges, and future prospects for using invertebrates in biomonitoring within Kenya. View evidence ↗
What they did
- The author conducted a literature search using the Scopus, Google Scholar, and Web of Knowledge databases. View evidence ↗
- Out of 61 identified articles, 57 were selected for detailed review after four were excluded for not explicitly dealing with stream invertebrate biomonitoring. View evidence ↗
What they found
- Most biomonitoring studies in Kenya focus on specific human disturbances, such as urbanization, agriculture, grazing, and water abstraction. View evidence ↗
- Identification of macroinvertebrates in Kenyan studies is typically limited to the order, family, or genus levels, with species-level identification being rare. View evidence ↗
- Researchers in Kenya frequently rely on identification keys from other regions (e.g., Britain, Northern Europe, South Africa) or fail to specify the keys used. View evidence ↗
- The majority of the reviewed studies were university-based, focused on a single watershed, and lasted less than one year. View evidence ↗
- Regional variations in taxa, such as the rarity of certain stone flies (Perlidae) in Kenya compared to temperate zones, make indices from other regions less compatible. View evidence ↗
- The EPT index's performance in tropical streams improved when the relatively pollution-tolerant Baetid, Caenid, and Hydropsychid families were excluded. View evidence ↗
- Establishing reference sites is difficult in Kenya because many river basins have been historically modified by agriculture, grazing, and deforestation. View evidence ↗
What it means
- The author concludes that Kenya needs to establish a national biomonitoring program to provide consistent guidance for evaluating stream ecological conditions. View evidence ↗
- To improve biomonitoring, the author recommends publishing identification keys, training personnel in taxonomy, using molecular analyses, and expanding the spatio-temporal scale of studies. View evidence ↗
- The application of biomonitoring in Kenya is limited by a lack of national programs, scarce ecological data on local invertebrates, and a shortage of published identification keys. View evidence ↗
Visual summary
2 visualsIllustrations explain the paper; charts are replotted from the paper's own table values.
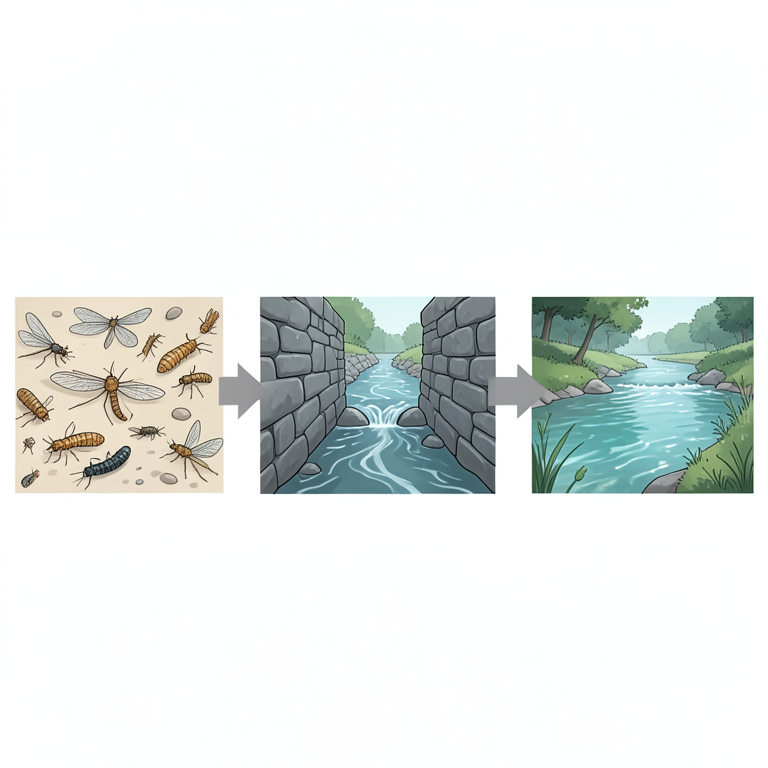
Barriers to Biomonitoring in Kenya
AI-generated conceptual illustration (Freshwater stream invertebrates in Kenyan rivers). It explains the idea and does not show study data.
View source evidence ↗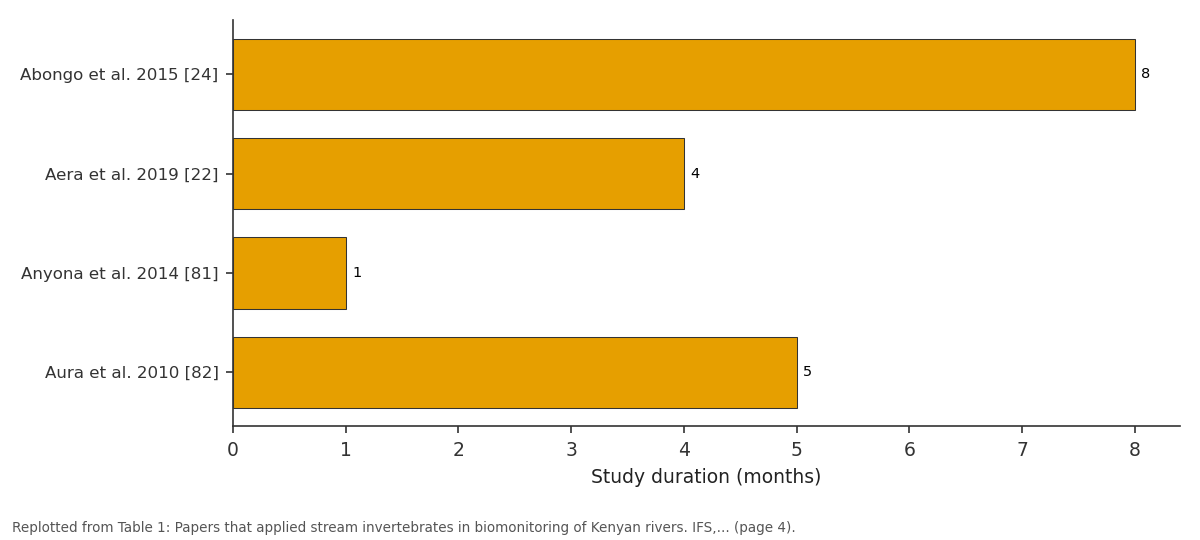
Study duration (months): Abongo et al. 2015 [24] vs Aera et al. 2019 [22] vs Anyona et al. 2014 [81] vs Aura et al. 2010 [82]
Replotted from Table 1 (page 4) of the original paper. Every bar is the paper's own table value.
View source evidence ↗Figures & tables
From the original paper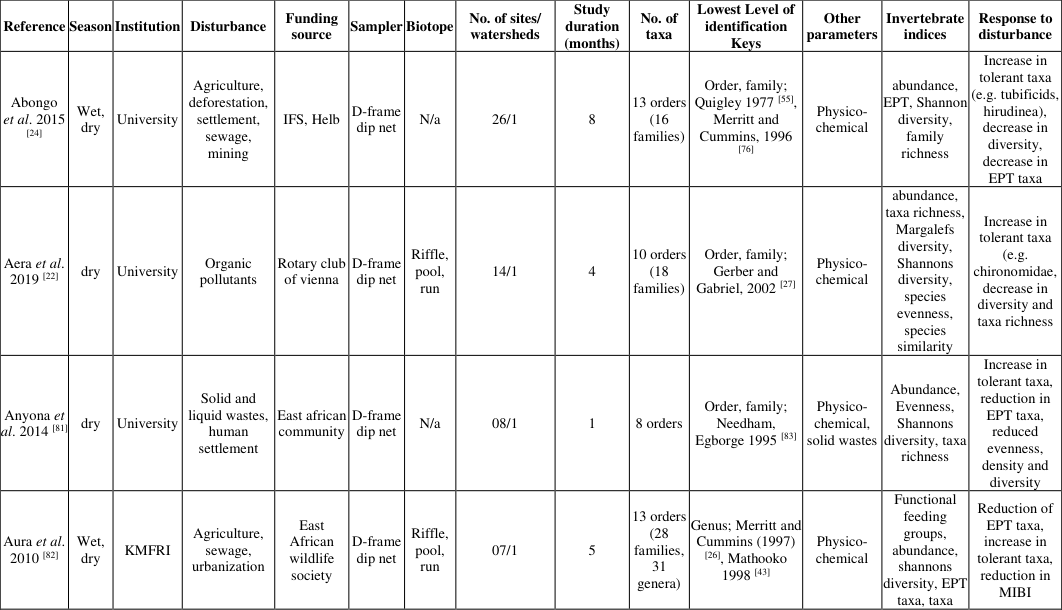 Table 1
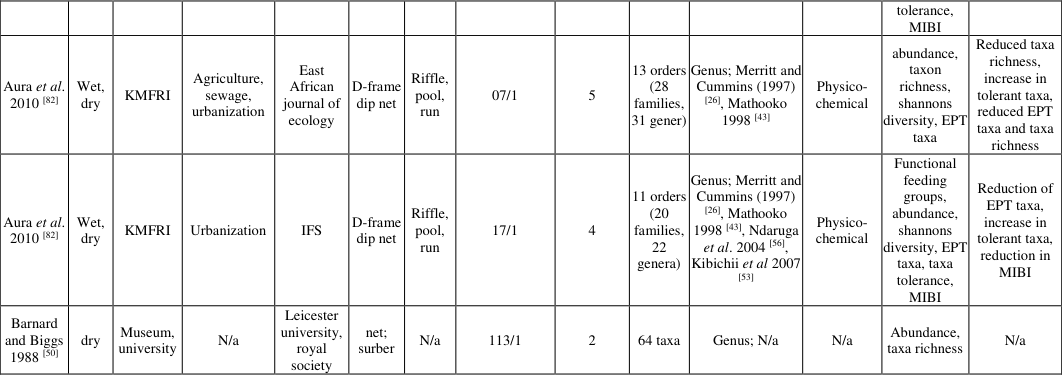 Table 2
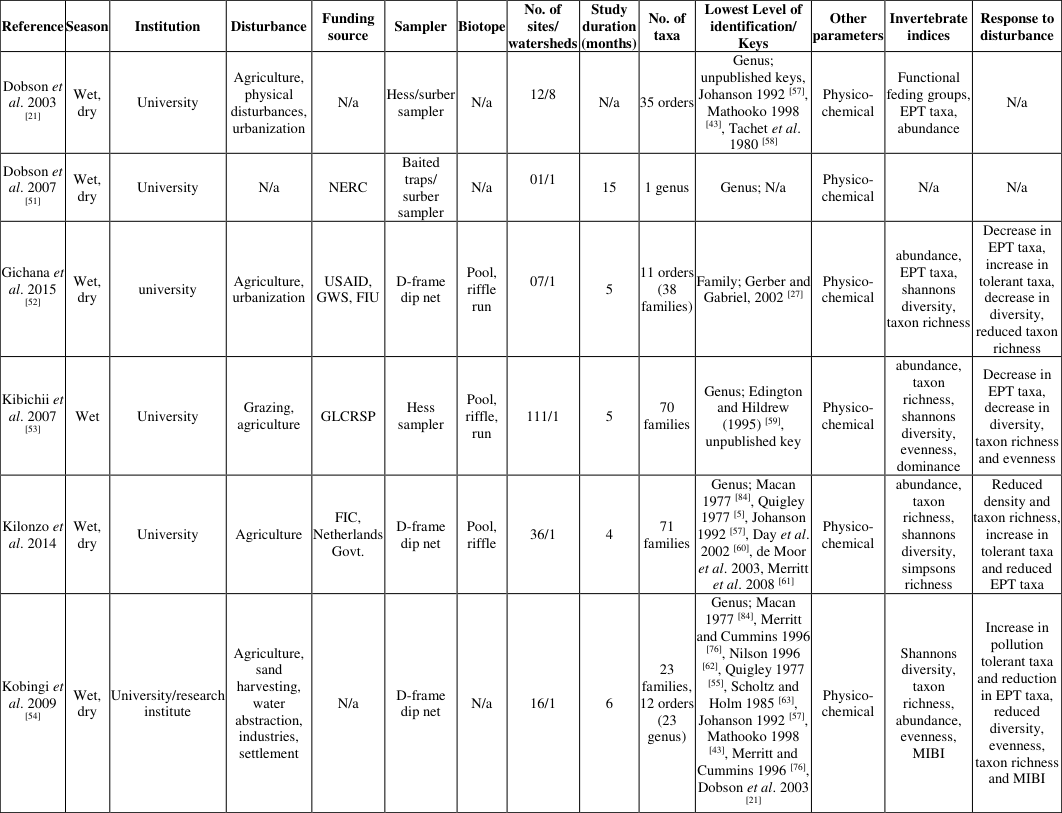 Table 2
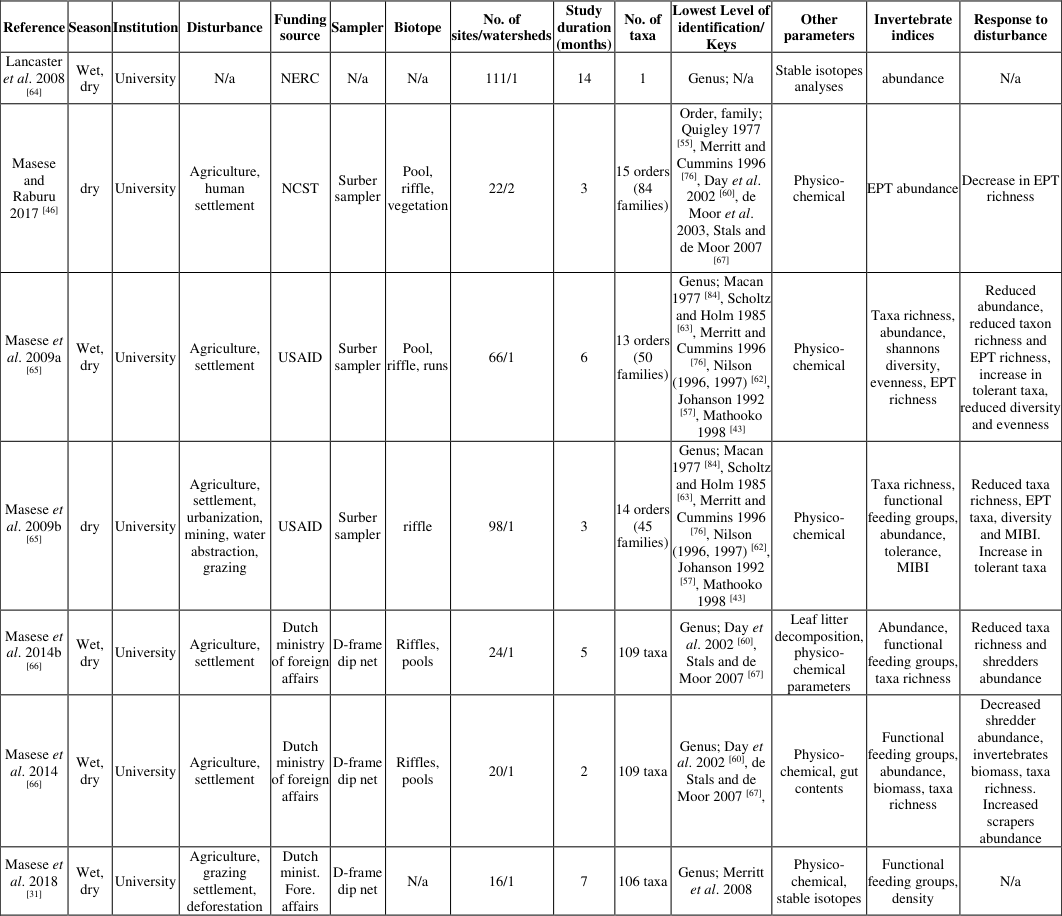 Table 3
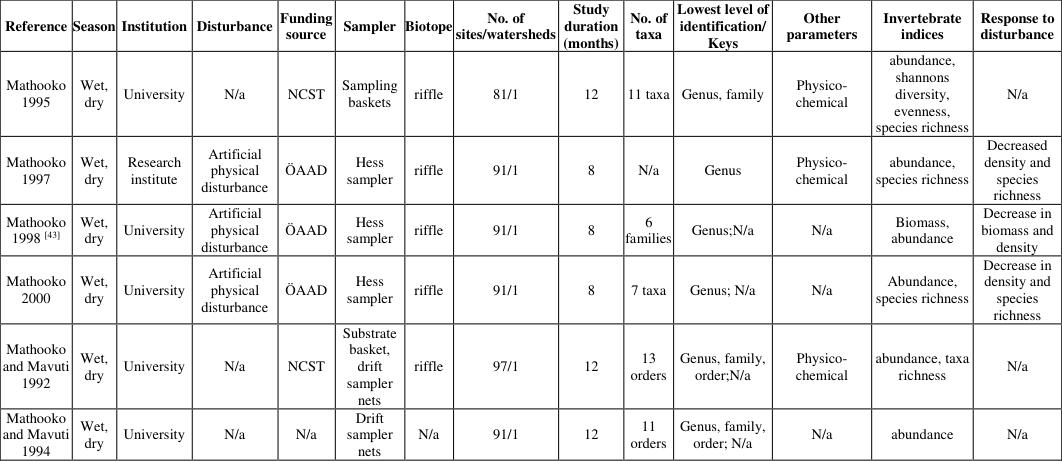 Table 4
 Table 5
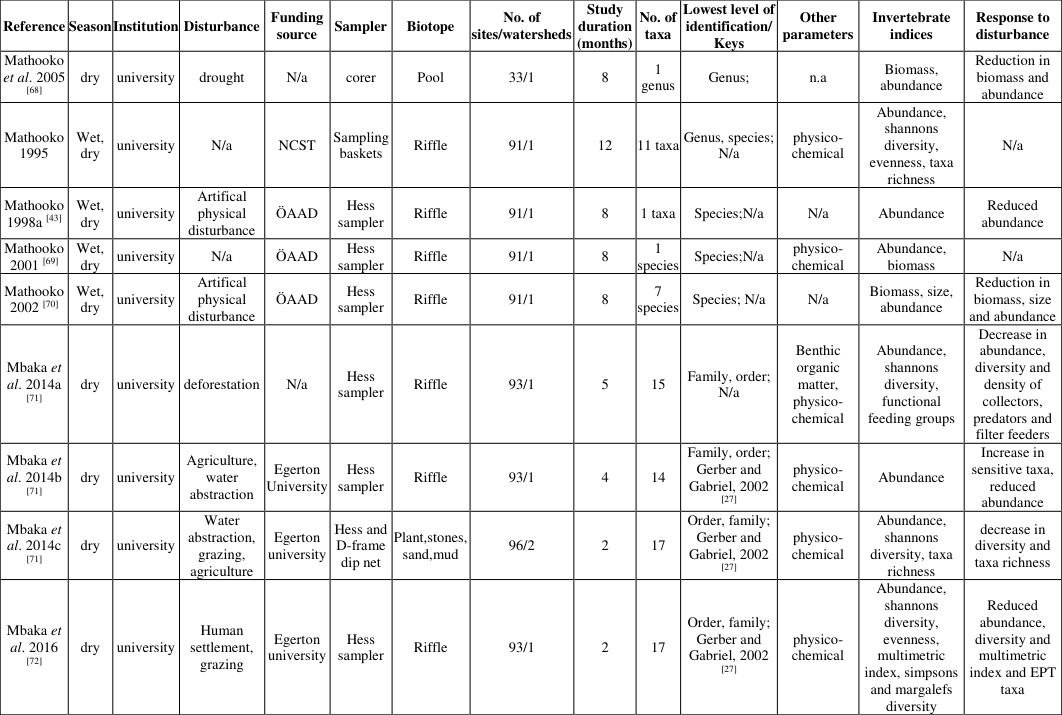 Table 5
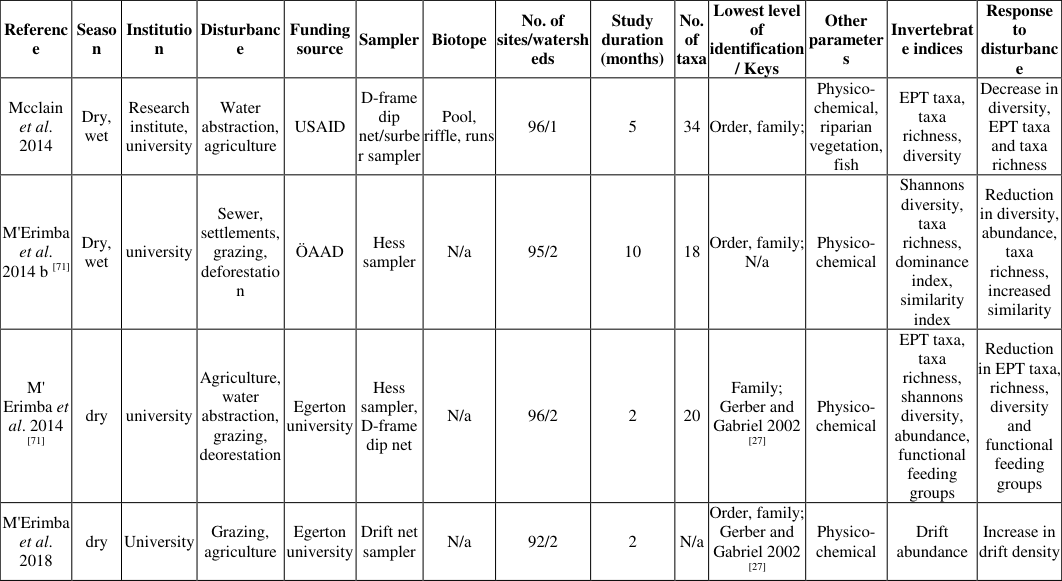 Table 6
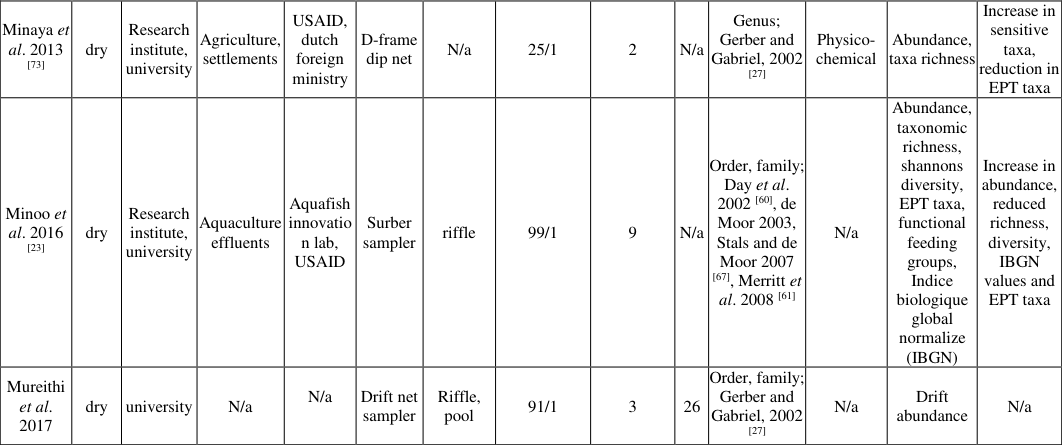 Table 7
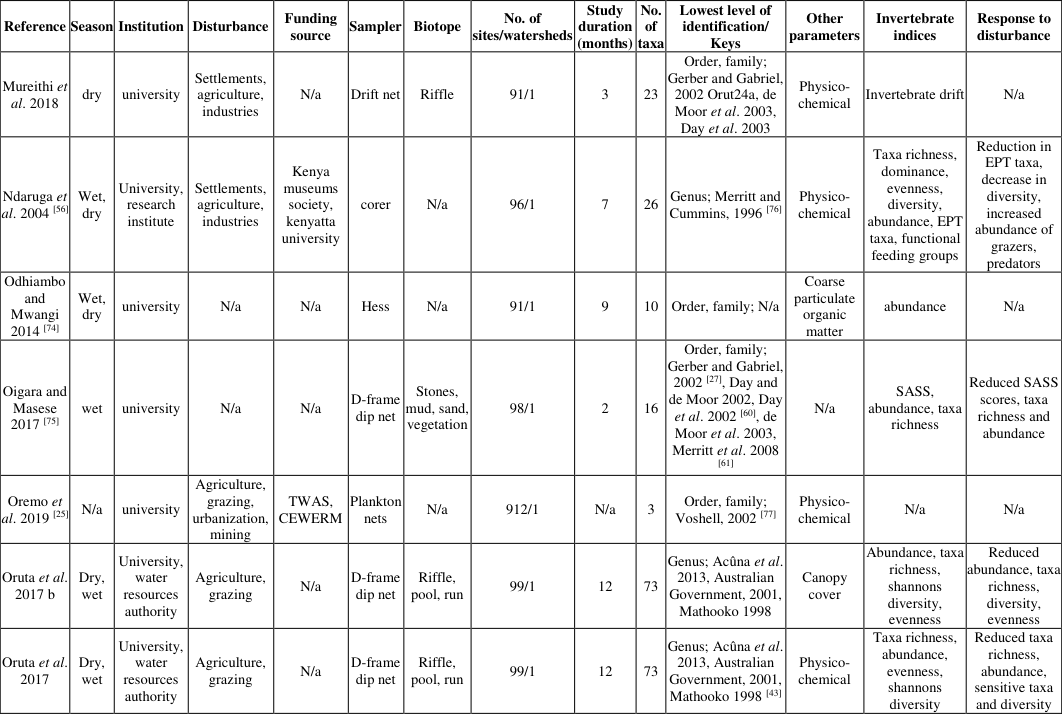 Table 7
 Table 8
Introduction
Worldwide, freshwater constitutes 0.01% of all water resources and covers less than 1% of the earth's surface (Dudgeon et al., 2006) [1] . Freshwaters are among the most threatened ecosystems of the earth and understanding their ecological condition is of paramount importance (Malmqvist and Rundle, 2002) [2] . Freshwater ecosystems are affected by anthropogenic impacts such as deforestation, agriculture, industries, damming and mining (Bashir et al., 2020) [3] . The impact of anthropogenic stressors on stream ecosystems is an urgent challenge globally and dealing with it has become a key priority of sustainable development programs (Forio and Goethals, 2020) [4] . In many regions of the world, evaluating a range of physico-chemical parameters has permitted for water quality assessment (Robert et al., 2020) [5] . Despite the fact that physico-chemical assessment is a long-established method for assessing the health condition of aquatic ecosystems, results may differ greatly over spatio-temporal scales (Kassegne and Leta, 2020) [6] . Therefore, to accurately evaluate changes in water quality, it is important to collect physico-chemistry data over extended time frames (Zaldívar et al., 2008) [7] . This is disadvantageous because it is time consuming and costly. Therefore, cost-effective and rapid bioassessment techniques using bioindicators, such as aquatic macroinvertebrates, were developed (Holt and Miller, 2010) [8] . The response of aquatic invertebrates to environmental stressors associated with human activities has been widely evaluated in different countries around the world (e.g., Gezie et al., 2017) [9] . Most benthic invertebrates spend a large part of their lifecycle in freshwater environments. They are potentially effective bioindicators of ecological conditions due to their ease of sampling and processing, widespread distribution, relatively long lifespans, high diversity and sensitivity to different types of stressors affecting freshwater environments (Li et al., 2010) [10] .
Additionally, they are important components in river food webs that provide a connection between coarse particulate organic matter (e.g. wood debris, periphyton) and higher trophic levels. The historical background of aquatic invertebrates as biomonitors dates back to the beginning of the twentieth century (Cairns and Pratt, 1993) [11] . Actually, the idea of using aquatic invertebrates as biological indicators started in Europe with the research of Kolkwitz and Marsson (1902) [12] . Their method of biomonitoring aimed to relate organic contamination to abundance and distribution patterns of invertebrates in rivers. Since that time, many biotic indices have been developed using different aquatic organisms, including invertebrate fauna, to evaluate river ecological conditions and water quality in different countries. Such biotic indices include the Trent Biotic Index in England (Woodiwiss, 1964) [13] , the Chandler's Score in Scotland (Chandler, 1970) [14] , the Biological Monitoring Working Party in the United Kingdom (Chesters, 1980) [15] . The River Invertebrate Prediction and Classification System was adapted for biomonitoring of aquatic ecosystems in Europe and the Australian River Assessment system was developed in the early 1990's as part of a national river health assessment program in Australia (Chessman, 1995) [16] . Biotic indices have also been developed in other regions of the world such as the USA (Hilsenhoff, 1987) [17] , South America (Ferreira et al., 2011) [18] and South Africa (Chutter, 1972) [19] . Macroinvertebratebased biomonitoring of rivers is also undertaken using methods such as diversity indices, multimetric approaches, multivariate approaches, functional feeding groups, biological traits, molecular methods and assessment of contaminants bioaccumulation in indicator species. Biomonitoring of aquatic ecosystems is more commonly undertaken in the developed countries than in the developing countries. However, there is an increase in the number of biomonitoring programs in developing countries due to the requirements to establish monitoring standards by environmental laws and policies, due to increase in habitat modifications affecting aquatic ecosystems (e.g., mining, damming, overfishing) or as a prerequisite for disease vector control initiatives (e.g., schistosomiasis, African sleeping sickness) (Thorne and Williams, 1997) [20] . Biomonitoring is especially ideal for developing countries given that the equipment needed for use are not expensive or complicated. Despite the importance of biomonitoring programs in developing countries, such as Kenya, various challenges hinder its establishment. Such challenges include a lack of adequate trained personnel with sufficient taxonomic knowledge, a lack of research funds and a lack of identification keys, among others. Due to a lack of wellestablished national biomonitoring programs and protocols, developing countries cannot achieve significant improvements of their aquatic ecosystems condition and the actions they undertake may be inadequate to produce effective aquatic restoration programs. The aim of this article is to review the status, challenges and future prospects for macroinvertebrate-based biomonitoring in Kenya. The article provides crucial information to river ecosystem managers and policy makers on the current biomonitoring practices, challenges that hinder biomonitoring and potential future prospects in the field of aquatic biomonitoring in Kenya.
Literature Search
The databases Web of Knowledge, Google Scholar and Scopus were searched for publications on biomonitoring of stream ecosystems in Kenya. Papers were searched using terms such as biomonitoring, bio assessment, monitoring, assessment, invertebrates, macroinvertebrates, zoobenthos, stream, river, Kenya. Additionally, the literature searches were improved by scrutinizing the references of articles dealing with invertebrate-based biomonitoring for more literature. A total of 61 articles were found. Out of these articles, four articles were exempted from further evaluation since the studies did not explicitly deal with biomonitoring using stream invertebrates (e.g., Dobson et al., 2003) [21] . The 57 articles that focused on invertebrate-based biomonitoring were read in detail and information such as season of study, disturbance, level of invertebrate's identification and keys, and response of invertebrates to disturbance was recorded. The summarized articles are available as supplementary information from the author.
Status of Invertebrate-based Biomonitoring in Kenya
Most invertebrate-based biomonitoring studies in Kenya have focused on specific anthropogenic disturbances affecting streams such as agriculture, deforestation, organic pollutants, urbanization, grazing, human settlements and water abstraction (e.g., Aera et al., 2019) [22] . Some of the studies that were reviewed only evaluated invertebrates during one season and focused on a single biotope (e.g., riffle) (e.g., Minoo et al., 2016; Aera et al., 2019) [22,23] . Other studies did not mention the season when sampling was done or the aquatic biotopes that were sampled (e.g., Abong'o et al., 2015; Oremo et al., 2019) [24,25] . Most studies were conducted in one watershed for a period lasting less than one year and were mainly based at Kenyan Universities. These studies were either conducted by postgraduate students or academic staff. Most studies identified macroinvertebrates to order, family or genus levels while few studies identified macroinvertebrates to the species level. Additionally, most studies used identification keys developed for other regions of the world, such as Northern Europe (e.g., Merritt and Cummins, 1997) [26] , South Africa (e.g., Gerber and Gabriel, 2002) [27] , Britain (e.g., Savage, 1989) [28] , or did not mention the keys that were used during identification. Collection of macroinvertebrates was undertaken using different samplers (e.g., Hess and surber samplers, and D-frame dip net) and sampling periods (1-15 months). Most studies evaluated the response of stream invertebrates to stressors using invertebrate-based indices such as density, Ephemeroptera, Plecoptera and Trichoptera (EPT) richness, diversity indices, taxa richness, functional feeding groups and multi-metric index of biotic integrity. However, few studies evaluated concentration of toxicants (e.g., heavy metals) in macroinvertebrates (e.g., Osano et al., 2004) [29] , biological traits (e.g., body size, mass) (e.g., Mathooko, 2002) [30] or applied stable isotopes analysis in biomonitoring (e.g., Masese et al., 2018) [31] .
Challenges and Future Prospects for Invertebrate-based Biomonitoring in Kenya
Stream ecosystems are affected by multiple disturbances concurrently and evaluation of the effect of specific disturbances on macroinvertebrates, as is the case with the reviewed studies, may not adequately explain the effect of multiple disturbances on stream ecological integrity. This is due to the fact that it is difficult to predict the impact of multiple disturbances because of complexity of interactions among disturbances. Disturbances may interact in additive or non-additive ways, where the combined impacts of multiple disturbances may be greater or smaller than what would be anticipated based on the impacts of single disturbances (Folt et al., 1999) [32] . Recent studies have suggested that interactions between disturbances may account for between forty and seventy percent of all responses in stream ecological conditions (Folt et al., 1999; Jackson et al., 2016) [32, 33] . Additionally, the non-additive interactions may be as common as additive responses, suggesting that the impacts of multiple disturbances are more challenging to predict based on the impacts associated with single disturbances. Predicting the impacts of multiple disturbances may especially be difficult in field-based studies where specific disturbances are evaluated and manipulation of various environmental factors (e.g., nutrients, temperature, and sediment) may be difficult (Piggott et al., 2015) [34] . Therefore, future studies evaluating the response of invertebrates to disturbances in Kenya should consider combining collection of field samples with mesocosm experiments where the effect of several environmental factors can be evaluated. This will help to gain a clearer understanding of the effects of multiple disturbances in stream ecosystems. During biomonitoring of streams using invertebrates, it is important to consider evaluation of invertebrates during different seasons because the distribution and composition of invertebrates are influenced by seasonal variability and this may affect various invertebrate-based indices that are applied in biomonitoring. For example, Stark and Phillips (2009) [35] evaluated the seasonality of invertebrate-based indices such as taxa richness, %EPT richness and the macroinvertebrate community index. All the indices portrayed a statistically significant seasonal variability in the studied streams. Sporka et al. (2006) [36] investigated the effect of seasonal variation on invertebrate metrics and showed that about 30 out of 76 metrics showed statistically significant differences between months. Another field study evaluated seasonal changes of invertebrate communities in a river receiving non-point source insecticide pollution and showed that the abundance of Ephemeroptera was significantly increased from the wet to the dry season. Abundance of the aforementioned taxon significantly decreased at the study site receiving non-point source pollution and there was a significant interaction between study sites and season for the three most common mayfly taxa (Bollmohr and Schulz, 2009) [37] . Therefore, the season of sampling can have a confounding effect when interpreting invertebrate-based biomonitoring results, and is thus an important factor that should be considered by future biomonitoring studies in Kenya. Future biomonitoring studies in Kenya should consider sampling different stream biotopes (e.g., riffles, pools, vegetation) because differences in invertebrate's taxa abundance and composition between different biotopes can affect biomonitoring results. For example, Dallas (2007) [38] evaluated the effect of biotope availability on benthic invertebrates and found that differences in biotopes in terms of individual taxa and invertebrates assemblage resulted in variability in the resultant South African Scoring System (SASS) scores. Differences in invertebrates assemblage was greater among biotopes than between study sites and all the three metrics that were investigated (i.e., SASS score, number of taxa and average score per taxon) differed significantly among biotopes. Another study evaluated the effect of biotopes on macro invertebrate community structure in streams and found that about 120 taxa were obtained from all the sampled biotopes, but not all invertebrates taxa were obtained from each stream. Invertebrates' taxonomic richness differed significantly among biotopes (Baker et al., 2016) [39] . The observed differences in invertebrates' assemblage demonstrate the importance of considering different biotopes when sampling invertebrates from different streams. Studies covering large spatio-temporal scales should be considered by future biomonitoring research projects in Kenya because the results of short-term studies (e.g., <1 year) may differ from those of studies covering longer periods (e.g., 10-20 years) of time. For example, Voelz et al. (2000) [40] evaluated the temporal and spatial trends in benthic macroinvertebrates data collected for a period of 15 years and showed that the composition and abundance of lotic macroinvertebrates assemblage remained comparatively constant over the 15-year period. However, during shorter time periods (i.e., 1 year), there was a significant reduction in macroinvertebrates density and taxa richness within the studied sites after high discharge and heavy spring runoff. The scarcity of large-scale macro invertebrate data in Kenya represents a field in which volunteer scientists (i.e., citizen scientists, Edwards et al., 2018) [41] could significantly contribute to stream ecosystems monitoring and management. The fauna of many Kenyan streams are not well known and this makes it difficult to identify many taxa up to the species level. Additionally, there is a paucity of published invertebrates identification keys (Ochieng et al., 2019) [42] . This indicates that the taxonomic knowledge of macroinvertebrates is still not very well developed and the taxonomic keys that can be used during identification of macroinvertebrates are not readily available. The keys that are available could possibly be unpublished and are either owned by individual people or institutions of high learning and research, hindering their accessibility by many people. In future, there is need to describe and inventorize the local invertebrate fauna (e.g., Mathooko, 1998) [43] because most species are still not well known. Additionally, there is need to compile comprehensive invertebrate identification keys to aquatic insects. An online database on the distribution, abundance, ecology and temporal characteristics of macroinvertebrates can also be useful to future studies focusing on benthic macroinvertebrates in Kenya. Training of personnel in taxonomic identification of invertebrates is also important in development of biomonitoring studies. A nation-wide biomonitoring program initiated the relevant government agencies can be helpful in coming up with consistent methods for biomonitoring of streams in Kenya. Consistency in the field and laboratory methods used by different institutions can make it easier to combine multiple data sets and enable large-scale biomonitoring (Buss et al., 2015) [44] . Biomonitoring at large spatial scales is increasingly becoming important because global issues such as climate change require data collected over large areas. In many regions of the world, such as Kenya, the biomonitoring indices that are used for assessing the ecological effects of disturbances in stream ecosystems are not yet well established. Therefore, indices that have been developed for other regions of the world, using their local macroinvertebrates, are typically used in biomonitoring of streams (Elias et al., 2014) [45] . Utilization of indices developed for other regions is challenging because macro invertebrate taxa portray regional variations, making the resultant indices to be less compatible when applied in biomonitoring of streams. For example, some stone flies (e.g., Perlidae) are rarely found in Kenya whereas they are abundant in temperate zones (Masese and Raburu, 2017) [46] . Therefore, it is necessary to evaluate the sensitivity of invertebrate-based biomonitoring indices developed for other regions of the world and modify them so that they match local conditions. For example, Masese and Raburu (2017) [46] assessed the performance of the EPT index in biomonitoring of tropical streams and found that the performance of the EPT index improved greatly when the invertebrates belonging to the Baetid, Caenid and Hydropsychid families were removed. The three aforementioned invertebrate families are relatively tolerant to organic pollution, are widely distributed and have high abundances in disturbed study sites. In summary, utilization of indices developed for other regions of the world will require a clear understanding of the ecology of local taxa, such as tolerance, so that such indices can be modified before adoption. Despite the fact that identification of macroinvertebrates to the species level is a better estimate of true ecosystem biodiversity and produces better results in comparison with family level biomonitoring (Lenat and Resh, 2001) [47] , many taxonomic indices developed around the world identify invertebrates up to the level of family rather than species (Elias et al., 2014) [45] . Identification of invertebrates up to the family, or genus, level could be necessitated by the time, expense and potential misidentification of specimens at the species level (Chessman et al., 2007) [48] . Future biomonitoring studies in Kenya should carefully consider factors such as level of invertebrate's identification necessary to distinguish varied levels of anthropogenic disturbances, costs associated with identification of invertebrates, level of expertise needed in invertebrates' identification, and the time needed for invertebrates' identification.
Although most studies in Kenya have focused on structural invertebrate-based indices (e.g., density, taxa richness), there has been an increase in application of functional indices such as biological and ecological traits (e.g., body shape, functional feeding groups) and molecular approaches (Li et al., 2010) [10] . Future studies in Kenya should consider using functional indices to complement structural indices in biomonitoring of aquatic ecosystems to better detect anthropogenic disturbances in stream ecosystems. One of the major challenges in biomonitoring of streams is establishment of reference sites which are devoid of present and historic anthropogenic disturbances. Many Kenyan river basins have been greatly modified by humans through disturbances such as deforestation, grazing and agriculture. This makes it difficult to establish reference sites that can be compared with the degraded sites. A potential solution to the challenge of establishing reference sites is the use of minimally disturbed condition concept (Stoddard et al., 2006) [49] where reference sites are taken to be those sites without significant anthropogenic disturbances. Despite the fact that many biomonitoring studies have been conducted in Kenya, there is a paucity of information on stream restoration projects. The relevant government agencies should use information generated by biomonitoring studies to implement restoration projects to protect stream ecosystems from further deterioration. Biomonitoring of streams in Kenya should be guided by clear legislations and policies and the government should provide adequate funds to facilitate more long-term monitoring and management of stream ecosystems. [55] ,
Merritt and Cummins, 1996 [76] Physico Gerber and Gabriel, 2002 [27] Physico Genus; Merritt and Cummins (1997) [26] , Mathooko 1998 [43] Physico Genus; Merritt and Cummins (1997) [26] , Mathooko 1998 [43] Physicochemical abundance, taxon richness, shannons diversity, EPT taxa Reduced taxa richness, increase in tolerant taxa, reduced EPT taxa and taxa richness Aura et al. 2010 [82] Wet Genus; Merritt and Cummins (1997) [26] , Mathooko 1998 [43] , Ndaruga et al. 2004 [56] , Kibichii et al 2007 [53] Physico [57] ,
Mathooko 1998 [43] , Tachet et al.
1980 [58] Physico Family; Gerber and Gabriel, 2002 [27] Physico [84] , Quigley 1977 [5] , Johanson 1992 [57] , Day et al. 2002 [60] Genus; Macan 1977 [84] , Merritt and Cummins 1996 [76] , Nilson 1996 [62] , Quigley 1977 [55] , Scholtz and Holm 1985 [63] , Johanson 1992 [57] ,
Mathooko 1998 [43] , Merritt and Cummins 1996 [76] , Merritt and Cummins 1996 [76] , Day et al. 2002 [60] Genus; Macan 1977 [84] , Scholtz and Holm 1985 [63] , Merritt and Cummins 1996 [76] , Nilson (1996, 1997) [62] , Johanson 1992 [57] , Mathooko 1998 [43] Physico Genus; Macan 1977 [84] , Scholtz and Holm 1985 [63] , Merritt and Cummins 1996 [76] , Nilson (1996, 1997) [62] , Johanson 1992 [57] , Mathooko 1998 [43] Physicochemical [60] , Stals and de Moor 2007 [67] Leaf litter decomposition, physicochemical parameters [60] , de Stals and de Moor 2007 [67] [75] wet university N/a N/a D-frame dip net Stones, mud, sand, vegetation 98/1 2 16
Order, family; Gerber and Gabriel, 2002 [27] , Day Genus; Merritt and Cummins (1996) [76] , Versuchen 1997, Mathooko 1998 [43] Physico [79] , Wieder-holm 1983, Savage 1989 [28] ,
Harrison 1991 [80] , 1992, 1996
Conclusion
In conclusion, there has been application of invertebratebased biomonitoring to evaluate stream ecological conditions in Kenya. The challenges that hinder application of invertebrates in biomonitoring need to be urgently addressed to improve the monitoring and management of stream ecosystems. In future, there will be need to establish a national biomonitoring program which will guide evaluation of ecological conditions in streams. Training in identification of invertebrates, use of complementary approaches (e.g., molecular analyses), publication of identification keys and biomonitoring at large spatio-temporal scales are examples of crucial factors that need to be addressed to improve application of invertebrates in biomonitoring of streams in future.
Figures and tables from the paper
| Reference | Season | Institution | Disturbance | Funding source | Sampler | Biotope | No. of sites/ watersheds | Study duration (months) | No. of taxa | Lowest Level of identification Keys | Other parameters | Invertebrate indices | Response to disturbance |
|---|---|---|---|---|---|---|---|---|---|---|---|---|---|
| Abongo et al. 2015 [24] | Wet, dry | University | Agriculture, deforestation, settlement, sewage, mining | IFS, Helb | D-frame dip net | N/a | 26/1 | 8 | 13 orders (16 families) | Order, family; Quigley 1977 [55], Merritt and Cummins, 1996 [76] | Physico- chemical | abundance, EPT, Shannon diversity, family richness | Increase in tolerant taxa (e.g. tubificids, hirudinea), decrease in diversity, decrease in EPT taxa |
| Aera et al. 2019 [22] | dry | University | Organic pollutants | Rotary club of vienna | D-frame dip net | Riffle, pool, run | 14/1 | 4 | 10 orders (18 families) | Order, family; Gerber and Gabriel, 2002 [27] | Physico- chemical | abundance, taxa richness, Margalefs diversity, Shannons diversity, species evenness, species similarity | Increase in tolerant taxa (e.g. chironomidae, decrease in diversity and taxa richness |
| Anyona et al. 2014 [81] | dry | University | Solid and liquid wastes, human settlement | East african community | D-frame dip net | N/a | 08/1 | 1 | 8 orders | Order, family; Needham, Egborge 1995 [83] | Physico- chemical, solid wastes | Abundance, Evenness, Shannons diversity, taxa richness | Increase in tolerant taxa, reduction in EPT taxa, reduced evenness, density and diversity |
| Aura et al. 2010 [82] | Wet, dry | KMFRI | Agriculture, sewage, urbanization | East African wildlife society | D-frame dip net | Riffle, pool, run | 07/1 | 5 | 13 orders (28 families, 31 genera) | Genus; Merritt and Cummins (1997) [26], Mathooko 1998 [43] | Physico- chemical | Functional feeding groups, abundance, shannons diversity, EPT taxa, taxa | Reduction of EPT taxa, increase in tolerant taxa, reduction in MIBI |
Table text extracted from the original PDF; superscript letters are shown inline. The original table image is below.
View original table image
| — | — | — | — | — | — | — | — | — | — | — | — | tolerance, MIBI | — |
|---|---|---|---|---|---|---|---|---|---|---|---|---|---|
| Aura et al. 2010 [82] | Wet, dry | KMFRI | Agriculture, sewage, urbanization | East African journal of ecology | D-frame dip net | Riffle, pool, run | 07/1 | 5 | 13 orders (28 families, 31 gener) | Genus; Merritt and Cummins (1997) [26], Mathooko 1998 [43] | Physico- chemical | abundance, taxon richness, shannons diversity, EPT taxa | Reduced taxa richness, increase in tolerant taxa, reduced EPT taxa and taxa richness |
| Aura et al. 2010 [82] | Wet, dry | KMFRI | Urbanization | IFS | D-frame dip net | Riffle, pool, run | 17/1 | 4 | 11 orders (20 families, 22 genera) | Genus; Merritt and Cummins (1997) [26], Mathooko 1998 [43], Ndaruga et al. 2004 [56], Kibichii et al 2007 [53] | Physico- chemical | Functional feeding groups, abundance, shannons diversity, EPT taxa, taxa tolerance, MIBI | Reduction of EPT taxa, increase in tolerant taxa, reduction in MIBI |
| Barnard and Biggs 1988 [50] | dry | Museum, university | N/a | Leicester university, royal society | net; surber | N/a | 113/1 | 2 | 64 taxa | Genus; N/a | N/a | Abundance, taxa richness | N/a |
Table text extracted from the original PDF; superscript letters are shown inline. The original table image is below.
View original table image
| Reference | Season | Institution | Disturbance | Funding source | Sampler | Biotope | No. of sites/watersheds | Study duration (months) | No. of taxa | Lowest Level of identification/ Keys | Other parameters | Invertebrate indices | Response to disturbance |
|---|---|---|---|---|---|---|---|---|---|---|---|---|---|
| Lancaster et al. 2008 [64] | Wet, dry | University | N/a | NERC | N/a | N/a | 111/1 | 14 | 1 | Genus; N/a | Stable isotopes analyses | abundance | N/a |
| Masese and Raburu 2017 [46] | dry | University | Agriculture, human settlement | NCST | Surber sampler | Pool, riffle, vegetation | 22/2 | 3 | 15 orders (84 families) | Order, family; Quigley 1977 [55], Merritt and Cummins 1996 [76], Day et al. 2002 [60], de Moor et al. 2003, Stals and de Moor 2007 [67] | Physico- chemical | EPT abundance | Decrease in EPT richness |
| Masese et al. 2009a [65] | Wet, dry | University | Agriculture, settlement | USAID | Surber sampler | Pool, riffle, runs | 66/1 | 6 | 13 orders (50 families) | Genus; Macan 1977 [84], Scholtz and Holm 1985 [63], Merritt and Cummins 1996 [76], Nilson (1996, 1997) [62], Johanson 1992 [57], Mathooko 1998 [43] | Physico- chemical | Taxa richness, abundance, shannons diversity, evenness, EPT richness | Reduced abundance, reduced taxon richness and EPT richness, increase in tolerant taxa, reduced diversity and evenness |
| Masese et al. 2009b [65] | dry | University | Agriculture, settlement, urbanization, mining, water abstraction, grazing | USAID | Surber sampler | riffle | 98/1 | 3 | 14 orders (45 families) | Genus; Macan 1977 [84], Scholtz and Holm 1985 [63], Merritt and Cummins 1996 [76], Nilson (1996, 1997) [62], Johanson 1992 [57], Mathooko 1998 [43] | Physico- chemical | Taxa richness, functional feeding groups, abundance, tolerance, MIBI | Reduced taxa richness, EPT taxa, diversity and MIBI. Increase in tolerant taxa |
| Masese et al. 2014b [66] | Wet, dry | University | Agriculture, settlement | Dutch ministry of foreign affairs | D-frame dip net | Riffles, pools | 24/1 | 5 | 109 taxa | Genus; Day et al. 2002 [60], Stals and de Moor 2007 [67] | Leaf litter decomposition, physico- chemical parameters | Abundance, functional feeding groups, taxa richness | Reduced taxa richness and shredders abundance |
| Masese et al. 2014 [66] | Wet, dry | University | Agriculture, settlement | Dutch ministry of foreign affairs | D-frame dip net | Riffles, pools | 20/1 | 2 | 109 taxa | Genus; Day et al. 2002 [60], de Stals and de Moor 2007 [67], | Physico- chemical, gut contents | Functional feeding groups, abundance, biomass, taxa richness | Decreased shredder abundance, invertebrates biomass, taxa richness. Increased scrapers abundance |
| Masese et al. 2018 [31] | Wet, dry | University | Agriculture, grazing settlement, deforestation | Dutch minist. Fore. affairs | D-frame dip net | N/a | 16/1 | 7 | 106 taxa | Genus; Merritt et al. 2008 | Physico- chemical, stable isotopes | Functional feeding groups, density | N/a |
Table text extracted from the original PDF; superscript letters are shown inline. The original table image is below.
View original table image
| Reference | Season | Institution | Disturbance | Funding source | Sampler | Biotope | No. of sites/watersheds | Study duration (months) | No. of taxa | Lowest level of identification/ Keys | Other parameters | Invertebrate indices | Response to disturbance |
|---|---|---|---|---|---|---|---|---|---|---|---|---|---|
| Mathooko 1995 | Wet, dry | University | N/a | NCST | Sampling baskets | riffle | 81/1 | 12 | 11 taxa | Genus, family | Physico- chemical | abundance, shannons diversity, evenness, species richness | N/a |
| Mathooko 1997 | Wet, dry | Research institute | Artificial physical disturbance | ÖAAD | Hess sampler | riffle | 91/1 | 8 | N/a | Genus | Physico- chemical | abundance, species richness | Decreased density and species richness |
| Mathooko 1998 [43] | Wet, dry | University | Artificial physical disturbance | ÖAAD | Hess sampler | riffle | 91/1 | 8 | 6 families | Genus;N/a | N/a | Biomass, abundance | Decrease in biomass and density |
| Mathooko 2000 | Wet, dry | University | Artificial physical disturbance | ÖAAD | Hess sampler | riffle | 91/1 | 8 | 7 taxa | Genus; N/a | N/a | Abundance, species richness | Decrease in density and species richness |
| Mathooko and Mavuti 1992 | Wet, dry | University | N/a | NCST | Substrate basket, drift sampler nets | riffle | 97/1 | 12 | 13 orders | Genus, family, order;N/a | Physico- chemical | abundance, taxa richness | N/a |
| Mathooko and Mavuti 1994 | Wet, dry | University | N/a | N/a | Drift sampler nets | N/a | 91/1 | 12 | 11 orders | Genus, family, order; N/a | N/a | abundance | N/a |
Table text extracted from the original PDF; superscript letters are shown inline. The original table image is below.
View original table image
| Reference | Season | Institution | Disturbance | Funding source | Sampler | Biotope | No. of sites/watersheds | Study duration (months) | No. of taxa | Lowest level of identification/ Keys | Other parameters | Invertebrate indices | Response to disturbance |
|---|---|---|---|---|---|---|---|---|---|---|---|---|---|
| Mathooko et al. 2005 [68] | dry | university | drought | N/a | corer | Pool | 33/1 | 8 | 1 genus | Genus; | n.a | Biomass, abundance | Reduction in biomass and abundance |
| Mathooko 1995 | Wet, dry | university | N/a | NCST | Sampling baskets | Riffle | 91/1 | 12 | 11 taxa | Genus, species; N/a | physico- chemical | Abundance, shannons diversity, evenness, taxa richness | N/a |
| Mathooko 1998a [43] | Wet, dry | university | Artifical physical disturbance | ÖAAD | Hess sampler | Riffle | 91/1 | 8 | 1 taxa | Species;N/a | N/a | Abundance | Reduced abundance |
| Mathooko 2001 [69] | Wet, dry | university | N/a | ÖAAD | Hess sampler | Riffle | 91/1 | 8 | 1 species | Species;N/a | physico- chemical | Abundance, biomass | N/a |
| Mathooko 2002 [70] | Wet, dry | university | Artifical physical disturbance | ÖAAD | Hess sampler | Riffle | 91/1 | 8 | 7 species | Species; N/a | N/a | Biomass, size, abundance | Reduction in biomass, size and abundance |
| Mbaka et al. 2014a [71] | dry | university | deforestation | N/a | Hess sampler | Riffle | 93/1 | 5 | 15 | Family, order; N/a | Benthic organic matter, physico- chemical | Abundance, shannons diversity, functional feeding groups | Decrease in abundance, diversity and density of collectors, predators and filter feeders |
| Mbaka et al. 2014b [71] | dry | university | Agriculture, water abstraction | Egerton University | Hess sampler | Riffle | 93/1 | 4 | 14 | Family, order; Gerber and Gabriel, 2002 [27] | physico- chemical | Abundance | Increase in sensitive taxa, reduced abundance |
| Mbaka et al. 2014c [71] | dry | university | Water abstraction, grazing, agriculture | Egerton university | Hess and D-frame dip net | Plant,stones, sand,mud | 96/2 | 2 | 17 | Order, family; Gerber and Gabriel, 2002 [27] | physico- chemical | Abundance, shannons diversity, taxa richness | decrease in diversity and taxa richness |
| Mbaka et al. 2016 [72] | dry | university | Human settlement, grazing | Egerton university | Hess sampler | Riffle | 93/1 | 2 | 17 | Order, family; Gerber and Gabriel, 2002 [27] | physico- chemical | Abundance, shannons diversity, evenness, multimetric index, simpsons and margalefs diversity | Reduced abundance, diversity and multimetric index and EPT taxa |
Table text extracted from the original PDF; superscript letters are shown inline. The original table image is below.
View original table image
| Referenc e | Seaso n | Institutio n | Disturbanc e | Funding source | Sampler | Biotope | No. of sites/watersh eds | Study duration (months) | No. of taxa | Lowest level of identification / Keys | Other parameter s | Invertebrat e indices | Response to disturbanc e |
|---|---|---|---|---|---|---|---|---|---|---|---|---|---|
| Mcclain et al. 2014 | Dry, wet | Research institute, university | Water abstraction, agriculture | USAID | D-frame dip net/surbe r sampler | Pool, riffle, runs | 96/1 | 5 | 34 | Order, family; | Physico- chemical, riparian vegetation, fish | EPT taxa, taxa richness, diversity | Decrease in diversity, EPT taxa and taxa richness |
| M'Erimba et al. 2014 b [71] | Dry, wet | university | Sewer, settlements, grazing, deforestatio n | ÖAAD | Hess sampler | N/a | 95/2 | 10 | 18 | Order, family; N/a | Physico- chemical | Shannons diversity, taxa richness, dominance index, similarity index | Reduction in diversity, abundance, taxa richness, increased similarity |
| M' Erimba et al. 2014 [71] | dry | university | Agriculture, water abstraction, grazing, deorestation | Egerton university | Hess sampler, D-frame dip net | N/a | 96/2 | 2 | 20 | Family; Gerber and Gabriel 2002 [27] | Physico- chemical | EPT taxa, taxa richness, shannons diversity, abundance, functional feeding groups | Reduction in EPT taxa, richness, diversity and functional feeding groups |
| M'Erimba et al. 2018 | dry | University | Grazing, agriculture | Egerton university | Drift net sampler | N/a | 92/2 | 2 | N/a | Order, family; Gerber and Gabriel 2002 [27] | Physico- chemical | Drift abundance | Increase in drift density |
Table text extracted from the original PDF; superscript letters are shown inline. The original table image is below.
View original table image
| Minaya et al. 2013 [73] | dry | Research institute, university | Agriculture, settlements | USAID, dutch foreign ministry | D-frame dip net | N/a | 25/1 | 2 | N/a | Genus; Gerber and Gabriel, 2002 [27] | Physico- chemical | Abundance, taxa richness | Increase in sensitive taxa, reduction in EPT taxa |
|---|---|---|---|---|---|---|---|---|---|---|---|---|---|
| Minoo et al. 2016 [23] | dry | Research institute, university | Aquaculture effluents | Aquafish innovatio n lab, USAID | Surber sampler | riffle | 99/1 | 9 | N/a | Order, family; Day et al. 2002 [60], de Moor 2003, Stals and de Moor 2007 [67], Merritt et al. 2008 [61] | N/a | Abundance, taxonomic richness, shannons diversity, EPT taxa, functional feeding groups, Indice biologique global normalize (IBGN) | Increase in abundance, reduced richness, diversity, IBGN values and EPT taxa |
| Mureithi et al. 2017 | dry | university | N/a | N/a | Drift net sampler | Riffle, pool | 91/1 | 3 | 26 | Order, family; Gerber and Gabriel, 2002 [27] | N/a | Drift abundance | N/a |
Table text extracted from the original PDF; superscript letters are shown inline. The original table image is below.
View original table image
| Reference | Season | Institution | Disturbance | Funding source | Sampler | Biotope | No. of sites/watersheds | Study duration (months) | No. of taxa | Lowest level of identification/ Keys | Other parameters | Invertebrate indices | Response to disturbance |
|---|---|---|---|---|---|---|---|---|---|---|---|---|---|
| Mureithi et al. 2018 | dry | university | Settlements, agriculture, industries | N/a | Drift net | Riffle | 91/1 | 3 | 23 | Order, family; Gerber and Gabriel, 2002 Orut24a, de Moor et al. 2003, Day et al. 2003 | Physico- chemical | Invertebrate drift | N/a |
| Ndaruga et al. 2004 [56] | Wet, dry | University, research institute | Settlements, agriculture, industries | Kenya museums society, kenyatta university | corer | N/a | 96/1 | 7 | 26 | Genus; Merritt and Cummins, 1996 [76] | Physico- chemical | Taxa richness, dominance, evenness, diversity, abundance, EPT taxa, functional feeding groups | Reduction in EPT taxa, decrease in diversity, increased abundance of grazers, predators |
| Odhiambo and Mwangi 2014 [74] | Wet, dry | university | N/a | N/a | Hess | N/a | 91/1 | 9 | 10 | Order, family; N/a | Coarse particulate organic matter | abundance | N/a |
| Oigara and Masese 2017 [75] | wet | university | N/a | N/a | D-frame dip net | Stones, mud, sand, vegetation | 98/1 | 2 | 16 | Order, family; Gerber and Gabriel, 2002 [27], Day and de Moor 2002, Day et al. 2002 [60], de Moor et al. 2003, Merritt et al. 2008 [61] | N/a | SASS, abundance, taxa richness | Reduced SASS scores, taxa richness and abundance |
| Oremo et al. 2019 [25] | N/a | university | Agriculture, grazing, urbanization, mining | TWAS, CEWERM | Plankton nets | N/a | 912/1 | N/a | 3 | Order, family; Voshell, 2002 [77] | Physico- chemical | N/a | N/a |
| Oruta et al. 2017 b | Dry, wet | University, water resources authority | Agriculture, grazing | N/a | D-frame dip net | Riffle, pool, run | 99/1 | 12 | 73 | Genus; Acûna et al. 2013, Australian Government, 2001, Mathooko 1998 | Canopy cover | Abundance, taxa richness, shannons diversity, evenness | Reduced abundance, taxa richness, diversity, evenness |
| Oruta et al. 2017 | Dry, wet | University, water resources authority | Agriculture, grazing | N/a | D-frame dip net | Riffle, pool, run | 99/1 | 12 | 73 | Genus; Acûna et al. 2013, Australian Government, 2001, Mathooko 1998 [43] | Physico- chemical | Taxa richness, abundance, evenness, shannons diversity | Reduced taxa richness, abundance, sensitive taxa and diversity |
Table text extracted from the original PDF; superscript letters are shown inline. The original table image is below.
View original table image
| Reference | Season | Institution | Disturbance | Funding source | Sampler | Biotope | No. of sites/watersheds | Study duration (months) | No. of taxa | Lowest level of identification/ Keys | Other parameters | Invertebrate indices | Response to disturbance |
|---|---|---|---|---|---|---|---|---|---|---|---|---|---|
| Osano et al. 2004 [29] | Wet, dry | university | urbanization | Moi University | D-frame dip net | N/a | 33/1 | 2 | 9 | Species; N/a | Heavy metals | abundance | Increased concentration of heavy metals in invertebrates |
| Raburu et al. 2009 [78] | Wet, dry | university | Agriculture, settlements | N/a | D-frame dip net | Riffle, pool, run | 22/2 | 6 | 15 | Genus; Merritt and Cummins (1996) [76], Versuchen 1997, Mathooko 1998 [43] | Physico- chemical | Abundance, EPT taxa, MIBI, taxa richness, functional | Reduced EPT taxa, MIBI, abundance, taxa richness and some feeding groups |
Table text extracted from the original PDF; superscript letters are shown inline. The original table image is below.
View original table image
References
74 in the original paper- Dudgeon D, Arthington A, Gessner M, Kawabata Z, Knowler D, Lévêque C, et al. Freshwater biodiversity: Importance, threats, status, and conservation challenges. Biological Reviews. 2006;81(2):165-182.
- Malmqvist B, Rundle S. Threats to the running water ecosystems of the world. Environmental Conservation. 2002;29(2):134-153.
- Bashir I, Lone FA, Bhat RA, Mir SA, Dar ZA, Dar SA. Concerns and threats of contamination on aquatic ecosystems. Bioremediation and Biotechnology. 2020;27:21-26.
- Forio MAE, Goethals PLM. An integrated approach of multi-community monitoring and assessment of aquatic ecosystems to support sustainable development. Sustainability. 2020;12(14):5603.
- Robert GK, Onyari CN, Mbaka JG. Development of a water quality assessment index for the Chania River, Kenya. African Journal of Aquatic Science. 2020;46(2):142-152.
- Kassegne AB, Leta S. Assessment of physic-chemical and bacteriological water quality of drinking water in Ankober District, Amhara Region, Ethiopia. Cogent Environmental Science. 2000;6(1):1791461.
- Zaldívar JM, Viaroli P, Newton A, deWit R, Ibañez C, Reizopoulou S, et al. Eutrophication in transitional waters. An overview. Transitional Waters Monographs. 2008;2(1):71-78.
- Holt EA, Miller SW. Bio-indicators using organisms to measure environmental impacts. Nature Education Knowledge. 2010;3(10):8.
- Li L, Zheng B, Liu L. Biomonitoring and bioindicators used for river ecosystems: definitions, approaches and trends. Procedia Environmental Sciences. 2010;2:1510-1524.
- Kolkwitz R, Marsson M. Grundsätze für die biologische beürteilung des wassers nach seiner flora and fauna. Mitteilingen Prüfungsanst Was serversorg Abwasserreinig. 1902;1:33-72.
- Woodiwiss FS. The biological system of stream classification by the Trent River Board. Chemistry and Industry. 1964;11:443-447.
- Chandler JR. A biological approach to water quality management. Water Pollution Control. 1970;69(4):415422.
- Chesters RK. Biological Monitoring Working Party: the 1978 national testing exercise. Technical memorandum 19. Department of the Environment, London; c1980.
- Chessman BC. Rapid assessment of rivers using macroinvertebrates: a procedure based on habitat-specific sampling, family level identification and a biotic index. Australian Journal of Ecology. 1995;20(1):6122-6129.
- Hilsenhoff WL. An improved biotic index of organic stream pollution. Great Lakes Entomologist. 1987;20(1):31-39.
- Ferreira WR, Paiva LT, Callisto M. Development of a benthic multimetric index for biomonitoring of a neotropical watershed. Brazilian Journal of Biology. 2011;71(1):15-25.
- Chutter FM. An empirical biotic index of the quality of water in South African streams and rivers. Water Research. 1972;6(1):19-30.
- Thorne RSJ, Williams WP. The response of benthic macro invertebrate to pollution in developing countries: a multimetric system of bio-assessment. Freshwater Biology. 1997;37(3):671-686.
- Dobson M, Mathooko JM, Ndegwa FK, M'Erimba C. Leaf litter processing rates in a Kenyan highland stream, the Njoro River. Hydrobiologia. 2003;519:207-210.
- Aera CN, M'Erimba CM, Nzula K. Effect of organic effluents on water quality and benthic macro invertebrate community structure in the Njoro River, Kenya. Journal of Environmental and Analytical Toxicology. 2019;9:2161.
- Minoo CM, Ngugi CC, Oyoo-Okoth E, Muthumbi A, Sigana D, Mulwa R, et al. Monitoring the effects of International Journal of Biology Sciences https://www.biologyjournal.net aquaculture effluents on benthic macroinvertebrate populations and functional feeding responses in a tropical highland head water stream (Kenya). Aquatic Ecosystem Health and Management. 2016;19(4):431-440.
- Abong'o DA, Wandiga SO, Jumba IO, Van den Brink PJ, Naziriwo BB, Madadi VO, et al. Occurrence, abundance and distribution of benthic macroinvertebrates in the Nyando River, Kenya. African Journal of Aquatic Sciences. 2015;40(4):373-392.
- Oremo J, Orata F, Owino J, Shivoga W. Assessment of heavy metals in benthic macroinvertebrates, water and sediments in River Isichu, Kenya. Environmental Monitoring and Assessment. 2019;191(11):646.
- Osano AM, Odanga JFE, Cheruiyot LL, Kituyi JL. Effects of zinc, lead and copper concentration levels on the distribution of macroinvertebrates: A case study of River Sosioni, Eldoret Town, Kenya. Journal of the Chemical Society. 2004;2:8-13.
- Mathooko JM. The sizes, maturity stages and biomass of mayfly assemblages colonizing disturbed stream bed patches in Central Kenya. African Journal of Ecology. 2002;40(1):84-93.
- Masese FO, Abrantes KG, Gettel GM, Irvine K, Bolillon S, McClain ME. Trophic structure of an African savanna river and organic matter inputs by large terrestrial herbivores: A stable isotope approach. Freshwater Biology. 2018;63(11):1365-1380.
- Folt CL, Chen Y, Moore MV, Burnaford J. Synergism and antagonism amid multiple stressors. Limnol. Oceanogr. 1999;44(3_part_2):864-877.
- Jackson MC, Loewen CJG, Vinebrooke RD, Chimimba CT. Net effects of multiple stressors in freshwater ecosystems: A meta-analysis. Global Change Biology. 2016;22(1):180189.
- Piggott JJ, Niyogi DK, Townsend CR, Matthaei CD. Multimetric stressors and stream ecosystem functioning: climate warming and agricultural stressors interact to affect processing of organic matter. Journal of Applied Ecology. 2015;52(5):1126-1134.
- Stark JD, Phillips N. Seasonal variability in the macro invertebrate community index: are seasonal correction factors required? New Zealand Journal of Marine and Freshwater Research. 2009;43(4):867-882.
- Sporka F, Vlek HE, Bulankova E, Kino I. Influence of seasonal variation on bio assessment of streams using macroinvertebrates. Hydrobiologia. 2006;566:543-555.
- Bollmohr S, Schulz R. Seasonal changes of macro invertebrate communities in a Western Cape River, South Africa, receiving non-point insecticide pollution. Environ. Toxicol. Chem. 2009;28(4):809-817.
- Dallas HF. The influence of biotope availability on macro invertebrate assemblages in South African rivers: implications for aquatic bio assessment. Freshwater Biology. 2007;52(2):370-380.
- Baker K, Chadwick MA, Kahar R, Sulaiman ZH, Wahab RA. Fluvial biotopes influence macro invertebrate biodiversity in South-East Asian tropical streams. Ecosphere. 2016;7(12):e01479.
- Voelz NJ, Shieh S, Ward JV. Long-term monitoring of benthic macro invertebrate community structure: A perspective from a Colorado River. Aquatic Ecology. 2000;34:261-278.
- Edwards PM. The value of long-term stream invertebrate data collected by citizen scientists. PLoS ONE. 2016;11(4):e0153.
- Ochieng H, Okot-Okumu J, Odong R. Taxonomic challenges associated with identification guides of benthic macroinvertebrates for biomonitoring freshwater bodies in East Africa: A review. African Journal of Aquatic Science. 2019;44(2):113-126.
- Mathooko JM. Mayfly diversity in East Africa. African Journal of Ecology. 1998;36:368-370.
- Buss DF, Carlisle DM, Chin T, Culp J, Harding JS, KeizerVlek HE, et al. Stream biomonitoring using macroinvertebrates around the globe: A comparison of large-scale programs. Environmental Monitoring and Assessment. 2015;187:4132.
- Elias JD, Ijumba JN, Mamboya FA. Effectiveness and compatibility of non-tropical biomonitoring indices for assessing pollution in tropical rivers-a review. International Journal of Ecosystem. 2014;4(3):128-134.
- Masese FO, Raburu PO. Improving the performance of the EPT index to accommodate multiple stressors in Afrotropical streams. African Journal of Aquatic Science. 2017;42(3):219-233.
- Lenat DR, Resh VH. Taxonomy and stream ecology: the benefits of genus and species-level identification. Journal of the North American Benthological Society. 2001;20(2):287-298.
- Chessman B, Williams S, Besley C. Bio-assessment of streams with macroinvertebrates: Effect of sampled habitat and taxonomic resolution. Journal of North American Benthological Society. 2007;26(3):546-565.
- Stoddard JL, Larsen DP, Hawkins CP, Johnson RK, Norris RH. Setting expectations for the ecological conditions of streams: the concept of reference condition. Ecological Applications. 2006;16(4):1267-1276.
- Barnard PC, Biggs J. Macroinvertebrates in the catchment streams of Lake Naivasha, Kenya. Revue D'hydrobiologie Tropicale. 1988;21(2):127-34.
- Dobson A. Environmental citizenship: Towards sustainable development. Sustainable Development. 2007;15(5):27685.
- Gichana Z, Njiru M, Raburu PO, Masese FO. Effects of human activities on benthic macro invertebrate community composition and water quality in the upper catchment of the M ara R iver B asin, K enya. Lakes & Reservoirs: Research & Management. 2015;20(2):128-37.
- Kibichii S, Shivoga WA, Muchiri M, Miller SN. Macro invertebrate assemblages along a land-use gradient in the upper River Njoro watershed of Lake Nakuru drainage basin, Kenya. Lakes & Reservoirs: Research & Management. 2007;12(2):107-17.
- Kobingi N, Raburu PO, Masese FO, Gichuki J. Assessment of pollution impacts on the ecological integrity of the Kisian and Kisat rivers in Lake Victoria drainage basin, Kenya. African Journal of Environmental Science and Technology. 2009;3(4):097-107.
- Quigley JM, Weinberg DH. Intra-urban residential mobility: a review and synthesis. International Regional Science Review. 1977;2(1):41-66.
- Ndaruga AM, Ndiritu GG, Gichuki NN, Wamicha WN. Impact of water quality on macro invertebrate assemblages along a tropical stream in Kenya. African Journal of Ecology. 2004;42(3):208-16.
- Johanson JF, Schmalz MJ, Geenen JE. Incidence and risk factors for biliary and pancreatic stent migration. Gastrointestinal endoscopy. 1992;38(3):341-6.
- Tachet P, Chambadal M. Development by SNCF of intercity Pull-and-push services for 160 KM/H. Rail Engineering International. 1980;9(2):58-64.
- Merritt C, Rasoloson D, Ko D, Seydoux G. 3′ UTRs are the primary regulators of gene expression in the C. elegans germline. Current Biology. 2008;18(19):1476-1482.
- Nilson JA, DiGiano FA. Influence of NOM composition on nanofiltration. Journal-American Water Works Association. 1996;88(5):53-66.
- Masese FO, Muchiri M, Raburu PO. Macroinvertebrate assemblages as biological indicators of water quality in the Moiben River, Kenya. African Journal of Aquatic Science. 2009;34(1):15-26.
- Masese FO, Kitaka N, Kipkemboi J, Gettel GM, Irvine K, McClain ME. Macroinvertebrate functional feeding groups in Kenyan highland streams: evidence for a diverse shredder guild. Freshwater Science. 2014;33(2):435-450.
- Stals R, De Moor IJ. Guides to the freshwater invertebrates of Southern Africa. Coleoptera. South African Water Research Commission Report TT, 2007, 320(07).
- Mathooko JM. Application of traditional ecological knowledge in the management and sustainability of fisheries in East Africa: A long-neglected strategy?. Hydrobiologia. 2005;537:1-6.
- Mathooko FM, Tsunashima Y, Owino WZ, Kubo Y, Inaba A. Regulation of genes encoding ethylene biosynthetic enzymes in peach (Prunus persica L.) fruit by carbon dioxide and 1-methylcyclopropene. Postharvest Biology and Technology. 2001;21(3):265-81.
- Mathooko JM, Otieno CO. Does surface textural complexity of woody debris in lotic ecosystems influence their colonization by aquatic invertebrates?. Hydrobiologia. 2002;489:11-20.
- Mbaka JG, M'Erimba CM, Thiongo HK, Mathooko JM. Water and habitat quality assessment in the Honi and Naro Moru rivers, Kenya, using benthic macroinvertebrate assemblages and qualitative habitat scores. African Journal of Aquatic Science. 2014;39(4):361-368.
- Mbaka G, Ejiwunmi A, Alabi O, Olatayo T. Digital dermatoglyphic variation and migratory pattern of ethnic Liberians. Egyptian Journal of Forensic Sciences. 2016;6(4):416-421.
- Minaya V, McClain ME, Moog O, Omengo F, Singer GA. Scale-dependent effects of rural activities on benthic macroinvertebrates and physico-chemical characteristics in headwater streams of the Mara River, Kenya. Ecological Indicators. 2013;32:116-22.
- Odhiambo C, Mwangi BM. Influence of large woody debris accumulations on macroinvertebrate distribution in a low order forested tropical stream, Sagana river, Kenya. Journal of Agriculture, Science and Technology. 2014;16(3):13-24.
- Oigara DK, Masese FO. Evaluation of the South African Scoring System (SASS 5) biotic index for assessing the ecological condition of the Mara River, Kenya. African Journal of Education, Science and Technology. 2017;4(2):41-51.
- Raburu PO, Masese FO, Mulanda CA. Macroinvertebrate Index of Biotic Integrity (M-IBI) for monitoring rivers in the upper catchment of Lake Victoria Basin, Kenya. Aquatic Ecosystem Health & Management. 2009;12(2):197-205.
- Pinder III JE, Wiener JG, Smith MH. The Weibull distribution: a new method of summarizing survivorship data. Ecology. 1978;59(1):175-179.
- Harrison S. Local extinction in a metapopulation context: an empirical evaluation. Biological Journal of the Linnean Society. 1991;42(1-2):73-88.
- Dida GO, Gelder FB, Anyona DN, Matano AS, Abuom PO, Adoka SO, et al. Distribution and abundance of schistosomiasis and fascioliasis host snails along the Mara River in Kenya and Tanzania. Infection Ecology & Epidemiology. 2014;4(1):24281.
- Kijchavengkul T, Auras R, Rubino M, Selke S, Ngouajio M, Fernandez RT. Biodegradation and hydrolysis rate of aliphatic aromatic polyester. Polymer Degradation and Stability. 2010;95(12):2641-2647.
- Ogbeibu AE, Egborge AB. Hydrobiological studies of water bodies in the Okomu Forest Reserve (Sanctuary) in southern Nigeria. 1. Distribution and diversity of the invertebrate fauna. Tropical Freshwater Biology. Benin City. 1995;4:1-27.
- Macan TT. The influence of predation on the composition of fresh-water animal communities. Biological Reviews. 1977;52(1):45-70.
- Verstraete F, Dehaene J, De Moor B. Normal forms and entanglement measures for multipartite quantum states. Physical Review A. 2003;68(1):012-103.