
Research article · 2023 · Full text
International Journal of Agriculture and NutritionVariation of floral diversity of Baturiya wetland game reserve Hadejia Jigawa state, Nigeria
Volume 5(1) · Pages 114–119 · DOI: 10.33545/26646064.2023.v5.i1b.107 ↗
Research areasAfrican Botany and Ecology Studies
Abstract
Author-writtenThis study aimed at determining the variation of floral diversity of Baturiya wetland game reserve. Three (3) sample plots of 100m x 100m were located in the reserve using stratified sampling method, a sub-plot of 50m x 50m were randomly laid in each of the plot. All floral species were identified and enumerated. Shannon weiner diversity index was use to determine plant species diversity. The results showed that plot 2 has the highest plant diversity index of 3.189 followed by plot 3 having 2.647 and plot 1 with 2.396. The similarity index calculated was 1.074 which shows that there is overlapping of species among the sampled plots. Analysis of Variance (ANOVA) result conducted shows no significant relationship among the sampled plots (P>0.05). This calls for among others the need to preserve the wetland game reserve and the use of its resources sustainably.
Summary
Source-checkedPlain-language reading of the full paper, prepared with AI and checked against the text. Each point links to the authors' own words.
Why it matters
- Wetlands are critical for ecological and hydrological processes, providing diverse habitats that support a wide variety of plant and animal species. View evidence ↗
- In their ecological role, wetlands help recharge groundwater and act as natural barriers against desertification. View evidence ↗
- Nigerian wetlands face threats from human activities, including logging, dredging, population pressure, and infrastructure construction. View evidence ↗
The question
- The study aimed to determine how floral diversity varies within the Baturiya wetland game reserve. View evidence ↗
- The researchers sought to create a checklist and analyze the composition and similarity of floral diversity to establish baseline data for the reserve's management. View evidence ↗
What they did
- The study used a stratified sampling method to establish three 100m x 100m sample plots, with a 50m x 50m sub-plot randomly placed in each. View evidence ↗
- The Shannon-Weiner diversity index was employed to measure the diversity of plant species across the plots. View evidence ↗
- Sorenson's Coefficient was used to calculate the similarity index between the sampled plots. View evidence ↗
- Analysis of Variance (ANOVA) was performed to test for significant variations in diversity among the plots. View evidence ↗
What they found
- The reserve's floral checklist identified 95 different species from 42 families, totaling 901 individual plants. View evidence ↗
- Plot 2 exhibited the highest plant diversity index (3.189), while Plot 3 (2.647) and Plot 1 (2.396) had lower indices. View evidence ↗
- A similarity index of 1.074 indicates that there is an overlap of plant species among the sampled plots. View evidence ↗
- ANOVA results showed no significant relationship or difference among the sampled plots (P > 0.05). View evidence ↗
What it means
- The authors state that the floral checklist demonstrates a high presence of biodiversity within the Baturiya wetland game reserve. View evidence ↗
Visual summary
1 visualsIllustrations explain the paper; they do not show study data.
Sampling Design
AI-generated conceptual illustration (Baturiya wetland vegetation). It explains the idea and does not show study data.
View source evidence ↗Figures & tables
From the original paper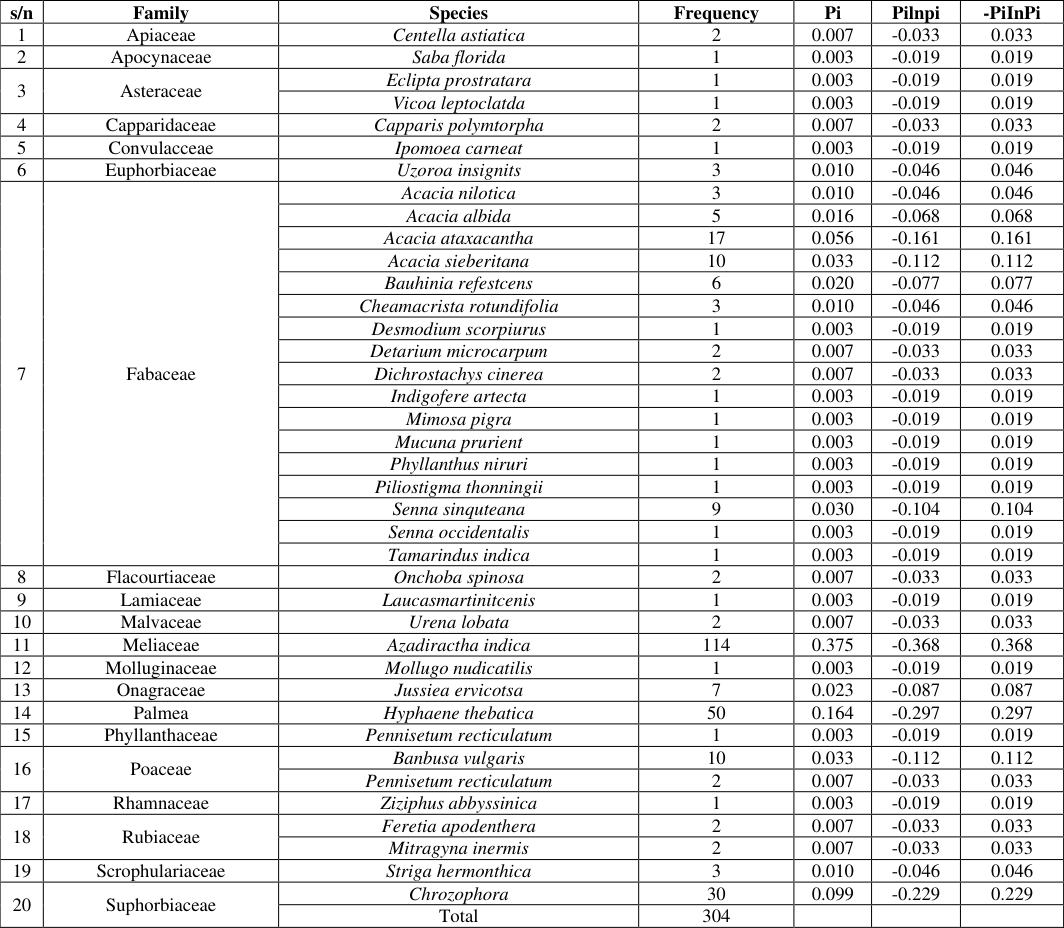 Table 1
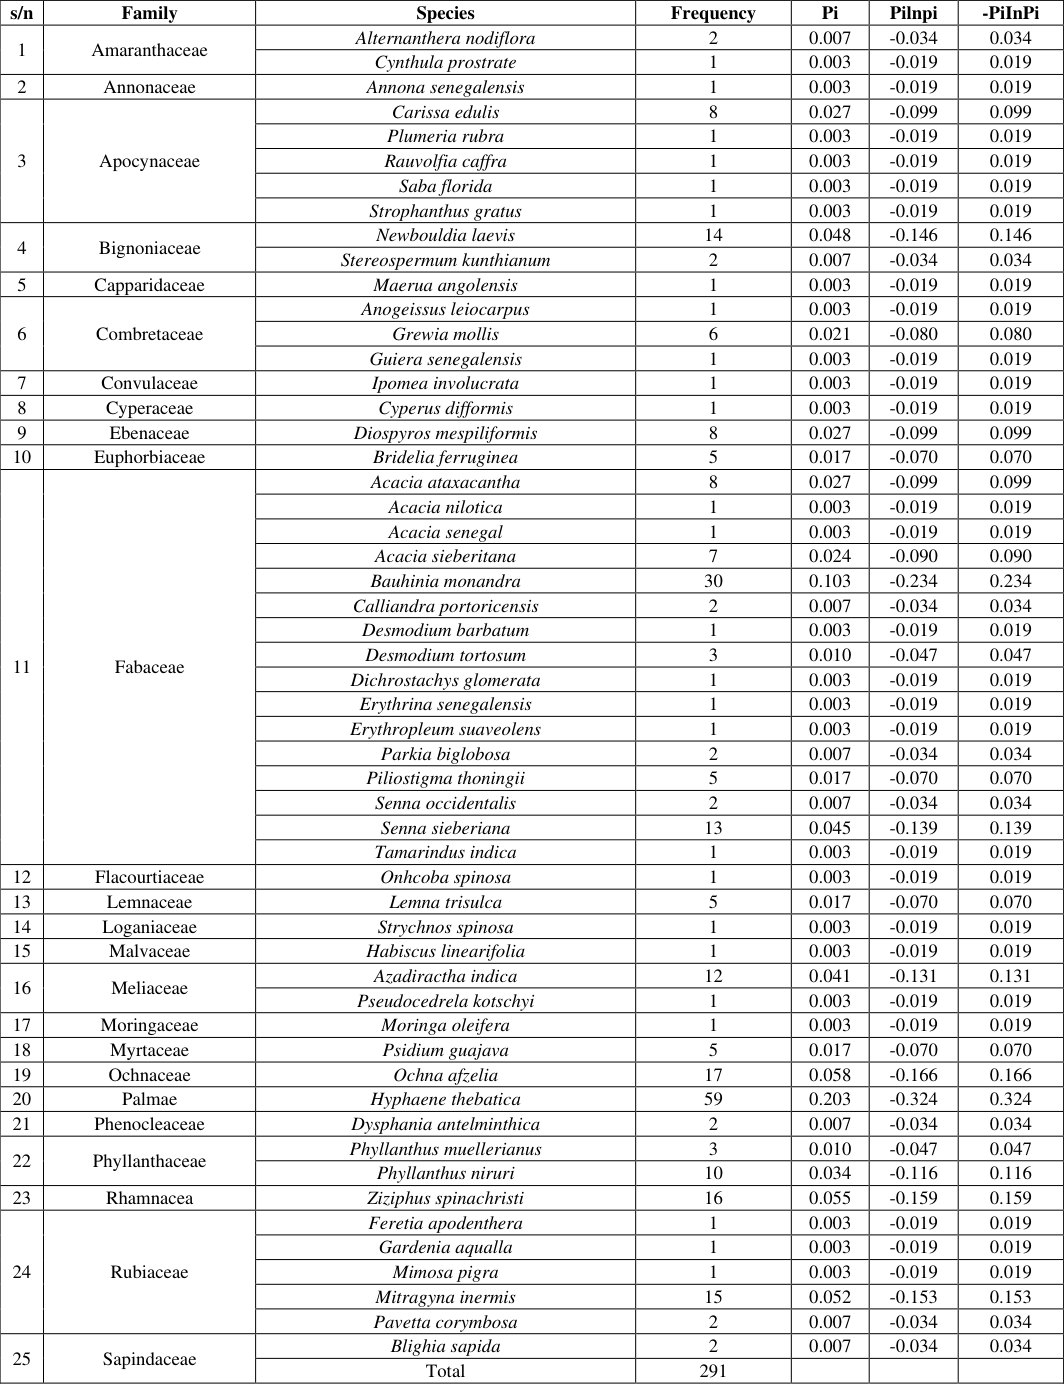 Table 2
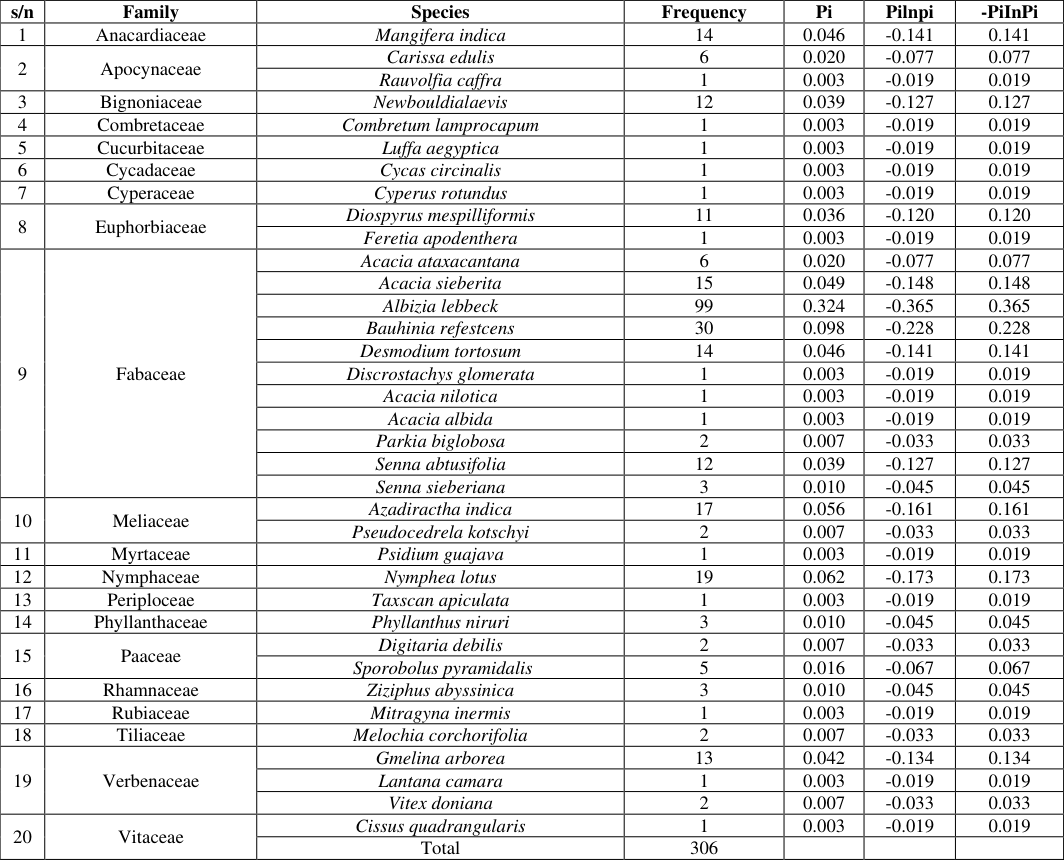 Table 3
 Table 4
Introduction
Wetland is an area of land where the soil is sutured with moisture either permanently or seasonally such areas may also be covered partially or completely by shallow pools of water. Wetlands are also defined as transitional land between terrestrial and aquatic system that are characterized by certain water regimes, plant species and soil characteristics (Winter, 2013) [17] . Douglas (2009) [3] defined wetland as geographic area with characteristics of both dry land and bodies of water. Wetland typically occur in low lying areas that receive fresh water at edges of lakes, ponds, streams, rivers or salt water from tides in coastal areas protected from waves. In wetlands, water level called the water table is usually at above or just below the soil surface for enough time to restrict the growth of plant to those adapted to wet condition and promote the development of soil characteristics of wet environment Hadejia Nguru wetlant conservation project (HNWCP, 1999) [5] . Wetlands are essential for hydrological and ecological process and they support a rich flora and fauna, they have different habitats and are places were different species of flora and fauna live. Wetlands act as a water filter, nutrients and sediments are abundant and that makes it possible for many species to live (HNWCP, 1999) [5] . Wetlands are found on every continent (except Antartica) and in climates ranging from tropic to the tundra. They occupy about six percent (6%) of the land surface of the world or approximately 890 million hectares and vary in location and size (Douglas, 2009) [3] . Some wetlands cover a few million hectares while others are only a few thousand square meters, International Union for Conservation of nature (IUCN, 1980) [7] . They are found in many countries such as the United Kingdom, Iraq, South Africa and the United States. Wetlands are the subject of National Conservation Foundation (NCF, 2010) [11] . Notable African wetlands Indicated on the map of Africa are Logon flood plain in Cameroon, Amsuri wetland of Ghana, Baobalon wetland in Gambia, Seri wetland in Mali and Hadejia Nguru wetlands in Nigeria. Nigeria is uniquely bestowed with fresh water wetlands and the coasted saline wetlands. They produce numerous products for man and wildlife. They provide economic and good opportunities to observe wildlife and also educate people during field and school practical on ecology. Indeed, wetlands are considered as the most biologically diverse of all ecosystems (HNWCP, 1999) [5] .
The wetlands also support over 250,000 herds of cattle which encourage cattle which encourage cattle traders, with an annual turnover of 416 million naira (HNWCP, 1999) [5] . Ecologically, the wetlands serve as a natural barrier to the process of desertification and play a major role in the recharge of ground water in the basin (HNWCP, 1999) [5] . Baturiya wetland game reserve focuses on protecting the forest and conserving its natural resources in their domain. It also serve as a center for recreational services, tourism, excursion and scientific researches (Kabir, 2006) [9] . Nigeria wetland resources are currently being threatened by certain anthropogenic and bio-geophysical factors. Notable among such factors are population pressure, logging, dredging, unprecedented land reclamation, construction of dams, transportation routes and other infrastructures (Anonymous, 2006) [1] . Olubode et al., (2002) [12] in their study on floral diversity of wetlands of Apete and Aleye River Ibadan, Nigeria indicated that a total of thirty eight (38) plant species belonging to nineteen (19) families were enumerated. Continued perturbation of the wetlands encouraged proliferation and dominance of some invasive species at the expense of native species populations, leading to subtle biodiversity erosion. This study aims to provide a checklist, composition, similarity and variation of floral diversity among the sampled plots of the game reserve, with a view of providing a baseline data for good management of the entire wetland game reserve.
Materials and Methods
Baturiya Hadejia-wetlands is a wide expense of flood plain wetlands situated in the northeast Nigeria, the location lies in the Sudano-Sahelian zone, which is the zone between the Sudano-Savanna in the South and the Sahel in the North. The wetland is found in Yobe State, located in the Northern part of Nigeria, which include the Nguru Lake (Eatol and Sarah, 1997) [4] . According to Ramsar, (1994) [14] , Baturiya which is a section of the Hadejia Nguru wetlands, is located on the Latitude 12 o 20 ' 0 " N to 12 o 40' 0"N and longitude 10 o 10' 0" E to 10 o 30' 0" E. The topography is characterized by mostly low-lying flat surfaces on the North Eastern side of the reserve and limited local relief in the Southern and Western parts that provide sites for settlement. The alluvial soil of Baturiya have been describe by Kolawale (1991) [10] as deep (1.5m) and hydromorphic, with high water retention capacity and poor drainage. Rainfall Pattern in the reserve has not been stable over the years but in most cases rainfall starts from May to September. The mean annual rainfall ranges from 600mm to 850mm (Ramsar, 2008) [13] . Dry season usually extend from October to April and temperature in the reserve vary with the time of the year, usually reaching about 45 0 C between April and May and less than 19 o C during hammatan season (Bdliya, 1998) [2] . The vegetation of the study area comprises varieties of Acacia spp, Adansonia spp, Tamarindus spp, Mitrogynus spp, Diospyrus spp, Faidhebia spp, Ficus spp and Hyphaene spp
Survey and Sampling Procedure
Reconnaissance survey was carried out in the study area to accessed the general features of the wetland. Three (3) sample plots of 100m x 100m were located using stratified sampling method, a sub-plot of 50m x 50m were randomly laid in each of the plot. All floral species were enumerated by direct counting and a checklist of floral species (trees, shrubs, etc) in the sample plots was made as adopted by Kwaga et al., [8] .
Data Analysis
Shannon-weiner (1949) [15] diversity index was use to determine the diversity of floral species in the sampled plots C = number of species the three plots have in common P 1 = total number of species found in plot 1 P 2 = total number of species found in plot 2 P 3 = total number of species found in plot 3 Analysis of variance (ANOVA) was also use to test for the variation among the sampled plots.
Results and Discussion
Results and Discussion
Floristic composition and diversity
The checklist of floral species in Baturiya wetland game reserve showed a total of 901 individual species belonging to 42 families and 95 different species (Table 1, 2 and 3). A total of 39 species were enumerated in sample plot 1, the diversity was 2.396 with an equitability (evenness of distribution) measured by J value as 0.419. The specie that has the highest population is Azadiractha indica having a frequency of 114 and relative frequency of 37.5% followed by Hyphaene thebatica having 50 and relative frequency of 16.4% while Saba florida, Eclipta prostratara, Vicoa leptoclatda, Ipomoea carneat, Desmodium scorpiurus, Indigofera ardecta, Mimosa pigra, Mucuna prurient, phyillanthus nitruri, Piliostigma thonningii, Senna occidentalis, Tamarindus indica, Leucas martinitcensis, Mollugo nudicatulis, Pennisetum recticulatum, and Ziziphus abyssinica has the lowest frequency of 1 and relative frequency 0.33% (Table 1). In sample plot 2 Hyphaene thebatica has the highest population of 59 with relative frequency of 20.3% followed by Bauhinia Monandra having 30 and relative frequency of 10.3% while cyathula prostrate, Anona senegalensis, Plumeria rubra, Rauvolfia caffra, Saba florida, Strophanthus gratus, Maerua angolensis, Anogeissus leiocarpus, Guiera senegalensis, Ipomea involucrata, Cyperus difformis, Acacia senegal, Desmodium barbatum, Dichrostachys glomerata, Erythrina senegalensis, Erythropleum suaveolens, Tamarindus indica, Onhcoba spinosa, Strychnos spinosa, Hibiscus linearifolia, Pseudocedrela kotschyi, Moringa oleifera, Feretia apodenthera, Gardenia aqualla, and Mimosa pigra has the least frequency of 1 with relative frequency of 0.34% (Table 2). The diversity index of sample plot 2 was the highest with 3.189 with evenness range of distribution of 0.562. Albizia lebback in sample plot 3 has the highest population with a frequency of 99 and relative frequency of 32.4% followed by Bauhinia rufestcens having a frequency of 30 and relative frequency of 9.80% while Rauvolfia caffra, Combretum lamprocapum, Luffa aegyptiaca, Cusas circinalis, Cyperus rotundus, Feretia apodenthera, Discrostachys glomerata, Acacia nilotica, Acacia albida, Psidium guajava, Taxscan apiculata, Mitragyna inermis, Lantana camara and Cissus quadrangularis has the lowest frequency of 1 and relative frequency 0.33%. The diversity index of sample plot 3 was 2.647 with an evenness of distribution value is as 0.463 (Table 3). The slight high population of few floral species recorded in the sample plots in the study area may be attributed to availability of viable seeds of trees to sustain regeneration or favorable microclimate within the forest. The dominance of Azadiractha indica, Hyphaene thebatica, and Albizia lebbeck in sample plot 1, 2 and 3 may be attributed to their efficiency in seed dispersal mechanism (Udo et al,. 2007) [16] while the low species representation could be due to poor regeneration abilities and/or anthropogenic activities (Zhigila et al., 2016) [18] . The high flora species diversity recorded in sample plot 2 is an indicator of a healthy reserve particularly in the area and lesser or no anthropogenic activities while the lower diversity index of flora species in sample plot 1 and 3 indicates that these floral species are low in their distribution; similar findings were reported by Udo et al., (2007) [16] . Also over exploitation and total alteration of forest ecosystems lead to the destruction of tree species (Iroko el al., 2008) [6] . The low diversity index in some sample plots may be as a result of tree logging for timber and fuelwood collected /harvested in the sample plot areas. In view of such needs, a number of these floral species evolve into rare and threatened. If forest are overexploited, the different usage and functions connected with them can be lost. However, it ought to be well known that major quantitative consideration of species varieties connecting forest environments are dependent on plot size, sample size, climatic factors, as well as other site components.
| s/n | Family | Species | Frequency | Pi | Pilnpi | -PiInPi |
|---|---|---|---|---|---|---|
| 1 | Anacardiaceae | Mangifera indica | 14 | 0.046 | -0.141 | 0.141 |
| 2 | Apocynaceae | Carissa edulis | 6 | 0.020 | -0.077 | 0.077 |
| Rauvolfia caffra | 1 | 0.003 | -0.019 | 0.019 | ||
| 3 | Bignoniaceae | Newbouldialaevis | 12 | 0.039 | -0.127 | 0.127 |
| 4 | Combretaceae | Combretum lamprocapum | 1 | 0.003 | -0.019 | 0.019 |
| 5 | Cucurbitaceae | Luffa aegyptica | 1 | 0.003 | -0.019 | 0.019 |
| 6 | Cycadaceae | Cycas circinalis | 1 | 0.003 | -0.019 | 0.019 |
| 7 | Cyperaceae | Cyperus rotundus | 1 | 0.003 | -0.019 | 0.019 |
| 8 | Euphorbiaceae | Diospyrus mespilliformis | 11 | 0.036 | -0.120 | 0.120 |
| Feretia apodenthera | 1 | 0.003 | -0.019 | 0.019 | ||
| 9 | Fabaceae | Acacia ataxacantana | 6 | 0.020 | -0.077 | 0.077 |
| Acacia sieberita | 15 | 0.049 | -0.148 | 0.148 | ||
| Albizia lebbeck | 99 | 0.324 | -0.365 | 0.365 | ||
| Bauhinia refestcens | 30 | 0.098 | -0.228 | 0.228 | ||
| Desmodium tortosum | 14 | 0.046 | -0.141 | 0.141 | ||
| Discrostachys glomerata | 1 | 0.003 | -0.019 | 0.019 | ||
| Acacia nilotica | 1 | 0.003 | -0.019 | 0.019 | ||
| Acacia albida | 1 | 0.003 | -0.019 | 0.019 | ||
| Parkia biglobosa | 2 | 0.007 | -0.033 | 0.033 | ||
| Senna abtusifolia | 12 | 0.039 | -0.127 | 0.127 | ||
| Senna sieberiana | 3 | 0.010 | -0.045 | 0.045 | ||
| 10 | Meliaceae | Azadiractha indica | 17 | 0.056 | -0.161 | 0.161 |
| Pseudocedrela kotschyi | 2 | 0.007 | -0.033 | 0.033 | ||
| 11 | Myrtaceae | Psidium guajava | 1 | 0.003 | -0.019 | 0.019 |
| 12 | Nymphaceae | Nymphea lotus | 19 | 0.062 | -0.173 | 0.173 |
| 13 | Periploceae | Taxscan apiculata | 1 | 0.003 | -0.019 | 0.019 |
| 14 | Phyllanthaceae | Phyllanthus niruri | 3 | 0.010 | -0.045 | 0.045 |
| 15 | Paaceae | Digitaria debilis | 2 | 0.007 | -0.033 | 0.033 |
| Sporobolus pyramidalis | 5 | 0.016 | -0.067 | 0.067 | ||
| 16 | Rhamnaceae | Ziziphus abyssinica | 3 | 0.010 | -0.045 | 0.045 |
| 17 | Rubiaceae | Mitragyna inermis | 1 | 0.003 | -0.019 | 0.019 |
| 18 | Tiliaceae | Melochia corchorifolia | 2 | 0.007 | -0.033 | 0.033 |
| 19 | Verbenaceae | Gmelina arborea | 13 | 0.042 | -0.134 | 0.134 |
| Lantana camara | 1 | 0.003 | -0.019 | 0.019 | ||
| Vitex doniana | 2 | 0.007 | -0.033 | 0.033 | ||
| 20 | Vitaceae | Cissus quadrangularis | 1 | 0.003 | -0.019 | 0.019 |
| Total | 306 |
Table text extracted from the original PDF; superscript letters are shown inline. The original table image is below.
View original table image
| s/n | Family | Species | Frequency | Pi | Pilnpi | -PiInPi |
|---|---|---|---|---|---|---|
| 1 | Amaranthaceae | Alternanthera nodiflora | 2 | 0.007 | -0.034 | 0.034 |
| Cynthula prostrate | 1 | 0.003 | -0.019 | 0.019 | ||
| 2 | Annonaceae | Annona senegalensis | 1 | 0.003 | -0.019 | 0.019 |
| 3 | Apocynaceae | Carissa edulis | 8 | 0.027 | -0.099 | 0.099 |
| Plumeria rubra | 1 | 0.003 | -0.019 | 0.019 | ||
| Rauvolfia caffra | 1 | 0.003 | -0.019 | 0.019 | ||
| Saba florida | 1 | 0.003 | -0.019 | 0.019 | ||
| Strophanthus gratus | 1 | 0.003 | -0.019 | 0.019 | ||
| 4 | Bignoniaceae | Newbouldia laevis | 14 | 0.048 | -0.146 | 0.146 |
| Stereospermum kunthianum | 2 | 0.007 | -0.034 | 0.034 | ||
| 5 | Capparidaceae | Maerua angolensis | 1 | 0.003 | -0.019 | 0.019 |
| 6 | Combretaceae | Anogeissus leiocarpus | 1 | 0.003 | -0.019 | 0.019 |
| Grewia mollis | 6 | 0.021 | -0.080 | 0.080 | ||
| Guiera senegalensis | 1 | 0.003 | -0.019 | 0.019 | ||
| 7 | Convulaceae | Ipomea involucrata | 1 | 0.003 | -0.019 | 0.019 |
| 8 | Cyperaceae | Cyperus difformis | 1 | 0.003 | -0.019 | 0.019 |
| 9 | Ebenaceae | Diospyros mespiliformis | 8 | 0.027 | -0.099 | 0.099 |
| 10 | Euphorbiaceae | Bridelia ferruginea | 5 | 0.017 | -0.070 | 0.070 |
| 11 | Fabaceae | Acacia ataxacantha | 8 | 0.027 | -0.099 | 0.099 |
| Acacia nilotica | 1 | 0.003 | -0.019 | 0.019 | ||
| Acacia senegal | 1 | 0.003 | -0.019 | 0.019 | ||
| Acacia sieberitana | 7 | 0.024 | -0.090 | 0.090 | ||
| Bauhinia monandra | 30 | 0.103 | -0.234 | 0.234 | ||
| Calliandra portoricensis | 2 | 0.007 | -0.034 | 0.034 | ||
| Desmodium barbatum | 1 | 0.003 | -0.019 | 0.019 | ||
| Desmodium tortosum | 3 | 0.010 | -0.047 | 0.047 | ||
| Dichrostachys glomerata | 1 | 0.003 | -0.019 | 0.019 | ||
| Erythrina senegalensis | 1 | 0.003 | -0.019 | 0.019 | ||
| Erythropleum suaveolens | 1 | 0.003 | -0.019 | 0.019 | ||
| Parkia biglobosa | 2 | 0.007 | -0.034 | 0.034 | ||
| Piliostigma thoningii | 5 | 0.017 | -0.070 | 0.070 | ||
| Senna occidentalis | 2 | 0.007 | -0.034 | 0.034 | ||
| Senna sieberiana | 13 | 0.045 | -0.139 | 0.139 | ||
| Tamarindus indica | 1 | 0.003 | -0.019 | 0.019 | ||
| 12 | Flacourtiaceae | Onhcoba spinosa | 1 | 0.003 | -0.019 | 0.019 |
| 13 | Lemnaceae | Lemna trisulca | 5 | 0.017 | -0.070 | 0.070 |
| 14 | Loganiaceae | Strychnos spinosa | 1 | 0.003 | -0.019 | 0.019 |
| 15 | Malvaceae | Habiscus linearifolia | 1 | 0.003 | -0.019 | 0.019 |
| 16 | Meliaceae | Azadiractha indica | 12 | 0.041 | -0.131 | 0.131 |
| Pseudocedrela kotschyi | 1 | 0.003 | -0.019 | 0.019 | ||
| 17 | Moringaceae | Moringa oleifera | 1 | 0.003 | -0.019 | 0.019 |
| 18 | Myrtaceae | Psidium guajava | 5 | 0.017 | -0.070 | 0.070 |
| 19 | Ochnaceae | Ochna afzelia | 17 | 0.058 | -0.166 | 0.166 |
| 20 | Palmae | Hyphaene thebatica | 59 | 0.203 | -0.324 | 0.324 |
| 21 | Phenocleaceae | Dysphania antelminthica | 2 | 0.007 | -0.034 | 0.034 |
| 22 | Phyllanthaceae | Phyllanthus muellerianus | 3 | 0.010 | -0.047 | 0.047 |
| Phyllanthus niruri | 10 | 0.034 | -0.116 | 0.116 | ||
| 23 | Rhamnacea | Ziziphus spinachristi | 16 | 0.055 | -0.159 | 0.159 |
| 24 | Rubiaceae | Feretia apodenthera | 1 | 0.003 | -0.019 | 0.019 |
| Gardenia aqualla | 1 | 0.003 | -0.019 | 0.019 | ||
| Mimosa pigra | 1 | 0.003 | -0.019 | 0.019 | ||
| Mitragyna inermis | 15 | 0.052 | -0.153 | 0.153 | ||
| Pavetta corymbosa | 2 | 0.007 | -0.034 | 0.034 | ||
| 25 | Sapindaceae | Blighia sapida | 2 | 0.007 | -0.034 | 0.034 |
| Total | 291 |
Table text extracted from the original PDF; superscript letters are shown inline. The original table image is below.
View original table image
| s/n | Family | Species | Frequency | Pi | Pilnpi | -PiInPi |
|---|---|---|---|---|---|---|
| 1 | Apiaceae | Centella astiatica | 2 | 0.007 | -0.033 | 0.033 |
| 2 | Apocynaceae | Saba florida | 1 | 0.003 | -0.019 | 0.019 |
| 3 | Asteraceae | Eclipta prostratara | 1 | 0.003 | -0.019 | 0.019 |
| Vicoa leptoclatda | 1 | 0.003 | -0.019 | 0.019 | ||
| 4 | Capparidaceae | Capparis polymtorpha | 2 | 0.007 | -0.033 | 0.033 |
| 5 | Convulacceae | Ipomoea carneat | 1 | 0.003 | -0.019 | 0.019 |
| 6 | Euphorbiaceae | Uzoroa insignits | 3 | 0.010 | -0.046 | 0.046 |
| 7 | Fabaceae | Acacia nilotica | 3 | 0.010 | -0.046 | 0.046 |
| Acacia albida | 5 | 0.016 | -0.068 | 0.068 | ||
| Acacia ataxacantha | 17 | 0.056 | -0.161 | 0.161 | ||
| Acacia sieberitana | 10 | 0.033 | -0.112 | 0.112 | ||
| Bauhinia refestcens | 6 | 0.020 | -0.077 | 0.077 | ||
| Cheamacrista rotundifolia | 3 | 0.010 | -0.046 | 0.046 | ||
| Desmodium scorpiurus | 1 | 0.003 | -0.019 | 0.019 | ||
| Detarium microcarpum | 2 | 0.007 | -0.033 | 0.033 | ||
| Dichrostachys cinerea | 2 | 0.007 | -0.033 | 0.033 | ||
| Indigofere artecta | 1 | 0.003 | -0.019 | 0.019 | ||
| Mimosa pigra | 1 | 0.003 | -0.019 | 0.019 | ||
| Mucuna prurient | 1 | 0.003 | -0.019 | 0.019 | ||
| Phyllanthus niruri | 1 | 0.003 | -0.019 | 0.019 | ||
| Piliostigma thonningii | 1 | 0.003 | -0.019 | 0.019 | ||
| Senna sinquteana | 9 | 0.030 | -0.104 | 0.104 | ||
| Senna occidentalis | 1 | 0.003 | -0.019 | 0.019 | ||
| Tamarindus indica | 1 | 0.003 | -0.019 | 0.019 | ||
| 8 | Flacourtiaceae | Onchoba spinosa | 2 | 0.007 | -0.033 | 0.033 |
| 9 | Lamiaceae | Laucasmartinitcenis | 1 | 0.003 | -0.019 | 0.019 |
| 10 | Malvaceae | Urena lobata | 2 | 0.007 | -0.033 | 0.033 |
| 11 | Meliaceae | Azadiractha indica | 114 | 0.375 | -0.368 | 0.368 |
| 12 | Molluginaceae | Mollugo nudicatilis | 1 | 0.003 | -0.019 | 0.019 |
| 13 | Onagraceae | Jussiea ervicotsa | 7 | 0.023 | -0.087 | 0.087 |
| 14 | Palmea | Hyphaene thebatica | 50 | 0.164 | -0.297 | 0.297 |
| 15 | Phyllanthaceae | Pennisetum recticulatum | 1 | 0.003 | -0.019 | 0.019 |
| 16 | Poaceae | Banbusa vulgaris | 10 | 0.033 | -0.112 | 0.112 |
| Pennisetum recticulatum | 2 | 0.007 | -0.033 | 0.033 | ||
| 17 | Rhamnaceae | Ziziphus abbyssinica | 1 | 0.003 | -0.019 | 0.019 |
| 18 | Rubiaceae | Feretia apodenthera | 2 | 0.007 | -0.033 | 0.033 |
| Mitragyna inermis | 2 | 0.007 | -0.033 | 0.033 | ||
| 19 | Scrophulariaceae | Striga hermonthica | 3 | 0.010 | -0.046 | 0.046 |
| 20 | Suphorbiaceae | Chrozophora | 30 | 0.099 | -0.229 | 0.229 |
| Total | 304 |
Table text extracted from the original PDF; superscript letters are shown inline. The original table image is below.
View original table image
Similarity index and variation of floral species
Using the Sorenson's coefficient formula, the similarity index of Baturiya wetland game reserve calculated was 1.074. Since the result is greater than 1 this shows that there is overlapping of species among sampled plots.
The Analysis of Variance (ANOVA) result conducted shows that there is no significant relationship among the sampled plots (P>0.05) (Table 4).
| Source of variation | SS | Df | MS | Fcal | P-val | Fcrit | Remark |
|---|---|---|---|---|---|---|---|
| Plots | 44.85337 | 2 | 22.42668 | 0.43878 | 0.645804 | 3.0681 | N.S |
| Error | 6440.043 | 126 | 51.11145 | ||||
| Total | 6484.896 | 128 |
Table text extracted from the original PDF; superscript letters are shown inline. The original table image is below.
View original table image
Conclusion
The checklist of Baturiya wetland game reserve showed a high biodiversity presence. The wetland game reserve is highly significant to the livelihood of the people living in the surrounding communities as it performs a lot of ecological and economic functions. However, it was observed that the wetland is currently been threatened by some anthropogenic factors such as logging, over grazing, dredging, fuel wood collection etc hence the need to conserve the wetland game reserve and use of its resources sustainably. This will ensure that the source of livelihood of the communities continue to exist for future generations.
References
15 in the original paper- Anonymous. Water management of wetlands. Earth and environmental science Geo journal. 2006;61(2):151154.
- Eaton D, Sarah TM. The Economic importance of wild resources in the Hadejia-Nguru wetlands: Collaboration Research in the Economics of Environment and Development (CREED). London International Institute for Environment and Development. 1997;13:10-19.
- Hadejia Nguru Wetland Conservation Project (HNWCP). Problem associated with wetlands in Jigawa State. Jigawa State Ministry of Environment 1999. http://www.nef.org
- Iroko OA, Kareem AA, Adio AF, Gbadebo JO. Impact of human activities on forest and their effects on climate change. In: Popoola, L. (ed.). Proceedings of the 32 nd Annual conference of the Forestry Associated of Nigeria (FAN) held at Umuahia, Abia State. 2008. p. 208-214.
- International Union for Conservation of Nature (IUCN). World Conservation Strategies for Conservation of Natural Resources Management and Environmental Resources. Action plan final report. 1980. http://www.iurn.org
- Kwaga BT, Akasim C, Shitta EA, Buba U. Influence of hive types on the yield of honey in Mayobutale Game Reserve, Toungo Local Government Area, Adamawa State, Nigeria. 2016;3(2):62-73.
- Kabir MA. Report on Hadejia Nguru Wetland. A Project submitted to the Department of Biological Sciences. Bayero University, Kano. 2006 p. 42.
- National Conservation Foundation (NCF). National Conservation Foundation Project, 2010. http//www.ncf.org
- Olubode OS, Awodoyin RO, Ogunyemi. Floral Diversity in the Wetlands of Apete River, Eleyele Lake and Oba Dam in Ibadan, Nigeria: Its Implication for Biodiversity Erosion. West African journal of Applied Ecology. 2011;18:109-119.
- Ramsar Convention Bureau. Report to Secretary General conserning list of Wetlands of International Importance. Gland, Switzerland, 2008.
- Ramsar Bureau. The Ramsar Convention on Wetlands. Convention on Wetlands of International Importance especially as waterfall Habitat. Ramsar Convention Bureau, Gland, Switzerland, 1994.
- Shannon CD, Weiner W. The Mathematical Theory of Communication; In: Imam TS (2012) Application of Biological diversity indexing in the water quality monitoring and pollution assessment. A Review. Biology and Environmental Science Journal for the Tropics. 1949;9(2):252-257.
- Udo EJ, Ibia OT, Ogunwale AJ, Ano OA, Esu EI. Manual of soil, plant and water analysis. Sibon books fourth Avenue Festac Lagos. 2000, 65-73.
- Winter D. Forest Management Evaluation and Coordination. Wetland Conservation and Environmental Research Center. 2013. http://www.erc.davis/edu/new/currentnewsletter
- Zhigilla DA, Abdul SD, Sawa FB. Plants species diversity, abundance and distribution in communities of Zamfara State, Nigeria: Implications for conservation. 2016. p. 6.
Cited by 1
From OpenAlex, OpenCitations and reference lists read by Scinovex
- Plant species diversity and composition in Kanyabaha wetland in Rukiga District, Uganda ↗
Paul Walakira, Cecilia Gichuki, John Njagi Muriuki, Ezekiel Ndunda, Peter B. Olanya, P. M. B. Kasoma · Watershed Ecology and the Environment · 2025
• The Kanabaha wetland plant inventory identified a total of 15 species distributed across 10 families. • Human activities, such as agriculture and settlement, have led to a decline in species diversity and increased homogenization. • Eucalyptus sp. emerged as the most dominant species in the study area, occurring in over 40% of the sampled plots. • The Jaccard Similarity…
❝ 2PDF