
Research article · 2018 · Full text
International Journal of Advanced Biochemistry ResearchTime-dependent alterations of nucleic acids, intracellular proteins and electrolytes in tissues of post-mortem rats
Volume 2(1) · Pages 41–53 · DOI: 10.33545/26174693.2018.v2.i1a.120 ↗
Research areasForensic Entomology and Diptera Studies
Abstract
Author-writtenThe study is to determine post-mortem changes in nucleic acids in brain and liver, electrolytes and protein levels in brain and kidney, and to evaluate its relation with post-mortem interval (PMI). Twenty-five male Wistar rats (122.2 ± 8.29g) were sacrificed by cervical dislocation, five rats used for immediate dissection (PMI=0); the remaining 20 rats were kept in their cages under the same environmental conditions in other to allow natural decomposition. Four more groups of five rats each were taken and dissected PMI of 15, 18, 24 and 48 hours. The intracellular levels of DNA and RNA in brain and liver were determined by UV spectrophotometry. The sodium (Na), potassium (K), calcium (Ca), phosphate (PO42-), and iron (Fe) concentration, were determined. Brain nucleic acids and proteins showed significant changes at p
Summary
Source-checkedPlain-language reading of the full paper, prepared with AI and checked against the text. Each point links to the authors' own words.
Why it matters
- Death causes a cessation of blood flow, which leads to toxin accumulation, pH changes, and the disruption of cellular homeostasis. View evidence ↗
- Determining the post-mortem interval (PMI) is critical in forensic medicine for investigating homicide victims. View evidence ↗
- Cellular pH levels influence the activity of proteases, which in turn affects how proteins degrade after death. View evidence ↗
The question
- The study aims to determine how nucleic acids, electrolytes, and protein levels in the brain, liver, and kidney change over the post-mortem interval (PMI). View evidence ↗
What they did
- Tissues were harvested from groups of five rats at post-mortem intervals of 15, 18, 24, and 48 hours. View evidence ↗
- The study measured intracellular DNA and RNA using UV spectrophotometry, along with concentrations of sodium, potassium, calcium, phosphate, and iron. View evidence ↗
What they found
- Both DNA and RNA decreased significantly in the brain, but in the liver, only DNA showed a significant decrease. View evidence ↗
- Sodium concentrations in the brain and kidney did not show statistically significant changes over the study period. View evidence ↗
- Potassium levels in the kidney decreased significantly over 48 hours, showing a very high negative correlation (r = -0.9) with the post-mortem interval. View evidence ↗
- Protein concentrations in the kidney decreased significantly as the post-mortem interval increased. View evidence ↗
- In the brain, phosphate concentrations decreased significantly from 0 to 15 hours, then increased up to the 48th hour. View evidence ↗
- The researchers derived a mathematical formula to estimate PMI based on kidney potassium concentration: PMI = -109.409 * [K+] + 161.05. View evidence ↗
What it means
- The authors conclude that brain electrolytes, DNA, RNA, kidney electrolytes, proteins, and liver DNA are potentially useful markers for determining the post-mortem interval. View evidence ↗
- The authors recommend immediate processing or preservation of animal tissues after slaughter to prevent the rapid degradation of nutrients. View evidence ↗
- The authors state that further research is needed to validate these findings using human samples. View evidence ↗
Visual summary
2 visualsIllustrations explain the paper; charts are replotted from the paper's own table values.
Potassium-PMI Relationship
AI-generated conceptual illustration (rat kidney tissue). It explains the idea and does not show study data.
View source evidence ↗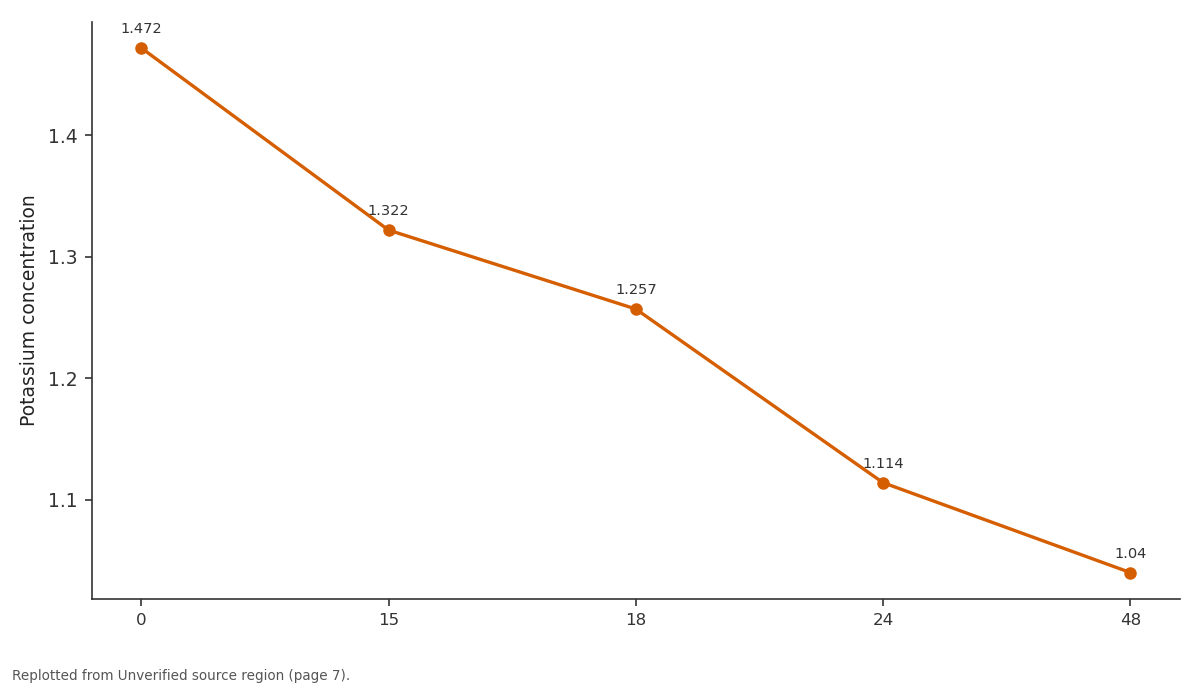
y: 0 vs 15 vs 18 vs 24 vs 48
Replotted from a table (page 7) of the original paper. Every bar is the paper's own table value.
View source evidence ↗Figures & tables
From the original paper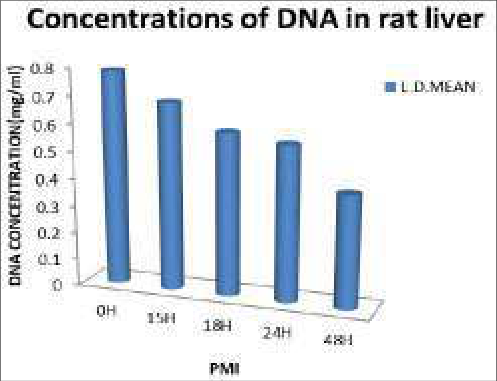 Figure 1
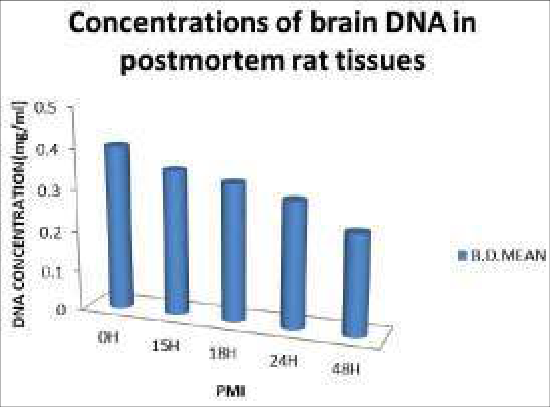 Figure 2
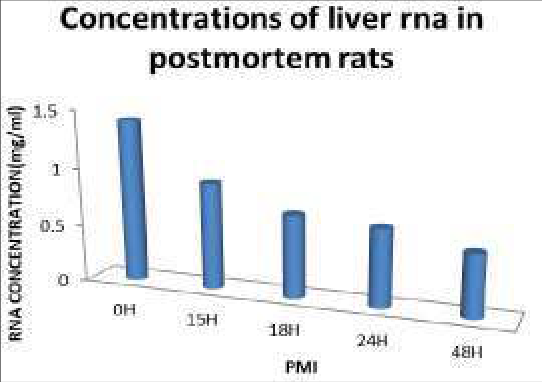 Figure 3
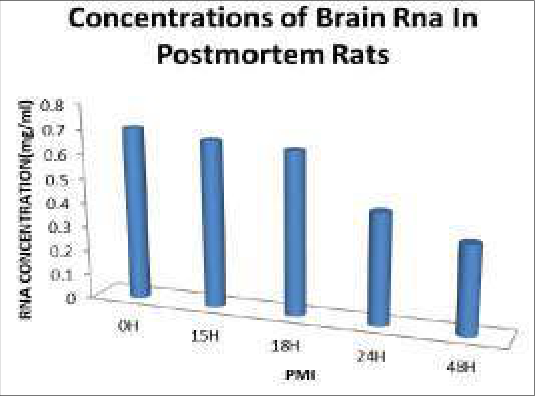 Figure 4
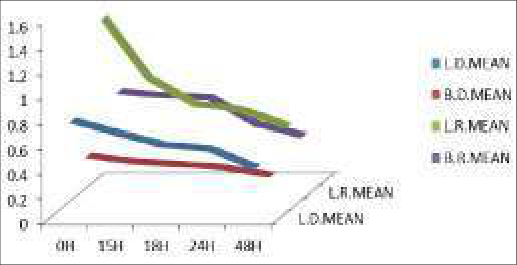 Figure 5
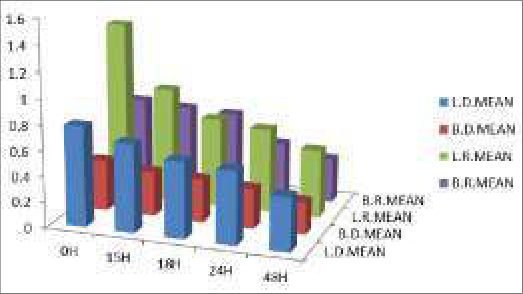 Figure 6
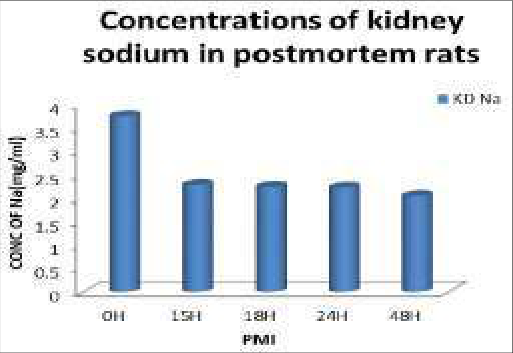 Figure 7
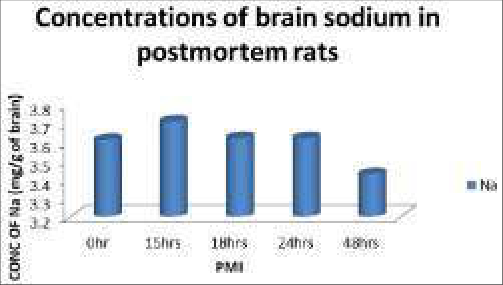 Figure 8
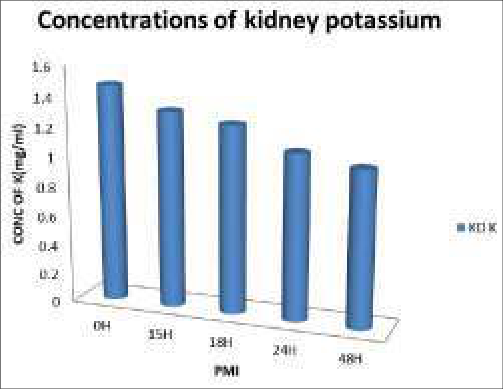 Figure 9
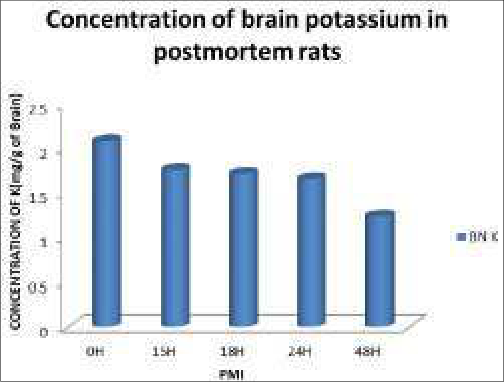 Figure 10
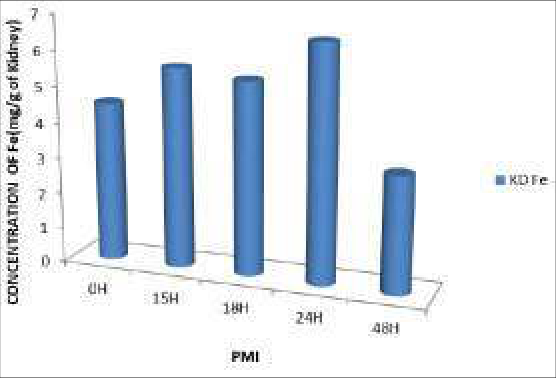 Figure 11
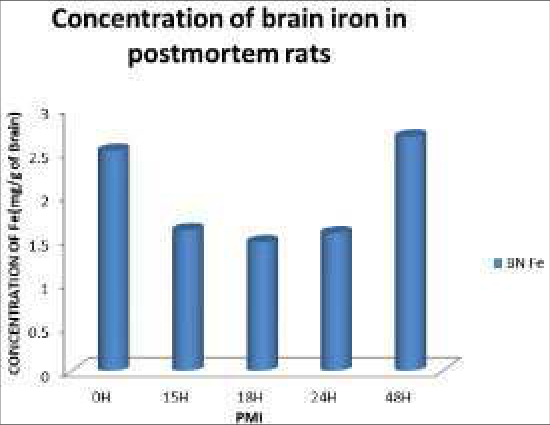 Figure 12
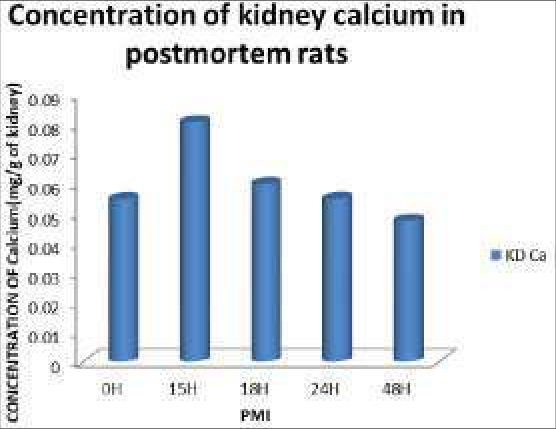 Figure 13
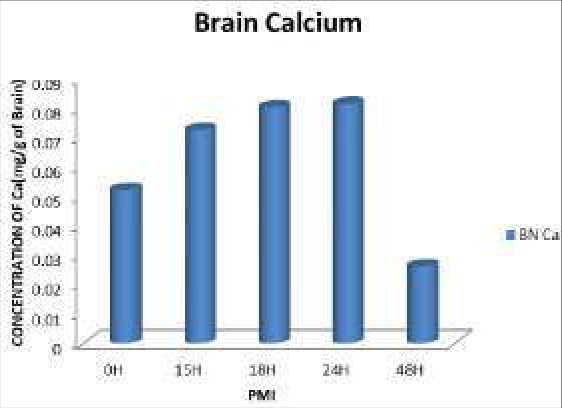 Figure 14
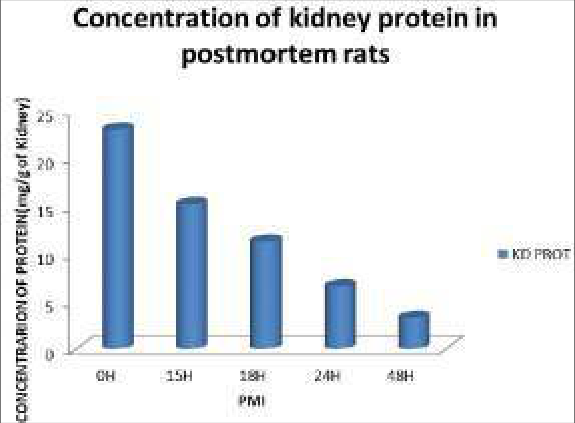 Figure 15
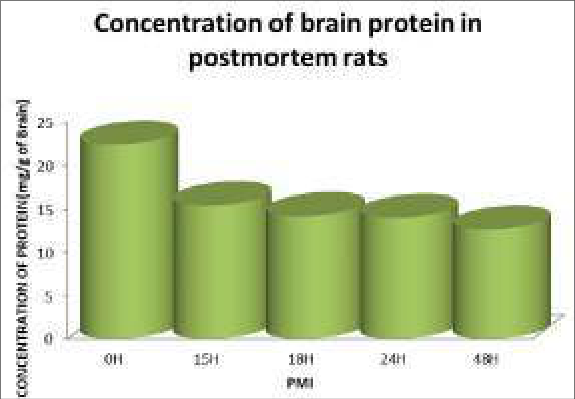 Figure 16
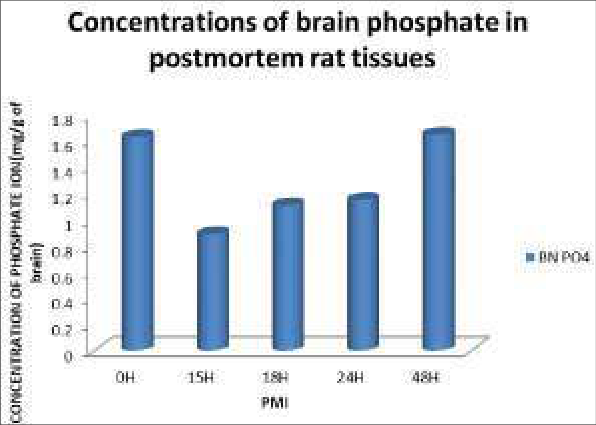 Figure 17
Introduction
Animal tissues are some of the most prominent sources of high quality proteins in diets. Unfortunately however, from the moment an animal is slaughtered for dietary purpose, the race against deterioration begins. Evidences from biochemical investigations have shown that numerous changes commence in all tissues at the onset of death. Fundamentally, the cessation of the flow of blood to tissues leads to the accumulation of toxins, ischemia or anoxia, alteration of pH, membrane damage with diffusion, disruption of homeostasis, and eventually cessation of cellular biosynthetic activity. More specifically, anoxia leads to accumulation of lactic acid, which in turn decreases the tissue pH with increasing postmortem interval. The cellular pH is important in determining the level of activity of specific subsets of proteases and consequently the level of protein degradation. The integrity of the plasma membrane has also been shown to be compromised after death, thus allowing the diffusion of ions in and out of the cell (Blair et al., 2016, Despina et al., 2003) [4,17] . All these alter the quality and preservation of meat. With this press for "high quality" tissue comes the need to determine the critical markers of quality for human post-mortem tissue (Deep-Soboslay et al., 2005; Hargrove and Schmidt, 1989) [66,67] . Several laboratories have approached the evaluation of human postmortem brain cases with suggestions for markers of tissue quality (Lee et al., 2005; Preece and Cairns, 2003; Tomita et al., 2004) [68,69,60] . Several of these newer measures of tissue quality have been taken and tested in human postmortem tissue in a variety of situations to detect the relationship of the markers to the real quality of the postmortem tissue. Traditionally, a low postmortem interval (Barton et al., 1993; Ferrer-Alcon et al., 2003; Harrison et al., 1995; Lewis, 2002; Trotter et al., 2002) [6] has been the hallmark of high tissue quality. More recently tissue pH (Hynd et al., 2003; Kingsbury et al., 1995; Li et al., 2004) [72,73] has been used, and even more recently, specific markers of RNA quality have been introduced (Imbeaud et [74] .
In a cohort of human post-mortem cases, we have determined these standard tissue quality measures have been determined, checked their collection correlates, and tested them for an association with RNA quality and with quantification of representative proteins. Attempts have been made to identify which ones are the most sensitive and reliable markers of tissue quality in human post-mortem cases. Increasingly, human post-mortem brain tissue is being used to quantify cellular and molecular markers of neural processes in the pursuit of understanding normal brain function and correlates of dysfunction in CNS illnesses (Casanova and Kleinman, 1990; Castensson et al., 2000; Harrison et al., 1994; Mirnics et al., 2001; Ravid et al., 1992; Torrey et al., 2000) [10] . Because of the inaccessibility of the human brain and its unavailability for biopsy, fresh tissue is rarely obtainable. Consequently, the translation of new findings from basic laboratory studies to human brain diseases relies heavily on the use of post-mortem tissue. Although studies using human tissue have been done for decades (Johnson et al., 1986; Wester et al., 1985), the sensitivity and specificity required for today's molecular measures are greater, therefore calling for better tissue characteristics. This requires not only collecting better tissue than before, but also identifying measures of tissue quality and setting quality thresholds. Apart from post-mortem studies of diseases, tissue quality and shelf-life, determination of post-mortem interval (PMI) upon discovery of a possible homicide victim is still a subject of major interest in forensicmedicine. This is important in the vindication or indictment of a homicide suspect. Since majority of the victims are found within the first two days, it is therefore important to research and develop methods of determining time of death quickly and accurately. In this light, this work has been designed into a two (2) hour post-mortem interval study of the brain, kidney, tongue, and liver. Currently, various methods of determining PMI have been developed but none of these provide better than an 8hour window time estimate (Johnson and Ferris, 2002) [33] . The time of death of an individual can easily be determined if the post-mortem interval can be assessed. Although livor mortis, and to a lesser degree, algor mortis have been used to estimate the post-mortem interval. These methods are hinged on the fact that biomolecules continually degrade after death. Upon death, all tissues lose the ability carry out homeostasis. The results of this loss are the obvious changes usually observed in cadavers, minutes after death. At this point, degradation of molecules sets in and fast. Nucleic acids start fragmenting (Mona, et al., 2009) [42] , proteins denature and enzymes gradually lose their activity, apoptosis sets in. This study therefore reports the in situ alterations of DNA and RNA in post-mortem rat brains and livers and in situ alterations of proteins, potassium, sodium, phosphates, iron and calcium in postmortem rat brains and kidneys.
Materials and Methods
Materials and Methods
Rats collection and acclimatization
Twenty-five (25) male albino rats of the Wistar rats were purchased and acclimatized for 30 days at the animal house of the National Institute for Medical Research (NIMR), Iyaba, Lagos, Nigeria. The long period of acclimatization was to bring all the rats to the same level of physiological state i.e. a disease-free, physically fit and active state.
Average weight of rats at the end of acclimatization was 122.2g
Method of inducing death
The rats were sacrificed by cervical dislocation.
Collection of organs and preparation of samples
The rats were all sacrifice by the method stated above at a noted time. Five (5) of these rats were separated and their organs (brain, kidney and liver) were immediately removed. This was taken as zero hour. The remaining dead rats were kept in their cages to undergo natural degradation. At 15hours after death, another five (5) rats were taken and their organs harvested. This procedure continued for 18hrs, 24hrs and 48hrs. The organs were immediately kept in their appropriate buffer and under ice. This was done in other to halt any further post-mortem changes. The temperature range of the environment for the study was 26 0 C to 32 0 C Sample Preparation for the Estimation of Electrolytes (Na + , K + , Ca 2+ , PO4 3-, Fe 2+. ) Cytoplasm Extraction 0.5g of brain and 1.0g of kidney were cut out weighed. The organs were rubbed on filter paper to remove red blood cells. They were allowed to drain in order to remove much of the extracellular fluid and washed in double distilleddeionized water twice. Then, they were kept in 2ml 0.25% sucrose solution in plain bottles and refrigerated at -20 0 C for 5minutes. The organs were homogenized and centrifuged at 14,000rpm15 minutes (to pellet nuclei and other cytoplasmic structures) in a total volume of 5ml sucrose solution. The supernatant (intracellular fluid) was transferred to fresh plain tubes and stored at -20 0 C.
Calcium Estimation
Using an autoanalyzer (HTACHI COBAS C 502), Calcium ion concentration was assyed in the tissues based on the reaction of calcium with 5-nitro-5'-methyl-BAPTA (NM-BAPTA) under alkaline conditions to form a complex. This complex reacts in the second step with EDTA.
The change in absorbance is directly proportional to the calcium concentration and is measured photo metrically.
Na+, K + , Estimation
An auto-analyzer (HTACHI COBAS C 502) was used to assay for the concentrations of Na and K. This was based on the principle of An Ion-Selective electrode (ISE) which makes use of the unique properties of certain membrane materials to develop an electrical potential (electromotive force, EMF) for the measurements of ions in solution. The electrode has a selective membrane in contact with both the test solution and an internal filling solution. The internal filling solution contains the test ion at a fixed concentration. Because of the particular nature of the membrane, the test ions will closely associate with the membrane on each side. The membrane EMF is determined by the difference in concentration of the test ion in the test solution and the internal filling solution. The EMF develops according to the Nernst equation for a specific ion in solution.
Where E = electrode EMF E 0 = standard EMF T = temperature R = constant n = charge of the ion F = Faraday's constant In = natural logarithm (base e) f = activity coefficient Ct = ion concentration in test solution Ci = ion concentration in internal filling solution Sodium, potassium and chloride, which all carry a single charge, R, T, n, and F are combined into a single value representing the slope (S). For determination on a cobas c 501 analyzer where the sample is diluted 1:31, the ionic strength and therefore the activity coefficients are essentially constant. The concentration of the test ion in the internal filling solution is also constant. These constants may be combined into the E 0 term. The value of E 0 is also specific for the type of reference electrode used. Equation (1) can hence be rewritten to reflect these conditions:
The complete measurement system for a particular ion includes the ISE, a reference electrode and electronic circuits to measure and process the EMF to give the test ion concentration.
The sodium and potassium electrodes are based on neutral carries and the chloride 5 electrode is based on an ion exchange.
Inorganic Phosphate Estimation
Molybdate UV Inorganic phosphate concentrations assay involved the formation of an ammonium phosphomolybdate complex having the formular (NH 4 ) 3 {PO 4 (MoO 3 ) 12 } from the reaction of inorganic phosphate with ammonium molybdate in the presence of sulfuric acid.
The concentration of phosphomolybdate formed is directly proportional to the inorganic phosphate concentration and is measured photo metrically.
Estimation of Total Protein
Total Protein was assayed using an auto-analyzer HITACHI/COBAS C501 based on the reaction of divalent copper ions in alkaline solution with protein peptide bonds to form the characteristic purple-coloured biuret complex. Sodium potassium tartrate was added to prevent the precipitation of copper hydroxide and potassium iodide prevents auto-reduction of cooper.
The colour intensity is directly proportional to the concentration of proteins which can be determined photometric ally.
Quantitation of nucleic acids DNA extraction: Nucleic acids extraction was done according to (salting out extraction method) of Aljanabi and
Martinez, (1997) [2] and modification introduced by Hassab El-Naby, (2004) [26] . Where, a piece of 10mg of liver and brain, tissues was squeezed by blue tips and lysed with 600 microlitre lysing buffer (50 mM NaCl,1 mM Na2 EDTA,0.5% SDS, pH 8.3) and gently shaken. The mixture was incubated overnight at 37ºC then, 200 microlitre of saturated NaCl was added to the samples, shaked gently and centrifuged at 12,000 rpm for 10 min. The supernatant fluid was transferred to new eppendorf tubes and then DNA was precipitated by 600 microlitre cold isopropanol. The mix was inverted several times till fine fibers appear, and then centrifuged for 5min. at 12000 rpm. The supernatant fluid was removed and the pellets were washed with 500 microlitre 70%ethyl alcohol, centrifuged at 12000 rpm for 5min. After centrifugation, the alcohol was decanted or tipped out and the tubes blotted on Whatman filter paper, till the pellets appeared to be dry. The pellets were resuspended in 50 microliter or appropriate volume of TE buffer (10 mM tris, 1mM EDTA, and pH8)
DNA Estimation
DNA was quantified by ultraviolet absorption method. Nucleic acid, nucleotide and their derivatives have the system of conjugated double bond, so the maximal ultraviolet absorption of RNA and DNA is at 260nm. Popularly at 260nm, the absorbance of 1μg/ml of RNA solution is 0.022~0.024, and that of DNA solution is 0.020. So we can nucleic acid concentration was determined by measuring the absorbance of DNA and RNA at 260nm. When RNA is heated with concentrated hydrochloric acid, it will degrade to ribose, which will transfer to furfuraldehyde later. Catalyzed by FeC1 3 or CuCl 2 , furfuraldehyde will react with orcinol to give green complex whose maximal absorbance is 670nm. The relationship between absorbance and concentration of RNA is a straight line in range of 20-250μg/ml of RNA concentration. Using serial concentrations of RNA, a standard curve was obtained. The absorbance values for each sample obtained from the tissues samples were extrapolated on the RNA standard curve.
Materials
Materials
Statistical Analysis
These data were run on an IBM compatible personal computer by using Statistical Package for Social Scientists (SPPS) for windows 11 (SPSS Inc., Chicago, IL, USA). Data were compared by using two types of statistics; Descriptive statistics: e.g., mean (x) and standard deviation (SD) and analytical statistics: e.g., student's t-test (to compare two groups) was used to test association between variables. P value of <0.05 was considered statistically significant.
Results
DNA and RNA concentrations at different PMI's are presented in figures 1-4. DNA and RNA concentrations showed significant decrease (p<0.05) in brain but liver tissues showed significant decrease in DNA concentrations only while changes in RNA concentrations were not significant at (p<0.05). Figures1-4). However, Figure 3 showed that there was a significant decrease in the liver RNA concentrations in the first 15hours but this became insignificant from 15 to 48 hours. DNA and RNA showed high decrease in concentrations in the first 15hours in both brain and liver Sodium concentrations in Kidney and Brain and did not show significant change at (p<0.05). Although there was an abrupt fall in the concentration of Na ions in the first 15 hours, this change did not continue after that time. (Figures7 and 8)
The values for kidney and brain potassium ion concentrations against PMI are presented in figures 8 and 9 respectively. Kidney and brain Potassium concentrations revealed that there were significant changes. Both organs showed significant decrease ((p<0.05). Meanwhile potassium ions concentrations showed the highest correlation values (r= -0.996) with PMI as revealed in Table1 (i.e. correlations tables) Figures11 and 12 show the results for iron concentrations in kidney and brain respectively. Kidney iron concentrations showed no consistent change of any significance (at p<0.05). Brain Fe concentrations showed significant decrease from PMI of 0-18hours. While iron levels in the kidney increased slightly in the first 15 hours but thereafter became inconsistent in its change.
Figure 13 shows the values for calcium ion concentrations in the kidney. Results for calcium in kidney showed no significant change in concentration for the 48hours of study. But the first 15hours (PMI) showed a slight increase in the concentration of calcium. Figure 14 however, showed a significant increase in the intracellular concentrations of calcium for up to 24 hours PMI Figure15 presents the concentrations of proteins at different PMI's. The results obtained from kidney assays of protein concentrations revealed a significant decrease as PMI increased (p<0.05). Figure 16 presents the concentrations of proteins in the brain for the 48hours of study. There was significant decrease in the protein concentration (p<0.05). The most marked change in protein concentration occurred during PMI 0-18hours. The rate of decrease continued but gradually slowed down as PMI approached 48 hours.
Figure 17 shows the various concentrations of phosphate ions in the brain throughout the 48 hours of post-mortem study. The result shows that there is a significant decrease (p<0.05). in the phosphate concentration from 0-15 hours. There-after, the concentration started to increase up till the 48 th hour. But there was no significant change in kidney phosphate concentration (at p<0.05) (Table1). However in brain tissues, phosphate concentration showed significant decrease in the first 15hours (at p<0.05). . Statistical analysis also proved that there was no significant increase in the concentration of Fe in kidney at (p<0.05). This figure shows the changes that occurred in Fe concentration of the 48hours study. Fe showed a significant decrease in the concentration 24hours (p<0.05). However in the last 24hours, the change in concentration was inconsistent. Calcium concentrations did not show any significant change at p<0.05. but there was an increase in its concentration in at PMI 15hours There was a significant decrease (p<0.05) in the concentrations of phosphate in the brains of the rats in the first 15hours and then the concentrations increase till the 48 th hour.
Results
Results
Results for Nucleic acids concentrations in postmortem rat tissues illustrated in bar charts
Results for Nucleic acids concentrations in postmortem rat tissues illustrated in bar charts
Results for Electrolytes and Proteins in the tissues of postmortem rats
Results for Electrolytes and Proteins in the tissues of postmortem rats
Discussion
In this study, the changes and redistribution of eight ( 8) parameters were evaluated alongside post-mortem interval.
The parameters are DNA, RNA, proteins, potassium, sodium, calcium, iron and phosphate ions.
Results obtained from this study using simple quantification of DNA and RNA at varying PMI showed that there is a general decrease in the concentrations of nucleic acids both in the liver and brain of the experimental rats. This is in consonance with findings from (Gilbert et al., 2003) which showed that DNA decays after death, in biological samples, and the ensuring damage is manifested in many forms.
There was also a good linear relationship between the nucleic acids and PMI for up to 18 hours. Some previous studies showed that DNA degradation can be linear with high correlation with PMI in brain tissues of drowned rats for up to 24hours. (Mona et al., 2009) [42] . This relationship between DNA and PMI can be explored for the determination of post-mortem interval. Figure 1 showed a rapid decrease in the liver DNA concentration in the first 18hours after death at the rate of 0.01079mg/ml/hour. This then slowed down to 0.006013mg/ml/hour in the next 30hours. These changes were statistically significant at p<0.001(see table11).
According to earlier reports, during post-mortem autolysis, cellular organelles and nuclear DNA break down into their constituent parts (Boy et al., 2003) [5] . This degradation occurs as a result of the activities of deoxyribonucleases. (Leonard et al., 1993) [35] Similarly, brain DNA degraded rapidly in the first 18hours and then the rate of degradation slowed down in the following 30 hours. This is shown in figure 2. The intracellular fluids of brain and liver cells contain numerous globular proteins some of which are enzymes of degradation. These are released after death in cells due to apoptotic processes. DNA in the liver showed faster degradation than DNA in the brain. This also is in accordance with the findings of earlier researchers who found that brain DNA degraded slower than the rate in other organs (Leonard et al., 1993) [35] . This high rate of degradation in the liver may be attributed to the presence of many enzymes and up-regulation of proteolysis-related genes (Sanodou et al., 2004) [58] . Gel electrophoretic studies revealed that there is continuous fragmentation DNA up 24 hours post-mortem in the liver (Lin et al., 2000) [37] Figure 7 is a bar chart that shows the relationship between sodium ions in the cytosol of rat kidney and post-mortem interval. There was no significant change for 48hours at pvalue < 0.05. In figure 8, potassium concentration was shown to decrease in accordance with increase in PMI (significance at p < 0.019 see table3 for details). This decrease showed a near-perfect-linear relationship with correlation of -0.996 (See table 1) since the correlation was high for potassium-PMI, an attempt was thus made to derive a mathematical relationship for post-mortem interval using the potassium-PMI values from figure 8, using the regression formula:
A regression coefficient b= -0.00914(hrs/mg/g of kidney). This was used to obtain relationship below: PMI =-109.409 x [K + ] concentration in mg/g of kidney + 161.05
The changes observed in the concentration of kidney iron shown in Figure 9 were not statistically significant. Meanwhile there was a significant increase in cytosolic calcium ions in the first 15hours Results obtained from this study (Figures 11 and14) showed that protein concentrations in the kidney significantly decreased with increase in PMI. Proteins degraded very fast in the first 15hours after death. Also the changes observed in the concentration of protein brain were statistically significant (p<0.025).
There was a significant decrease in the concentrations of potassium ions in the brain in the full 48hours period of the study while results for calcium revealed a significant increase in concentration in the first 18hours. This is supported by a previous study by (Gemma et al., 1980) [21] which revealed that the cellular concentrations of Na, Ca and Cl increased marked, those of Mg and K decreased; no significant changes were found in the concentrations P and S and calcium increased both in the mitochondria and in the cytoplasm and endoplasmic reticulum. From results in this study Fe ions showed significant decrease in their concentrations for the first 18hours (p<0.045) while changes observed in sodium ions concentration were insignificant. (Figures 13, 14, 15 and 16) Brain potassium concentrations were observed to decrease significantly (p<0.001) as PMI increased. This is shown on Table2 and in Figure 12. According to a study by researchers, the integrity of the plasma membrane has been shown to be compromised after death, thus allowing the diffusion of ions in and out of the cell leading to an alteration of the concentration of ions in the intracellular environment (Despina et al., 2003) [17] . This is probably the mechanism involved the change in concentrations of ions in post-mortem tissues
Conclusion
The data of the study suggest that levels brain intracellular electrolytes, DNA and RNA, Kidney electrolytes and proteins and liver DNA may be useful for determining PMI.
The most significant degradation of nucleic acids in the organs occurred in the first 15 hours post-mortem suggesting that there is a high proteolytic activity at about this window time. This leads to rapid loss of bio-molecules and loss of quality dietary animal tissues. It will be more convenient to develop a working relationship for postmortem interval using tissues that are hardly ever missing in cadavers. For example, Sturner's PMI and Medea and Hensage's PMI are based on the concentration of potassium ion in the vitreous humour but these formulae may not be useful in cases of ritual killings were the victims' eyes have been excised. Therefore it is advised that more attention should be given to other organs. Meanwhile, the results of this study, a relationship for postmortem interval in rats is being proposed: PMI =-109.409 x [K + ] concentration in mg/g of kidney + 161.05
Recommendations
Since the highest degradation of DNA, RNA and intracellular proteins occurred during the early post-mortem hours, it would be logical therefore, if more attention is given to animal tissues obtained at abattoirs for dietary purpose. Processing or preservation should be done immediately after the death of the animal in order to forestall the usual rapid degradation nutrients. Further research may be carried out on the levels of DNA, RNA, intracellular Fe, Ca, globular proteins, PO4 and K in different organs with increase in PMI using human samples. In addition, degradation of nucleic acids in different climatic conditions may also be carried out. Various manner of deaths may also be studied in relation to alterations of biomolecules and ions. Lastly, the submission made by this study for post-mortem interval i.e. PMI =-109.409 x [K + ] concentration in mg/g of kidney + 161.05 may be a guide into the development of a better formula for finding longer PMI than the already existing ones. Changes in potassium ion in organs may just be the key.
It is also recommended that, a more detailed study on the levels of Fe, Ca, PO 4 and K in rat brain, liver and kidney tissues including a larger number of rats should be planned in further researches. Also, the relationship between calcium and phosphate may be explored in the future because the high correlation values (table1). Other methods of inducing death may be tried and degradation under environmental conditions (such as temperate conditions, tundra climate etc.) that are different from the one mentioned in this study may be studied using human samples. It can be recommended that animals slaughtered for food should be preserved immediately by freezing or prepared as meals instantly. This will help to retain the most of the nutrients
Figures and tables from the paper
References
64 in the original paper- Alejandro VS, Strafuss AC. Avian Dis. Microscopic Post-mortem Changes in Kidneys of the Domestic Fowl. US National Library of Medicine National Institutes of Health pub med. 1984 Jul-Sep;28(3):586607.
- Aljanabi SM, Martinez L. Universal and rapid salt extraction of high quality genomic DNA for PCR-based techniques. Nucl. Acids Res. 1997;25:4692-4693.
- Blair JA, Wang C, Lee H. Individual case analysis of postmortem interval time on brain tissue preservation. PLoS One. 2016;11(3):e0157209.
- Boy SC, Bernitz H, Van Heerden WF. Flow cytometric evaluation of postmortem pulp DNA degradation. Am J Forensic Med Pathol. 2003;24(2):123-127.
- Barton AJ. Pre-and postmortem influences on brain RNA. J Neurochem. [PubMed]. 1993;61:1-11.
- Berg J, Tymoczko J, Stryer L. Biochemistry. W. H. Freeman and Company ISBN 0-7167-4955-6, 2002.
- Tibbett Mark. Blood, guts, gore and soil: decomposition processes in graves and forensic taphonomic applications. 19th World Congress of Soil Science, Soil Solutions for a Changing World, 2010.
- Brian Gallagher, Burton EC, McDonald KM, Goldman L. Changes in rates of autopsy-detected diagnostic errors over time: a systematic review. JAMA. 2003;289 (21):2849-56. Doi:10.1001/jama.289.21.2849. PMID 12783916.
- Casanova MF, Kleinman JE. The neuropathology of schizophrenia: a critical assessment of research methodologies. Biol Psychiatry. [PubMed]. 1990;27:353-2
- Bautista, Richard. Spring, 2012.
- Centers for Disease Control. Current Trends Autopsy Frequency-United States, 1980-1985, Morbidity and Mortality Weekly Report. 1988;37(12);191-4
- Chargaff E. Chemical specificity of nucleic acids and mechanism of their enzymatic degradation. Experientia. 1950;6:201-209.
- Chen X, Shen YW, Gu YJ. The research of relationship between DNA degradation and postmortem interval. Fa Yi Xue Za Zhi. 2005;21(2):115-117.
- Combes A, Mokhtari M, Couvelard A, et al. Clinical and autopsy diagnoses in the intensive care unit: A prospective study. Arch. Intern. Med. 2004;164(4):38992. DOI:10.1001/archinte.164.4.389. PMID 14980989.
- Dahm R. Discovering DNA: Friedrich Miescher and the early years of nucleic acid research. Human Genetics 2008;122:565-581.
- Despina Sanoudou, Peter B Kang, Judith N Haslett, Mei Han, Louis M Kunkel, Alan H Beggs. Transcriptional profile of postmortem skeletal muscle Physiol. Genomics. First published 18 November 2003, 2004;16:222-228. DOI: 10.1152/physiolgenomics.00137.2003.
- William A. Cox MD. Early Postmortem Changes and Time of Death. Forensic Pathologist/Neuropathologist, 2009 Dec 22.
- Elizabeth C Burton, Kim A Collins. Religions and the Autopsy, E Medicine. Retrieved, 2012-09-12.
- Gemma AJ Kuuypers, Godfried M Roomans. WennerGren Institute, University of Stockolm, Stockolm, Sweden. Post-mortem Elemental Redistribution in Rat Studied by X-ray Microanalysis and Electron Microscopy. Histochemistry. 1980;69:145-156.
- Gilbert MTP, Hansen AJ, Willerslev E, Rudbeck L, Barnes I, Gregory S, et al. The DNA sequence and biological annotation of human chromosome 1. Nature. 2006;441(7091):315-21. Bibcode 2006Natur.441.315G. DOI:10.1038/nature04727. PMID 16710414
- Hao LG, Deng SX, Zhao XC. Recent advancement in relationship between DNA degradation and postmortem interval. Fa Yi Xue Za Zhi. 2007;23(2):145-147.
- Harrison PJ, et al. Terminal coma affects messenger RNA detection in post mortem human temporal cortex. Brain Res Mol Brain Res. 1991;9:161-4.
- Haslett JN, Sanoudou D, Kho AT, Han M, Bennett RR, Kohane IS, et al. Gene expression profiling of Duchenne muscular dystrophy skeletal muscle. Neurogenetics. 2003;4:163-171.
- Hassab El-Naby SE. Molecular and cytogenetic studies on the antimutagenic potential of eugenol in human lymphocytes culture treated with depakine and apetryl drugs. J Egypt. Ger. Soc. Zool., 43C: Histology & Histochemistry, 2004, 171-196.
- Hongpaisan J, Roomans GM. Department of Human Anatomy, University of Uppsala, Sweden. Use of post mortem and in vitro tissue specimens for X-ray microanalysis. J Microsc. 1995 Nov;180(Pt 2):93-105.
- IUPAC-IUB. Abbreviations and Symbols for Nucleic Acids, Polynucleotides and their Constituents Commission on Biochemical Nomenclature (CBN). Retrieved, 2006 Jan 3.
- Johnson LA, Ferris JA. Analysis of postmortem DNA degradation by single-cell gel electrophoresis". Forensic Sci Int. 2002;126(1):43-47.
- Kiljunen S, Hakala K, Pinta E, Huttunen S, Pluta P, Gador A, et al. Yersiniophage phiR1-37 is a tailed bacteriophaet having a 270 kb DNA genome with thymidine replaced by deoxyuridine. Microbiology. 2005;151(12):4093-4102.
- Leonard S, Logel J, Luthman D, Casanova M, Kirch D, Ereedman R. Biological stability of mRNA isolated from human postmortem brain collections. Biol. Psychiatry. 1993;33(6):456-466.
- Levene PA. The structure of yeast nucleic acid. IV. Ammonia hydrolysis. Journal of Biological Chemistry. 1919;40:415-424.
- Lin LQ, Liu L, Deng WN, Zhang L, Liu YL, Liu Y. An experimental study on the relationship between the estimation of early postmortem interval and DNA content of liver cells in rats by image analysis. Fa Yi Xue Za Zhi. 2000;16(2):68-69.
- Liu L, Peng DB, Liu Y, Deng WN, Liu YL, Li JJ. A study on the relationship between postmortem interval and the changes of DNA content in the kidney cellule of rat. Fa Yi Xue Za Zhi. 2001;17(2):65-68.
- Liu L, Shu X, Ren L, Zhou H, Li Y, Liu W, et al. Determination of the early time of death by computerized image analysis of DNA degradation: which is the best quantitative indicator of DNA degradation? J Huazhong Univ Sci Technolog Med Sci. 2007;27(4):362-6.
- Liu ZP, Chen X, She YW. Investigate the relationship between postmortem interval (PMI) and the metabolic law of the amount of DNA in cells of rat. Fa Yi Xue Za Zhi. 2004;20(2):68-69.
- Luo GH, Chen YC, Cheng JD, Wang JF, Gao CL. Relationship between DNA degeneration and postmortem interval of corrupt corpse. Fa Yi Xue Za Zhi. 2006;22(1):7-9.
- Mona A, El-Harouny SA, El-Dakroory SM, Attala NA, Hasah SE, Hassab El-Nabi. The Relationship Between Postmoterm Interval And Dna Deegradation In Different Tissues Ofdrowned Rats. The Internet Journal of Forensic Sciene ISSN. 2009;4(1):1540-2622.
- Muñoz JI, Suárez-Peñaranda JM, Otero XL, RodríguezCalvo MS, Costas E, Miguéns X, et al. A New Perspective in the Estimation of Postmortem Interval (PMI) Based on Vitreous [K + ]. J Forensic Sci. 2001;46(2):209-214.
- Nicklas JA, Buel E. Quantification of DNA in forensic samples. Anal Bioanal Chem. 2003;376(8):1160-1167.
- Papadakis MA, Mangione CM, Lee KK, Kristof M. Treatable abdominal pathologic conditions and unsuspected malignant neoplasms at autopsy in veterans who received mechanical ventilation. JAMA. 1991;265(7):885-7. DOI:10.1001/jama.265.7.885. PMID 1992186.
- Pollock DA, O'Neil JM, Parrish RG, Combs DL, Annest JL. Temporal and geographic trends in the autopsy frequency of blunt and penetrating trauma deaths in the United States. JAMA: the journal of the American Medical Association. 1993;269(12):1525-31. PMID:8445815.
- Pray L. Discovery of DNA structure and function: Watson and Crick. Nature Education, 2008, 1.
- Preface to a grammar of biology. Science. 1971;171:637-642.
- Ravakhah K. Death certificates are not reliable: revivification of the autopsy. South. Med. J. 2006;99(7):72833.
- Razeghi P, Faadiel Essop M, Huss JM, Abbasi S, Manga N, Taegtmeyer H. Hypoxia-induced switches of myosin heavy chain isogene expression in rat heart. Biochem Biophys Res Commun. 2003;303:1024-1027.
- Reneä Lametsch, Peter Roepstorff, Emøke Bendixen. Identification of Protein Degradation During PostMortem Storage of Pig Meat. Department of Animal Product Quality, Danish Institute of Agricultural Sciences, Tjele, Denmark, And Department of Biochemistry And Molecular Biology, University of Southern Denmark, Odense, Denmark. Danish Ministry of Food, Agriculture, and Fisheries, 2002.
- Rich A, Zhang S. Z-DNA: The long road to biological function. Nature Reviews Genetics. 2003;4:566-572.
- Roberts IS, Benamore RE, Benbow EW. Post-mortem imaging as an alternative to autopsy in the diagnosis of adult deaths: a validation study. Lancet. 2012 Jan 14;379(9811):136-42. Epub 2011 Nov 21. PubMed PMID: 22112684
- Rothenberg Kelly. The Autopsy Through History. In Ayn Embar-seddon, Allan D. Pass (eds.). Forensic Science. Salem Press, 2008, 100pp. ISBN 978-1-58765423-7.
- Roulson J, Benbow EW, Hasleton PS. Discrepancies between clinical and autopsy diagnosis and the value of post mortem histology; A meta-analysis and review. Histopathology. 2005;47(6):551-9. DOI:10.1111/j.1365-2559.2005.02243.x. PMID 16324191.
- Sanoudou D, Kang PR, Haslett JN, Han M, Kunkel LM, Beggs AH. Transcriptional profile of postmortem skeletal muscle. Physiol. Genomics. 2004;16:222-228.
- Strasser, Russell S. Autopsies. In Ayn Embar-seddon, Allan D. Pass (eds.). Forensic Science. Salem Press, 2008, 95pp. ISBN 978-1-58765-423-7.
- Tomita H. Effect of agonal and postmortem factors on gene expression profile: quality control in microarray analyses of postmortem human brain. Biol Psychiatry. [PMC free article] [PubMed. 2004;55:346-52. themedicalbiochemistrypage.org, (©1996-2012) LLC | info @ themedicalbiochemistrypage.org
- Watson JD, Crick FHCA. Structure for deoxyribose nucleic acid. Nature. 1953;171:737-738.
- Wolf G, Friedrich Miescher. The man who discovered DNA. Chemical Heritage. 2003;21(10-11):37-41.
- Yakovchuk P, Protozanova E, Frank-Kamenetskii MD. Base-stacking and base-pairing contributions into thermal stability of the DNA double helix. Nucleic Acids Res. 2006;34(2):564-74. Doi:10.1093/nar/gkj454. PMC 1360284. PMID 16449200.
- Deep-Soboslay A, Akil H, Martin CE, Bigelow LB, Herman SM, Hyde TM, et al. Reliability of psychiatric diagnosis in postmortem research. Biological Psychiatry. 2005 Jan 1, 96-101.
- Hargrove JL, Schmidt FH. The role of mRNA and protein stability in gene expression. FASEB J. 1989 Oct;3(12):2360-70.
- I-Min Lee, MBBS ScD, Nancy R Cook, ScD J Michael, Gaziano MD, David Gordon, et al. Vitamin E in the Primary Prevention of Cardiovascular Disease and Cancer. JAMA. 2005;294(1):56-65.
- Paul Preece, Nigel J Cairns. Quantifying mRNA in postmortem human brain: influence of gender, age at death, postmortem interval, brain pH, agonal state and inter-lobe mRNA variance. Molecular Brain Research. 2003 Oct 21;118(1-2):60-71.
- Marcel Ferrer-Alcón, Romano La Harpe, Jesús A. Garcı á-Sevilla. Decreased immunodensities of μ-opioid receptors, receptor kinases GRK 2/6 and β-arrestin-2 in postmortem brains of opiate addicts. Molecular Brain Research. 2004 Feb 5;121(1-2):114-122.
- James F, Trotter MD, Nancy Stolpman, Michael Wachs 2 , Thomas Bak 1 , Marcelo Kugelmas 1 , et al. Living donor liver transplant recipients achieve relatively higher immunosuppressant blood levels than cadaveric recipients. Liver Transplantation. 2002 Mar; 8(3):212-218.
- Ann E Kingsbury, Oliver JF, Foster Angus P, Nisbet Nigel, Cairns Louise Bray, David J, et al. Tissue pH as an indicator of mRNA preservation in human postmortem brain. Molecular Brain. 1995 Feb 28(2):311318.
- Shuxin Li1, Betty P Liu, Stephane Budel, Mingwei Li, Benxiu Ji, Lee Walus, et al. Strittmatter. Blockade of Nogo-66, Myelin-Associated Glycoprotein, and Oligodendrocyte Myelin Glycoprotein by Soluble Nogo-66 Receptor Promotes Axonal Sprouting and Recovery after Spinal Injury. The Journal of Neuroscience. 2004 Nov 17;24(46):10511-10520. DOI: 10.1523/JNEUROSCI.2828-04.2004
- Sandrine Imbeaud, Esther Graudens, Virginie Boulanger, Xavier Barlet, Patrick Zaborski, Eric Eveno, et al. Towards standardization of RNA quality assessment using user-independent classifiers of microcapillary electrophoresis traces. Nucl. Acids Res. 2005;33(6):e56. DOI:10.1093/nar/gni054.