
Research article · 2018 · Full text
International Journal of Agriculture Extension and Social DevelopmentExtent of people’s participation in different activities at various stages in integrated watershed management programmed
Volume 1(2) · Pages 69–73 · DOI: 10.33545/26180723.2018.v1.i2a.159 ↗
Research areasAgricultural Economics and PracticesSouth Asian Studies and ConflictsSocial and Economic Development in India
Abstract
Author-writtenThe study was carried out during 2016-17 in the Mungeli district of Chhattisgarh state. This study aims to assess information on extent of people’s participation in integrated watershed management’s programme. This study was conducted in selected 12 villages identified from 2 blocks of Mungeli district and the sample comprised of 120 farmers. The data collection was done by structured interview schedule and through personal interview. The findings related to the extent of people’s participation in integrated watershed management programme indicated that at programme initial stage; respondents had 69.58% maximum people’s participation index score. At planning stage, respondents had 66.96% maximum people’s participation index score. At implementation stage, respondents had 77.01% maximum people’s participation index score. At maintenance stage, respondents had 72.08% maximum people’s participation index score. At evaluation stage, respondents had 60.03% maximum people’s participation index score. At last it was concluded that maximum participation of respondents were found in implementation stage which was 77.01% with minimum participation gap (22.99%). While 69.13% overall people’s participation found with 30.87% participation gap in the study area.
Summary
Source-checkedPlain-language reading of the full paper, prepared with AI and checked against the text. Each point links to the authors' own words.
Why it matters
- Watershed degradation is a critical global issue that harms natural resources, hinders food security, and creates negative socio-economic and environmental impacts. View evidence ↗
- The Indian government views active community participation as a key strategy for ensuring the success of watershed management programs. View evidence ↗
- Local participation allows rural residents to contribute indigenous knowledge, ensuring that development goals align with community values and ecological needs. View evidence ↗
The question
- The study aims to evaluate the extent to which people participate in the Integrated Watershed Management Programme (IWMP). View evidence ↗
What they did
- Data were gathered using personal interviews and a structured interview schedule. View evidence ↗
- The analysis employed statistical methods including frequency, mean, percentage, correlation coefficients, and multiple regression. View evidence ↗
What they found
- During the initial stage of the program, the maximum people's participation index score was 69.58%. View evidence ↗
- The planning stage showed a maximum people's participation index score of 66.96%. View evidence ↗
- The implementation stage had the highest level of engagement, with a maximum people's participation index score of 77.01%. View evidence ↗
- The maintenance stage recorded a maximum people's participation index score of 72.08%. View evidence ↗
- The evaluation stage had the lowest engagement, with a maximum people's participation index score of 60.03%. View evidence ↗
- The overall people's participation across all stages was 69.13%, leaving a participation gap of 30.87%. View evidence ↗
What it means
- The authors concluded that the implementation stage saw the highest level of respondent participation (77.01%) and the smallest participation gap (22.99%). View evidence ↗
Visual summary
1 visualsIllustrations explain the paper; charts are replotted from the paper's own table values.
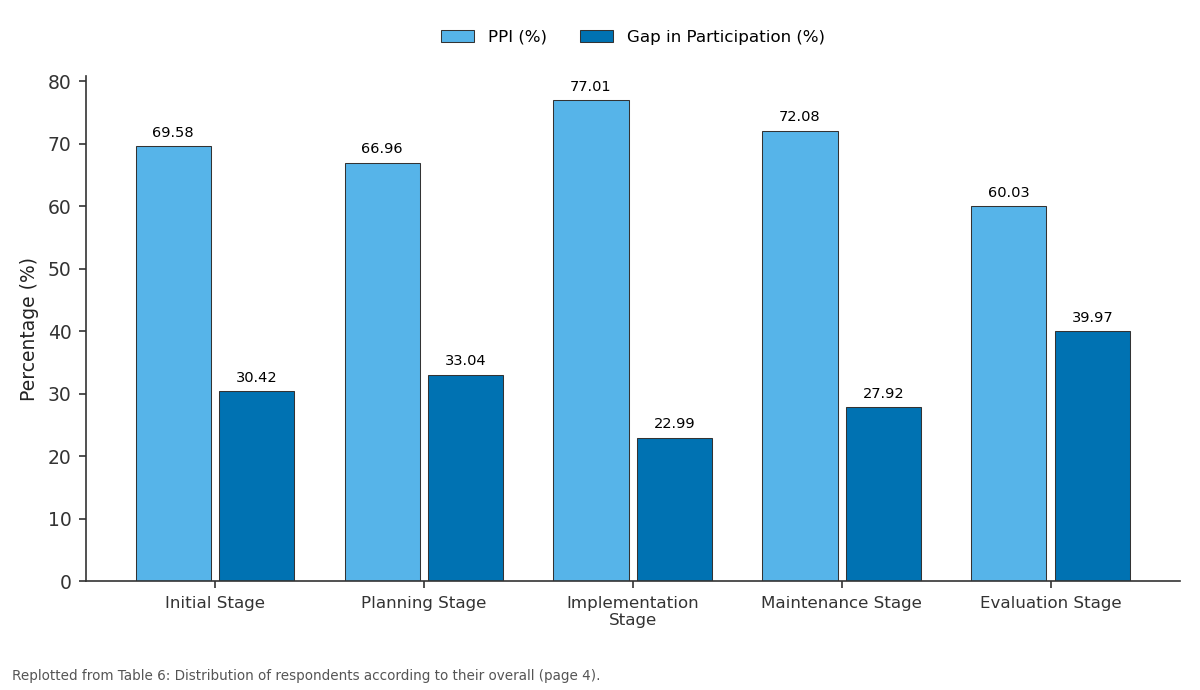
PPI (%) and Gap in Participation (%): Initial Stage vs Planning Stage vs Implementation Stage vs Maintenance Stage vs Evaluation Stage
Replotted from Table 6 (page 4) of the original paper. Every bar is the paper's own table value.
View source evidence ↗Figures & tables
From the original paper Table 1
 Table 2
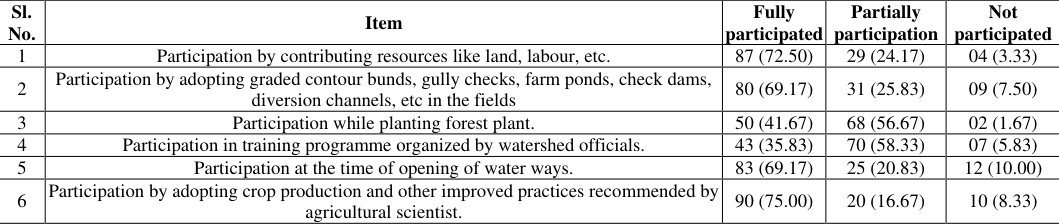 Table 3
 Table 4
 Table 5
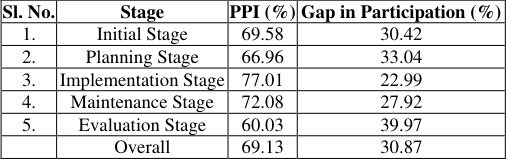 Table 6
Introduction
The Integrated Watershed Management Programme (IWMP) one of the flagship programme of Ministry of Rural Development is under implemented by the Department of Land Resources since 2009-10. Watershed in general is an area that supplies water by surface or subsurface flow to a given drainage system or body of watera stream, river, wetland, lake or ocean. The interaction between land and water and its use and management decides the characteristics of the water flow and its relationship to the watershed. In recent decades, in many parts of the world, watershed degradation has emerged as a most serious problem causing natural resource degradation, which has been acting as a "pull factor" for the efforts of achieving food security and led to negative environmental and socioeconomic consequences. People's participation in watershed management programmes is an important strategy of government of India for making watershed programmes successful. The major benefits flowing from the participation of the people in development are; in the planning and programming stages and throughout the implementation of development programmes, rural people can provide valuable social-cultural, ecological, economic and technical indigenous knowledge ensuring consistency between objectives of development and community values and preferences; people can mobilize local resources in the form of cash, labour, materials, managerial talent and political support which are critical to programme success. The programme should meet the daily requirements of the majority of the stakeholders like supply of drinking water, fodder for cattle and fuel for kitchen.
Methodology
The study was carried out during 2016-17 in the Mungeli district of Chhattisgarh state. This study was conducted in selected 12 villages (10 respondents from each village) identified from 2 blocks of Mungeli district and the sample comprised of 120 [10 x 12 =120] farmers. The data collection was done by structured interview schedule and through personal interview. Collected data were processed, tabulated and analyzed by using appropriate statistical scales and methods like frequency, mean, per-cent, correlation coefficient and multiple regression analysis. The extent of people's participation in Integrated Watershed www.extensionjournal.com Management Programme was assessed by the response of respondents of watershed towards participation in various stages of integrated watershed management programme viz., planning stage, implementation stage, Maintenance stage, and evaluation stage. It was measured with the help of interview schedule developed for this purpose.
Result and Discussion
Extent of Peoples participation in integrated watershed management programme Data pertaining to extent of people's participation at initial stage are presents in table. A. The data revealed that the majority of the respondents (75%) were fully participated in that particular activity followed by respondents with partially participated (13.33%) and only 11.67% of respondents did not participate. The result related to second statement of the table A. i.e., Participation in meetings to discuss about village problems, the majority of the respondents (38.33%) were fully participated in that particular activity followed by respondents with partially participated (37.5%) and only 24.17% of respondents did not participate. The result related to third statement of the table A. i.e., Participation in prioritizing the available solution to solve the identified problems, the majority of the respondents (49.17%) were partially participated in that particular activity followed by respondents with fully participated (37.5%) and only 13.33% of respondents did not participate. The result related to fourth statement of the table A. i.e., Participation in preparation of bench mark survey report, the majority of the respondents (66.67%) were not participated in that particular activity followed by respondents with partially participated (19.17%) and only 14.17% of respondents did not participate. The result related to fifth statement of the table A. i.e., Participation in deciding the demarcation of watershed boundary, the majority of the respondents (57.5%) were fully participated in that particular activity followed by respondents with partially participated (23.33%) and only 19.17% of respondents did not participate. The result related to sixth statement of the table A. i.e., Participation in formulating watershed associations/ sanghs/ societies, the majority of the respondents (58.33%) were fully participated in that particular activity followed by respondents with partially participated (25.83%) and only 15.84% of respondents did not participate. Data pertaining to extent of people's participation at planning stage are presents in table 4.19.B. The data revealed that the majority of the respondents (74.17%) were fully participated in that particular activity followed by respondents with partially participated (13.33%) and only 12.50% of respondents did not participate. The result related to second statement of the table B. i.e., Participation in discussion to identifies the production problems of village and technological options, the majority of the respondents (67.50%) were partially participated in that particular activity followed by respondents with fully participated (23.33%) and only 9.17% of respondents did not participate. The result related to third statement of the table B. i.e., Participation in meetings to approve the proposals for activities in work plan, the majority of the respondents (60%) were partially participated in that particular activity followed by respondents with not participated (20.83%) and only 19.17% of respondents were fully participated. The result related to fourth statement of the table B. i.e., Participation in deciding the location and design of proposed soil and water conservation structures measures like bunds, water ways, farm pods, bund, check dam, gully checks, etc, the majority of the respondents (67.50%) were fully participated in that particular activity followed by respondents with partially participated (19.17%) and only 13.33% of the respondents did not participate. The result related to fifth statement of the table B. i.e., Participation by suggesting income generating components in project plan, the majority of the respondents (58.33%) were partially participated in that particular activity followed by respondents with fully participated (29.17%) and only 12.50% of the respondents did not participate. The result related to sixth statement of the table B. i.e., Participation in discussion for setting of norms for distribution/ sharing of benefits among people coming from community lands, the majority of the respondents (58.33%) were fully participated in that particular activity followed by respondents with partially participated (23.33%) and only 18.34% of the respondents did not participate. Data pertaining to extent of people's participation at maintenance stage are presents in table D. The data revealed that the majority of the respondents (66.67%) were fully participated in that particular activity followed by respondents with not participated (25%) and only 8.33% respondents were partially participated. The result related to second statement of the table D. i.e., Participation by fixing responsibility among user groups to maintain the works/activities taken up under the programme, the majority of the respondents (54.17%) were partially participated in that particular activity followed by respondents with fully participated (37.50%) and only 8.33% respondents did not participate. The result related to third statement of the table D. i.e., Participation in maintenance of soil and water conservation works/ structures taken up in fields on community lands, the majority of the respondents (76.67%)
| Sl. No. | Item | Fully participated | Partially participation | Not participated |
|---|---|---|---|---|
| 1 | Participation by publicizing the importance of maintenance of assets development under programme | 80 (66.67) | 10 (8.33) | 30 (25.00) |
| 2 | Participation by fixing responsibility among user groups to maintain the works/activities taken up under the programme | 45 (37.50) | 65 (54.17) | 10 (8.33) |
| 3 | Participation in maintenance of soil and water conservation works/ structures taken up | 92 (76.67) | 26 (21.67) | 02 (1.67) |
Table text extracted from the original PDF; superscript letters are shown inline. The original table image is below.
View original table image
were partially participated in that particular activity followed by respondents with fully participated (21.67%) and only 1.67% of the respondents did not participate. The result related to fourth statement of the table D. i.e., Participation by protecting the trees in the development forest plots, the majority of the respondents (48.33%) were partially participated in that particular activity followed by respondents with fully participated (39.17%) and only 12.5% of respondents did not participate. The result related to fifth statement of the table D. i.e., Participation by protecting grazing areas in the village, the majority of the respondents (55%) were fully participated in that particular activity followed by respondents with partially participated (38.33%) and only 6.67% of the respondents did not participate. Data pertaining to extent of people's participation at Evaluation stage are presents in table E. The data revealed that the majority of the respondents (55.83%) were fully participated in that particular first activity followed by respondents with partially participated (42.50%) and only 1.67% of respondents did not participate. The result related to second statement of the table E. i.e., Participation by expressing problems encountered in programme to the officials of IWMP, the majority of the respondents (48.33%) were partially participated in that particular activity followed by respondents with fully participated (33.33%) and only 18.33% of respondent did not participate. The result related to third statement of the table E. i.e., Participation by assisting the officials in collection of feedback, the majority of the respondents (57.50%) were partially participated in that particular activity followed by respondents with fully participated (39.17%) and only 3.33% of respondents did not participate.
The result related to fourth statement of the table E. i.e., Participation in meeting to provide required information for preparation of report, the majority of the respondents (67.50%) were fully participated in that particular activity followed by respondents with not participated (28.33%) and only 4.17% of the respondents were partially participated. The result related to fifth statement of the table E. i.e., Participation by suggesting suitable modifications for future programme, the majority of the respondents (55%) were not participated in that particular activity followed by respondents with fully participated (24.17%) and only 20.83% of the respondents were partially participated. The result related to sixth statement of the table E. i.e., Participation by attending meetings to review the progress of works/ activities, the majority of the respondents (49.17%) were fully participated in that particular activity followed by respondents with not participated (40.83%) and only 10% of the respondents were partially participated. Data pertaining to overall extent of people's participation in IWMP are presents in table F. The data revealed that maximum participation of respondents were found in implementation stage which was 77.01% with minimum participation gap (22.99%). However there was 69.13% overall people's participation found with 30.87% participation gap.
Figures and tables from the paper
| Sl. No. | Item | Fully participated | Partially participation | Not participated |
|---|---|---|---|---|
| 1 | Participation in attempting to gain information about the objectives of programme. | 90 (75) | 16 (13.3) | 14 (11.67) |
| 2 | Participation in formal and informal meetings to discuss about village problems | 46 (38.33) | 45 (37.5) | 29 (24.17) |
| 3 | Participation in prioritizing the available solution to solve the identified problems | 45 (37.5) | 59 (49.17) | 16 (13.3) |
| 4 | Participation in preparation of bench mark survey report | 80 (66.67) | 23 (19.17) | 17 (14.17) |
| 5 | Participation in deciding the demarcation of watershed boundary | 69 (57.5) | 28 (23.33) | 23 (19.17) |
| 6 | Participation in formulating watershed associations/sanghs/societies | 70 (58.33) | 31 (25.83) | 19 (15.84) |
Table text extracted from the original PDF; superscript letters are shown inline. The original table image is below.
View original table image
| Sl. No. | Item | Fully participated | Partially participation | Not participated |
|---|---|---|---|---|
| 1 | Participation in decision making for contribution of resources like land, labour etc. | 89 (74.17) | 16 (13.33) | 15 (12.50) |
| 2 | Participation in discussion to identifies the production problem of village and technological options. | 28 (23.33) | 81 (67.5) | 11 (9.17) |
| 3 | Participation in formal and informal meetings to approve the proposals for activities in work plan. | 23 (19.17) | 72 (60.00) | 25 (20.83) |
| 4 | Participation in deciding the location and design of proposed soil and water conservation structures measures like water ways, farm pods, bund, check dam, gully checks, etc. | 81 (67.50) | 23 (19.17) | 16 (13.33) |
Table text extracted from the original PDF; superscript letters are shown inline. The original table image is below.
View original table image
| Sl. No. | Item | Fully participated | Partially participation | Not participated |
|---|---|---|---|---|
| 1 | Participation by contributing resources like land, labour, etc. | 87 (72.50) | 29 (24.17) | 04 (3.33) |
| 2 | Participation by adopting graded contour bunds, gully checks, farm ponds, check dams, diversion channels, etc in the fields | 80 (69.17) | 31 (25.83) | 09 (7.50) |
| 3 | Participation while planting forest plant. | 50 (41.67) | 68 (56.67) | 02 (1.67) |
| 4 | Participation in training programme organized by watershed officials. | 43 (35.83) | 70 (58.33) | 07 (5.83) |
| 5 | Participation at the time of opening of water ways. | 83 (69.17) | 25 (20.83) | 12 (10.00) |
| 6 | Participation by adopting crop production and other improved practices recommended by agricultural scientist. | 90 (75.00) | 20 (16.67) | 10 (8.33) |
Table text extracted from the original PDF; superscript letters are shown inline. The original table image is below.
View original table image
| Sl. No. | Item | Fully participated | Partially participation | Not participated |
|---|---|---|---|---|
| 1 | Participation in determining the success of programme by supplying information on the benefits received from programme. | 67 (55.83) | 51 (42.50) | 02 (1.67) |
| 2 | Participation by expressing problems encountered in programme to the officials of IWMP. | 40 (33.33) | 58 (48.33) | 22 (18.33) |
| 3 | Participation by assisting the officials in collection of feedback. | 47 (39.17) | 69 (57.50) | 04 (3.33) |
| 4 | Participation in meeting to provide required information for preparation of report. | 81 (67.50) | 05 (4.17) | 34 (28.33) |
| 5 | Participation by suggesting suitable modifications for future programme. | 29 (24.17) | 25 (20.83) | 66 (55.00) |
| 6 | Participation by attending meetings to review the progress of works/activities. | 59 (49.17) | 12 (10.00) | 49 (40.83) |
Table text extracted from the original PDF; superscript letters are shown inline. The original table image is below.
View original table image
| Sl. No. | Stage | PPI (%) | Gap in Participation (%) |
|---|---|---|---|
| 1. | Initial Stage | 69.58 | 30.42 |
| 2. | Planning Stage | 66.96 | 33.04 |
| 3. | Implementation Stage | 77.01 | 22.99 |
| 4. | Maintenance Stage | 72.08 | 27.92 |
| 5. | Evaluation Stage | 60.03 | 39.97 |
| Overall | 69.13 | 30.87 |
Table text extracted from the original PDF; superscript letters are shown inline. The original table image is below.
View original table image
References
10 in the original paper- Anil K, Kushwaha TS, Singh YK, Rai DP. Adoption of watershed technologies by the farmers in Morena district of Madhya Pradesh. Indian Research Journal of Extension Education. 2010;10(2):58-60.
- Bharamappanavara SC, Jose M. Group Dynamics and Collective Performance of Self-Help Groups under Different Microcredit Delivery Models in Karnataka. Agriculture Economics Research Review. 2015;28(1):127-138.
- Chandel BS. Management approach for integrated development of a watershed. MANAGE Extension Research Review. 2003;4(1):88-100.
- Gupta BS, Chauhan J, Thomas M, Kakran MS. Extent of Participation of Beneficiaries in the Different MicroAgro Eco System of Ghorbae Watershed Area in Shahdol District, Madhya Pradesh. Indian Research Journal of Extension Education. 2010;10(2):113-115.
- Padmaiah M, Ansari MR, Viswanath A. Participation of local farmers in the process of Janampet Watershed Development Programme. Indian Journal of Soil www.extensionjournal.com Conservation. 2001;29(2):158-163.
- Pagire BV. Impact of watershed development programme on crop productivity and agricultural income. Indian Journal of Agricultural Economics. 1989;44(3):274.
- Patel DB, Thakkar KA, Patel KS. Perception of the farmers about transfer of technology system in north Gujarat. Gujarat Journal of Extension Education. 2007;22:17-20.
- Shimla RN. Constraints in people's participation in watershed development programme. Indian Research Journal of Extension Education. 2008;8(1):4-10.
- Singh R, Kumar A, Chand R. Accelerating adoption of zero tillage technology. Indian Research Journal of Extension Education. 2007;7(1):6-10.
- Subhaschand AK, Sikka RC, Srivastava, Sundarambal. Constraints faced by functionaries in watershed management: A case study. Indian Research Journal of Extension Education. 2009;9(2):68-71.