
Research article · 2019 · Full text
International Journal of Horticulture and Food ScienceMorphological and reproductive characterization of developed mutants in groundnut
Volume 1(2) · Pages 48–54 · DOI: 10.33545/26631067.2019.v1.i2a.30 ↗
Research areasPeanut Plant Research Studies
Abstract
Author-writtenTwenty eight established groundnut mutants and two check cultivars were studied during Kharif-I (March-June) season of 2017 and 2018 to find out their variability and distinct character(s) as identifying keys. All the mutant lines showed erect type sequential branching habits with two seeds in each pod although they had shown significant variability in all vegetative and reproductive structures. According to cluster analysis, 30 mutants/varieties clustered into three major groups at distance level 60 based on the morphological variability of 14 characters. The variability of 14 morphological characters in three principal components was explained by 98.12% of the total variation. The characters, 100-pod weight had the highest contribution followed by branch length, plant height and 100-kernel weight. Twenty three mutant genotypes grouped into intermediate type of the extremes in any given identifying key characteristics. Only single genotype of the whole lot showed distinctively the longest primary branch and highest secondary branch number and small seed size (D1/24-29), highest primary branch number (M6/7-25), lowest primary branch number (Mut-2), highest leaflet length and light green leaf colour (Dhaka-1), presence of stem pigmentation and pod beak and highest number of seeds pod-1 (Zhingabadam), leaflet shape lanceolate (M6/54-20). In contrast, only two mutants of the lot showed two buds raceme-1 (M6/36-24 and M6/61-6), bolder pod and seed size and highly constricted pod (Mut-2 and Mut-3). The genotypes with the above distinguished characteristic featured for being ideal genetic markers and could be used in future breeding applications as well as aids in varietal identification.
Summary
Source-checkedPlain-language reading of the full paper, prepared with AI and checked against the text. Each point links to the authors' own words.
Why it matters
- Groundnut is an important annual legume valued for its high-quality edible oil (36-54% dry matter) and digestible protein (12-36%). View evidence ↗
- The ability to characterize and identify plant varieties is essential for developing, releasing, and popularizing new crop varieties. View evidence ↗
- Morphological descriptors are useful for varietal identification because they are traditionally significant and can be assessed in the field without specialized equipment. View evidence ↗
The question
- The study aimed to assess vegetative and reproductive differences among 28 elite mutants and two check cultivars to create identification keys and classify genetic dissimilarity. View evidence ↗
What they did
- Two field experiments were conducted at the Bangladesh Institute of Nuclear Agriculture in Mymensingh during the March-June seasons of 2017 and 2018. View evidence ↗
- The experiments utilized a randomized complete block design with three replicates. View evidence ↗
- Statistical analysis was performed using ANOVA, with mean differences adjusted using Duncan's Multiple Range Test (DMRT) at a 5% significance level. View evidence ↗
What they found
- Plant height varied significantly, with mutant D1/11-60 being the tallest (52.7 cm) and M6/57-15 being the shortest (25.8 cm). View evidence ↗
- Mutant D1/24-29 exhibited the longest cotyledonary branch at 77.3 cm, which was significantly different from all other genotypes. View evidence ↗
- The highest number of primary branches was found in mutant M6/7-25 (8 per plant), while the lowest was in mutant Mut-2 (3.0 per plant). View evidence ↗
- Mutant Mut-2 recorded the highest 100-pod weight (190.2 g) and 100-kernel weight (81.67 g), whereas Dhaka-1 had the lowest weights for both. View evidence ↗
- Cluster analysis at a distance level of 60 grouped the 30 genotypes into three major clusters: Cluster I (4 accessions), Cluster II (13 accessions), and Cluster III (13 accessions). View evidence ↗
- Principal component analysis showed that three PCs explained 98.12% of the total variation, with the first PC contributing the most at 86.21%. View evidence ↗
- The most influential characters in the variation were 100-pod weight, followed by branch length, plant height, and 100-kernel weight. View evidence ↗
What it means
- The authors conclude that mutants with these distinguished morphological characteristics serve as ideal genetic markers for future breeding applications. View evidence ↗
Visual summary
2 visualsIllustrations explain the paper; charts are replotted from the paper's own table values.
Conceptual Workflow of Varietal Identification
AI-generated conceptual illustration (groundnut plants (Arachis hypogaea)). It explains the idea and does not show study data.
View source evidence ↗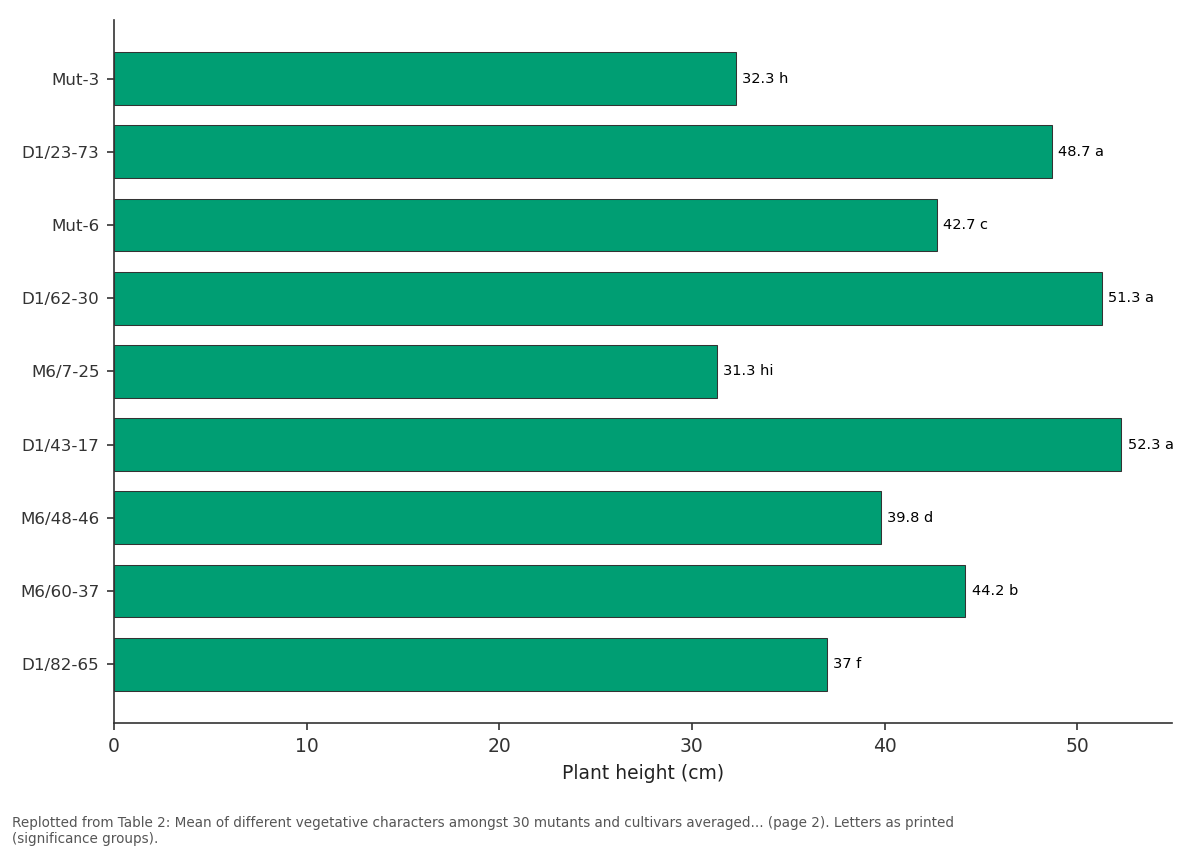
Plant height (cm): Mut-3 vs D1/23-73 vs Mut-6 vs D1/62-30 vs M6/7-25
Replotted from Table 2 (page 2) of the original paper. Every bar is the paper's own table value.
View source evidence ↗Figures & tables
From the original paper Table 1
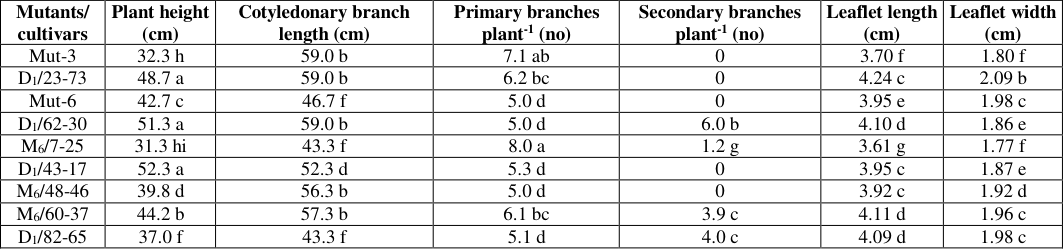 Table 2
 Table 3
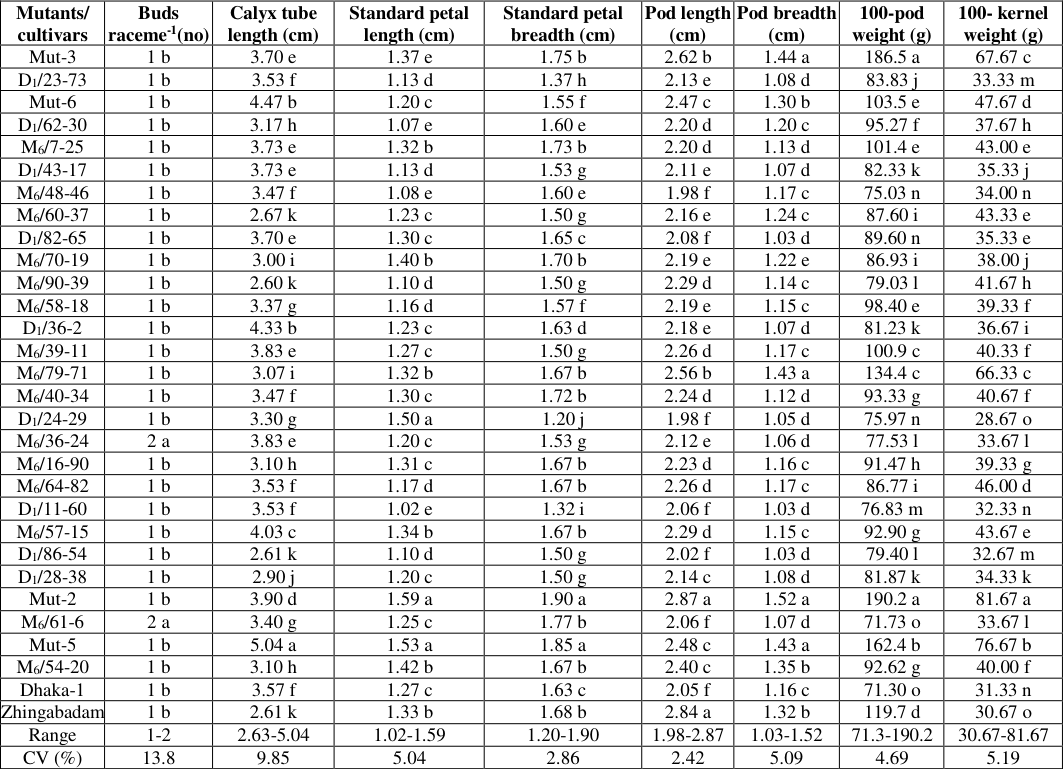 Table 4
 Table 5
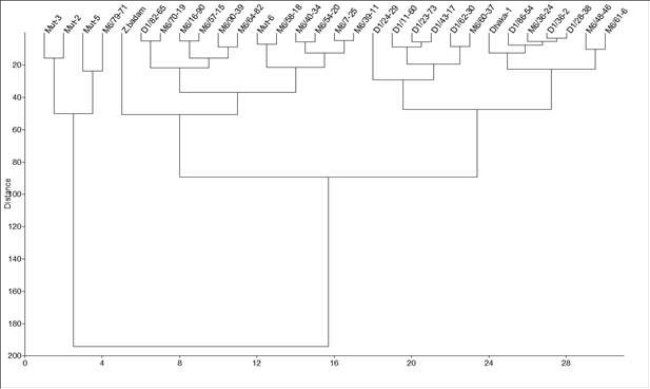 Figure 1
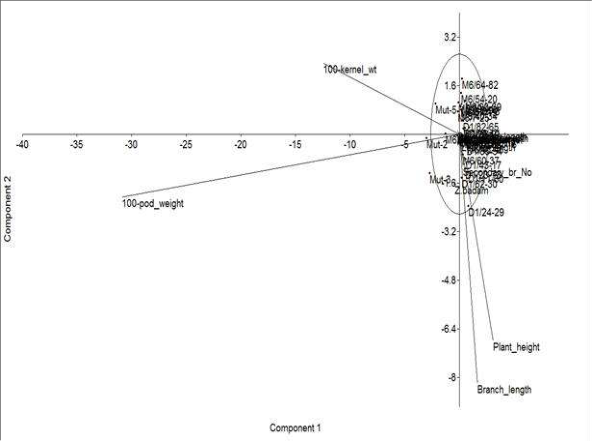 Figure 2
Introduction
Groundnut (Arachis hypogaea L.) is an annual legume grown primarily for high quality edible oil (36-54% on dry matter basis) and easily digestible protein (12-36%) in its seeds. It is cultivated worldwide in tropical, sub-tropical and warm temperature areas located between 40 0 N to 40 0 S with world production of 36.9 million tonnes from an area of 25.2 million ha (FAO, 2016) [5] . Groundnut seed is nutritionally rich due to presence of lipids, proteins, essential minerals, vitamins, phytosterols and phytochemicals. Consequently groundnut is playing a vital role as an oilseed as well as food crop (Mondal and Puteh, 2013) [10] . Characterization and identification of plant varieties are fundamental to the development, release and popularization of the crop varieties. Seed is the 'custodian' of genetic improvements in crop species takes place from time through research endeavours in plant breeding. For farmers to realize the full benefits of such improvements, availability of good quality seed is a pre-requisite in crop production. In this context, varietal description for identification of crop varieties has attained a critical importance in national and international seed programmes and there is a considerable need for the development of reliable methods and identifiable characters for identification purpose. The characters for which a variety is distinct from others could be morphological, chemical and biochemical or physiological in nature which aids in varietal identification. The varietal purity is usually tested by heritable characters of seeds, seedlings or growing plants in a field. Grow out test (GOT) is conducted by growing the plants under field condition and growth feature are observed in fixing genuineness. These morphological descriptors have traditional significance and are immediately accessible on the spot without the need of equipments. Distinctive variation in any morphological character, either vegetative or reproductive, could be an aid in the identification of cultivars. Moreover, this help both in management and varietal improvement efforts required for overall increase in crop production. Stem, branch and leaflet characters have been widely used in classifying groundnut cultivars (Ntundu et al. [12] . Mouli and Patil (1976) [11] suggested that the classification of branching types should take into account the presence or absence of primary, secondary and tertiary branches as well as their development. Doku and Asiama (1978) [4] reported variation in shape, size and hairiness between leaflets of the same cultivars, and even on the same plant. Additionally, they also suggested the use of floral characters for identification of plants at specific and higher levels. In groundnut classification, generally both quantitative and qualitative characters of pods have been widely used (Pasquet et al. 1999; Ntundu et al. 2006; Bayor et al. 2010) [13,12,2] . Further, Multivariate analysis have been used successfully to classify and order variation observed in both quantitative and qualitative traits in the collection of many crop germplasm (Chandran & Padya, 2000 [3,7,9] . Assessment of vegetative and reproductive traits variability of groundnut using multivariate analyses could provide useful information to allow exploitation of the potential of available germplasm. This study was therefore under taken to precisely assess differences in the vegetative and reproductive characters amongst 28 elite mutants and two check cultivars for framing keys of future identifying strategies of groundnut and classify genetic dissimilarity among accessions through cluster analysis.
2006)
2006)
Materials and Methods
Two field experiments were conducted at the Bangladesh Institute of Nuclear Agriculture (BINA), Mymensingh (24 0 75´ N and 90 0 50´ E) during Kharif-I (March-June) seasons of 2017 and 2018. The experiments were carried out under rainfed conditions. The soil of experimental land was sandy loam having a total nitrogen 0.065%, organic matter 1.17%, available phosphorus 18.5 ppm, exchangeable potassium 0.30 meq/100g, sulphur 20 ppm and pH 6.8. Twenty four established mutants of M6 generation developed at BINA by 150-200 Gy irradiation, four mutants collected from ICRISAT and two released varieties belonging to Spanish group were studied. Randomized complete block design with three replicates was used in both the experiments. Urea, triple super phosphate and muriate of potash were applied during final land preparation at the rate of 40, 150 and 120 kg ha -1 , respectively. Seeds were sown on 15 th March, 2017 and 10 th March, 2018 with plant spacing of 30 cm and 15 cm. Unit plot size was 2.1m × 2m. Intercultural operations were done as and when necessary for normal plant growth and development. All the plants of the mutants/cultivars were harvested at a time, 135 and 130 days after sowing for experiment-1 and-2, respectively. Data on different vegetative and reproductive characters were recorded from the experiments following standard methods. For quantitative characters ten plants were scored per accession for each replication. Data were analyzed statistically as per the design used following the analysis of variance (ANOVA) technique and the mean differences were adjusted with DMRT at 5% level of significance using the statistical computer package program, MSTAT-C following Russell (1986) [18] . The morphological data were further analyzed using Euclidian distance coefficient (Zivkovic et al., 2012) [20] , NTSYS-pc Versions 2.1 (Rohlf, 2002) [17] program. These similarity coefficient were used to produce a dendrogram for which the UPGMA algorithm and SAHN clustering (unweighted pair group method using arithmetic average) was employed for depicting the genetic relationships. Data were subjected to principal component analysis (PCA) using the same program. The eigenvectors and eigenvalues were determined in PCA. Eigenvectors are the weights in a linear transformation when computing principal component scores while eigenvalues indicate the amount of variance explained by each principal component.
Results and Discussion
Results and Discussion
Vegetative characters
The effect of season and genotype and their interaction showed highly significant differences for vegetative characters except number of secondary branches for season and leaflet width for interaction of season and genotype (Table 1). This means significant differences existed for season and genotype while some genotypes performed better or worse over a season. The mean effects of genotype on vegetative characters are shown in the Table 2. The vegetative characters showed significant differences amongst the mutants and the check cultivars (Table 2). Plant height (main stem height) showed a wide range of variability, with mutants D1/11-60 (52.7 cm) and M6/57-15 (25.8 cm) being the tallest and shortest of all, respectively. In contrast, five mutants D1/23-73, D1/62-30, D1/43-17, D1/24-49 and D1/86-54, and one cultivar Zhingabadam showed non-significant differences from the tallest group whilst the four others namely, M6/16-90, M6/64-82, M6/61-6 and Mut-5 were at par with the shortest one. The remainder formed an intermediate group.
Cotyledonary branch length had shown considerable variation ranging from 35.0 to 77.3 cm. Mutant D1/24-29 had the longest cotyledonary branch (77.3 cm) with a significant difference from the rest (Table 2). In contrast, mutant D6/54-20 showed the shortest cotyledonary branch (35.0 cm) and was not significantly different from M6/39-11, M6/64-82 and Mut-5. Mutant M6/7-25 had the highest number of primary branches (8 plant -1 ) and was statistically at par with its parent, Dhaka-1 (7.2 plant -1 ). In contrast, mutant Mut-2 had the lowest number of primary branches (3.0 plant -1 ) followed by M6/57-15 (3.5 plant -1 ) with same statistical rank. The mutants M1/24-29 and M1/62-30 produced the highest (10 plant -1 ) and second highest (6 plant -1 ) secondary branches and showed significant differences from each other and all other mutants. In contrast, 17 mutants/varieties had no secondary branches. Leaflet length and breadth are central attributes of leaf sizes and shapes which showed the least variation (Table 2). The leaflet length and breadth of Dhaka-1 was the highest with that of mutant M6/54-20 being the lowest, and these two were significantly different from the remainder. The above results of variability are in full conformity with many workers (Patil, 1972; Mouli and Patil, 1976; Bayor et al. 2010) [15,11,2] .
Reproductive characters
Season had no great influence on reproductive characters while genotypes had great effect on reproductive characters (Table 3). It means reproductive characters are not greatly influenced by season like vegetative characters. The interaction effect of genotype and season also had no significant differences in most of the reproductive characters except 100-pod and 100-kernel weight. The mean effects of genotype on reproductive characters are shown in the Table 3. Among different flower characters, buds per raceme had the highest variability followed by calyx tube length, standard petal length and breadth (Table 4). Most of the mutants and cultivars were alike in showing single bud per raceme, excepting M6/36-24 and D6/61-6 that showed more than one bud. Calyx tube length was the highest in Mut-5 (5.05 cm) followed by Mut-6 (4.47 cm) and D1/36-2 (4.33 cm). In contrast, Zhingabadam had the lowest tube length (2.61 cm) and shared equal rank with four other mutants (range 2.63-2.70 cm). Standard petal length, in general, appeared lower than their breadth amongst the mutants and cultivars. Standard petal length was the highest in Mut-2 (1.59 cm) and showed insignificant difference with Mut-5 (1.53 cm) and D1/24-29 (1.50 cm). Contrarily, mutant D1/11-60 was the shortest of all in standard petal length (1.02 cm). Once again, Mut-2 showed the highest standard petal breadth (1.90 cm) while that of D1/24-29 was the lowest (1.20 cm). Patil and Mouli (1977) [14] observed high variability in calyx tube and standard petal length and breadth of groundnut. Mut-2 had the highest pod length (2.87 cm) but identical with Zhingabadam (2.84 cm) while mutants D1/24-29 and M6/48-46 had the lowest (1.98 cm) and insignificant different with other five mutants/cultivar D1/82-65, D1/11-60, D1/86-54, M6/61-6 and Dhaka-1 (Table 4). Once again, Mut-2 had the highest pod breadth (1.52 cm) but at par with Mut-3 (1.44 cm), Mut-5 (1.43 cm) and M6/79-71 (1.43 cm). In general, those mutants that showed the lowest pod length also showed the lowest pod breadth. Kernel and pod weights mostly displayed significant variability amongst the mutants and cultivars. Those mutants which showed higher pod weights also showed higher kernel weights. The highest 100-pod (190.2 g) and 100-kernel (81.67 g) weights were recorded in Mut-2. In contrast, Dhaka-1 showed the lowest pod and kernel weights. All the developed mutants have shown extreme variability which are in full conformity with Ashri and Levy (1979) [1] who had observed similar results using chemical mutagens in groundnut.
| Mutants/ cultivars | Buds raceme-1(no) | Calyx tube length (cm) | Standard petal length (cm) | Standard petal breadth (cm) | Pod length (cm) | Pod breadth (cm) | 100-pod weight (g) | 100- kernel weight (g) |
|---|---|---|---|---|---|---|---|---|
| Mut-3 | 1 b | 3.70 e | 1.37 e | 1.75 b | 2.62 b | 1.44 a | 186.5 a | 67.67 c |
| D1/23-73 | 1 b | 3.53 f | 1.13 d | 1.37 h | 2.13 e | 1.08 d | 83.83 j | 33.33 m |
| Mut-6 | 1 b | 4.47 b | 1.20 c | 1.55 f | 2.47 c | 1.30 b | 103.5 e | 47.67 d |
| D1/62-30 | 1 b | 3.17 h | 1.07 e | 1.60 e | 2.20 d | 1.20 c | 95.27 f | 37.67 h |
| M6/7-25 | 1 b | 3.73 e | 1.32 b | 1.73 b | 2.20 d | 1.13 d | 101.4 e | 43.00 e |
| D1/43-17 | 1 b | 3.73 e | 1.13 d | 1.53 g | 2.11 e | 1.07 d | 82.33 k | 35.33 j |
| M6/48-46 | 1 b | 3.47 f | 1.08 e | 1.60 e | 1.98 f | 1.17 c | 75.03 n | 34.00 n |
| M6/60-37 | 1 b | 2.67 k | 1.23 c | 1.50 g | 2.16 e | 1.24 c | 87.60 i | 43.33 e |
| D1/82-65 | 1 b | 3.70 e | 1.30 c | 1.65 c | 2.08 f | 1.03 d | 89.60 n | 35.33 e |
| M6/70-19 | 1 b | 3.00 i | 1.40 b | 1.70 b | 2.19 e | 1.22 e | 86.93 i | 38.00 j |
| M6/90-39 | 1 b | 2.60 k | 1.10 d | 1.50 g | 2.29 d | 1.14 c | 79.03 l | 41.67 h |
| M6/58-18 | 1 b | 3.37 g | 1.16 d | 1.57 f | 2.19 e | 1.15 c | 98.40 e | 39.33 f |
| D1/36-2 | 1 b | 4.33 b | 1.23 c | 1.63 d | 2.18 e | 1.07 d | 81.23 k | 36.67 i |
| M6/39-11 | 1 b | 3.83 e | 1.27 c | 1.50 g | 2.26 d | 1.17 c | 100.9 c | 40.33 f |
| M6/79-71 | 1 b | 3.07 i | 1.32 b | 1.67 b | 2.56 b | 1.43 a | 134.4 c | 66.33 c |
| M6/40-34 | 1 b | 3.47 f | 1.30 c | 1.72 b | 2.24 d | 1.12 d | 93.33 g | 40.67 f |
| D1/24-29 | 1 b | 3.30 g | 1.50 a | 1.20 j | 1.98 f | 1.05 d | 75.97 n | 28.67 o |
| M6/36-24 | 2 a | 3.83 e | 1.20 c | 1.53 g | 2.12 e | 1.06 d | 77.53 l | 33.67 l |
| M6/16-90 | 1 b | 3.10 h | 1.31 c | 1.67 b | 2.23 d | 1.16 c | 91.47 h | 39.33 g |
| M6/64-82 | 1 b | 3.53 f | 1.17 d | 1.67 b | 2.26 d | 1.17 c | 86.77 i | 46.00 d |
| D1/11-60 | 1 b | 3.53 f | 1.02 e | 1.32 i | 2.06 f | 1.03 d | 76.83 m | 32.33 n |
| M6/57-15 | 1 b | 4.03 c | 1.34 b | 1.67 b | 2.29 d | 1.15 c | 92.90 g | 43.67 e |
| D1/86-54 | 1 b | 2.61 k | 1.10 d | 1.50 g | 2.02 f | 1.03 d | 79.40 l | 32.67 m |
| D1/28-38 | 1 b | 2.90 j | 1.20 c | 1.50 g | 2.14 c | 1.08 d | 81.87 k | 34.33 k |
| Mut-2 | 1 b | 3.90 d | 1.59 a | 1.90 a | 2.87 a | 1.52 a | 190.2 a | 81.67 a |
| M6/61-6 | 2 a | 3.40 g | 1.25 c | 1.77 b | 2.06 f | 1.07 d | 71.73 o | 33.67 l |
| Mut-5 | 1 b | 5.04 a | 1.53 a | 1.85 a | 2.48 c | 1.43 a | 162.4 b | 76.67 b |
| M6/54-20 | 1 b | 3.10 h | 1.42 b | 1.67 b | 2.40 c | 1.35 b | 92.62 g | 40.00 f |
| Dhaka-1 | 1 b | 3.57 f | 1.27 c | 1.63 c | 2.05 f | 1.16 c | 71.30 o | 31.33 n |
| Zhingabadam | 1 b | 2.61 k | 1.33 b | 1.68 b | 2.84 a | 1.32 b | 119.7 d | 30.67 o |
| Range | 1-2 | 2.63-5.04 | 1.02-1.59 | 1.20-1.90 | 1.98-2.87 | 1.03-1.52 | 71.3-190.2 | 30.67-81.67 |
| CV (%) | 13.8 | 9.85 | 5.04 | 2.86 | 2.42 | 5.09 | 4.69 | 5.19 |
Table text extracted from the original PDF; superscript letters are shown inline. The original table image is below.
View original table image
Cluster analysis
Based on genetic distance, the variation among the groundnut mutant lines ranged from 130.8 to 4.7 (Fig. 1). The highest genetic distance (130.8) was computed between Mut-2 and D1/24-29 followed by between Mut-2 and D1/11-60 (126.1) and between Mut-2 and M6/60-37, and the lowest distance (4.7) was observed between D1/28-38 and D1/36-2 followed by between D1/28-38 and D1/86-54 (4.8) and between D1/28-38 and M6/36-24 (5.4). The details of distance matrix are shown in the Supplementary Table 1. Genotypes with higher genetic distances could be used as parents in hybridisations to obtain maximum heterosis as well as to use identifying keys for maintain purity of a genotype. Several authors previously described similar results (Upadhyaya, 2003; Ntundu et al. 2006; Latif et al. 2011) [19,12,8] . A cluster analysis with genetic distance produced by UPGMA dendrogram (Fig. 1), which clarified the overall genetic relationship between groundnut mutant lines. Based on the genetic distance, the 30 mutant lines were grouped into three major clusters at distance level 60. Cluster I consisted of 4 accessions, cluster II consisted of 13 accessions and cluster III consisted of 13 accessions. The UPGMA dendrogram, based on genetic distances, indicated that mutant lines derived from same parental lines could be classified into same cluster with parent or different clusters.
Principal component analysis (PCA)
Three principal components (PCs) accounted for 98.12% of the total variation in the 30 mutant lines of groundnut; of these, the first three PCs exhibited variations of 86.21, 9.57 and 2.33%. The characters, 100-pod weight had the highest contribution followed by branch length, plant height and 100-kernel weight (Fig. 2). [16,19,9] .
Keys for identification
The keys for identification of mutants and check cultivars based on the vegetative and reproductive structures are shown in Table 5 following Gibbons et al. (1972) [6] . The highest number of mutant genotypes was placed in the intermediate scales in any of the key identifying traits, whilst only few in the highest and lowest scale extremes. The latter extremes are actually very important keys in distinguishing the genotypes.
| Identifying characters | — | Name of genotypes |
|---|---|---|
| Vegetative characters | ||
| I | a. Plant tall (≥ 50 cm) | D1/62-30, D1/43-17, D1/11-60, Zhingabadam |
| b. Plant distinctly short (≤ 26 cm) | M6/64-82, M6/57-15 | |
| II | a. Primary branch distinctly long (77.3 cm) | D1/24-29 |
Table text extracted from the original PDF; superscript letters are shown inline. The original table image is below.
View original table image
References
20 in the original paper- Ashri A, Levy A. Spontaneous and induced Plasmon mutants in higher plant, Arachis hypogaea L. Genetica Agraria Monog. 1979; 4:71-76.
- Bayor TB, Dzomeku IK, Avornyo VK, OpokuAgyeman MO. Morphological variation in Kersting's groundnut landraces from northern Ghana. Agric. Biol. J North America. 2010; 1:290-295.
- Chandran K, Padya SM. Morphological characterization of Arachis species of section Arachis. Plant Genet. Resour. Newsl. 2000; 121:38-41.
- Doku EV, Asiama O. A classification of Bambara groundnut cultivars based on variation in morphological characteristics. In: Proceedings of the First National Symposium on crop improvement in Ghana. Held at the Univ. Ghana, Legon, Accra on 22-24 August. Doku EV. (Ed.), CSIR, 1978, pp. 19-27.
- Food and Agriculture Organization of the United Nations (FAO), FAOSTAT database. http://www.FAO.ORG.2016
- Gibbons RW, Bunting AH, Smart J. The classification of varieties of groundnut. Euphytica. 1972; 21:78-85.
- Lara-Fioreze ACC, Tomaz CA, Fioreze SL, Pilon C, Zanotto MD. Genetic diversity among progenies of Crambe abyssinica Hochst for seed traits. Ind. Crops Prod. 2013; 42:771-775.
- Latif MA, Rafii YM, Rahman MM, Talukdar MB. Microsatellite and minisatellite markers based DNA fingerprinting and genetic diversity of blast and ufra resistant rice genotypes. Comptes Rendus Biol. 2011; 334:282-289.
- Latif MA, Rahman MM, Ali ME, Ashkani S, Rafii MY. Inheritance studies of SSR and ISSR molecular markers and phylogenetic relationship of rice genotypes resistant to tungro virus. Comptes Rendus Biol. 2013; 336:125-133.
- Mondal MMA, Puteh AB. Effect of source of nitrogen on nitrate reductase activity and biomass productivity in peanut mutant. Res. Crops. 2013; 14:507-510.
- Mouli C, Patil SH. Gamma-ray induced mutant with suppressed branches in peanut. J Hered. 1976; 67:322324.
- Ntundu WH, Shillah SA, Marandu WYF, Christiansen JL. Morphological diversity of Bambara groundnut [Vigna subterranean (L.) Verdc.] landraces in Tanzania. Genet. Resour. Crop Evol. 2006; 53:367-378.
- Pasquet RS, Schwedes S, Gepts P. Isozyme diversity in Bambara groundnut. Crop Sci. 1999; 39:1228-1236.
- Patil SH, Mouli C. X-ray induced asynaptic mutant in groundnut. Indian J Exp. Biol. 1977; 15:521-523.
- Patil SH. Induced mutations for improving quantitative characters of groundnut. Indian J Genet. Plant Breed. 1972; 32:451-459.
- Rafii MY, Shabanimofrad M, Puteri Edaroyati MW, Latif MA. Analysis of the genetic diversity of physic nut, Jatropha curcas L accessions using RAPD markers. Mol. Biol. Report. 2012; 39:6505-6511.
- Rohlf F. NTSYS-pc: Numerical Taxonomy System, version 21. Exeter Publishing Ltd., Setauket, NY, USA, 2002.
- Russell DF. MSTAT-C Pakage Programme. Crop and Soil Science Department, Michigan University, USA, 1986.
- Upadhyaya HD. Phenotypic diversity in groundnut core collection assessed by morphological and agronomical evaluations. Genet. Resour. Crop Evol. 2003; 50:539550.
- Zivkovic B, Radovic J, Sokolovic D, Siler B, Banjanac T, Strbanovic R. Assessment of genetic diversity among alfalfa genotypes by morphometry, seed storage proteins and RAPD analysis. Ind. Crops Prod. 2012; 40:285-291.
Cited by 1
From OpenAlex, OpenCitations and reference lists read by Scinovex
- Yield performance of radiation induced rapeseed mutants at M8 generation ↗
Md. Saikat Hossain Bhuiyan, Md. Abdul Malek, Reza Mohammad Emon, Mst. Khadija Khatun · World Journal of Biology and Biotechnology · 2021
Rapeseed is the most potential oil seed crops of Indian sub-continent. So higher seed yield potential variety is central choice of rapeseed grower. To verify the yield performances of rapeseed mutants an experiment was conducted at various locations of Bangladesh. Four true breeding (homozygous) mutants obtain from three different radiation doses (600, 800 and 900 Gy) along with the mother…
❝ 1PDF