
Research article · 2021 · Full text
International Journal of Research in AgronomySoil erosion estimation using remote sensing techniques in the shirvan plain of the republic of Azerbaijan
Volume 4(1) · Pages 94–100 · DOI: 10.33545/2618060x.2021.v4.i1a.126 ↗
Research areasSoil and Environmental StudiesSoil erosion and sediment transportSoil and Land Suitability Analysis
Abstract
Author-writtenSoil erosion is one of the major environmental problems in terms of soil degradation in the Shirvan plain of the Republic of Azerbaijan. Soil erosion leads to significant on- and off-site impacts such as significant decrease in the productive capacity of the land and sedimentation. The key aspects influencing the quantity of soil erosion mainly rely on the vegetation cover, topography, soil type, and climate. This research studies the quantification of soil erosion under different levels of data availability in the Shirvan plain. Remote Sensing (RS) and Geographic Information Systems (GIS) techniques have been implemented for the assessment of the data, applying the Revised Universal Soil Loss Equation (RUSLE) for the calculation of the risk of erosion. Thirty soil samples were randomly selected for the calculation of the credibility factor, based on calculating the ݐ¾-factor values derived from soil property surfaces after interpolating soil sampling points. Soil erosion risk map was reclassified into five erosion risk classes and 25.3% of the Shirvan plain is under severe risk (190,740 ha). GIS and RS proved to be powerful instruments for mapping soil erosion risk, providing sufficient tools for the analytical part of this research. The mapping results certified the role of RUSLE as a decision support tool.
Summary
Source-checkedPlain-language reading of the full paper, prepared with AI and checked against the text. Each point links to the authors' own words.
Why it matters
- Soil erosion is a primary environmental issue causing soil degradation in Azerbaijan's Shirvan plain. View evidence ↗
- The impacts of soil erosion include sedimentation and a significant reduction in the land's productive capacity. View evidence ↗
- The amount of soil erosion is primarily influenced by climate, soil type, topography, and vegetation cover. View evidence ↗
The question
- The study aims to quantify soil erosion in the Shirvan plain, Azerbaijan's main agricultural zone, by examining the soil erodibility (K-factor) using the Revised Universal Soil Loss Equation (RUSLE) model. View evidence ↗
What they did
- The researchers used Remote Sensing (RS) and Geographic Information Systems (GIS) to apply the RUSLE model for calculating erosion risk. View evidence ↗
- Thirty randomly selected soil samples were used to calculate K-factor values, which were then interpolated to create soil property surfaces. View evidence ↗
- The study utilized 30 m resolution Digital Elevation Model (DEM) data and Landsat 8 Operational Land Imager (OLI) imagery from 2019. View evidence ↗
- The methodology involved calculating the R (rainfall erosivity), K (soil erodibility), LS (slope length and steepness), C (vegetation cover), and P (erosion control) factors. View evidence ↗
What they found
- After reclassifying the erosion risk map into five classes, it was found that 25.3% of the Shirvan plain (190,740 ha) is under severe risk. View evidence ↗
- Analysis of the basin area showed that 26.5% of the area is under slight risk, while 19.3% is under severe risk. View evidence ↗
- The soil erosion map generated using Radial Basis Functions (RBF) interpolation for K-factor values achieved an R² of 0.89. View evidence ↗
- The regression relationship between average annual precipitation, elevation, and the rainfall erosivity index had an R² of 0.667. View evidence ↗
- The K-factor was determined to have an acceptable level of accuracy, with a standard error of estimate of 0.005 t ha hr./ha MJ mm. View evidence ↗
What it means
- The authors conclude that GIS and Remote Sensing are powerful tools for mapping erosion risk and that the RUSLE model serves as an effective decision support tool. View evidence ↗
- The authors state that a denser grid of soil sampling sites would improve the K-layer interpolation, though it would increase costs and time. View evidence ↗
Visual summary
1 visualsIllustrations explain the paper; they do not show study data.
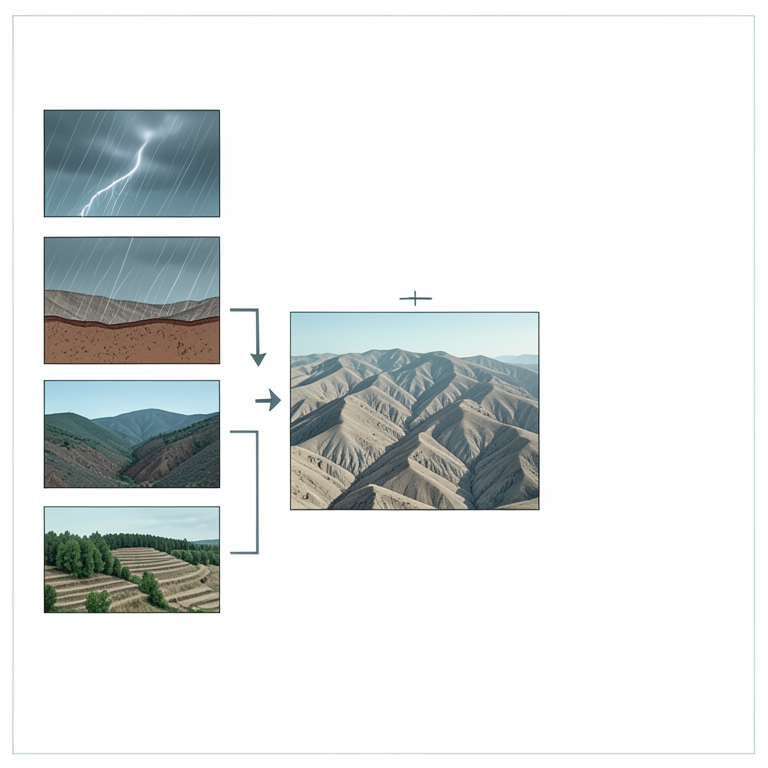
RUSLE Model Components
AI-generated conceptual illustration (The Shirvan plain landscape of Azerbaijan). It explains the idea and does not show study data.
View source evidence ↗Figures & tables
From the original paper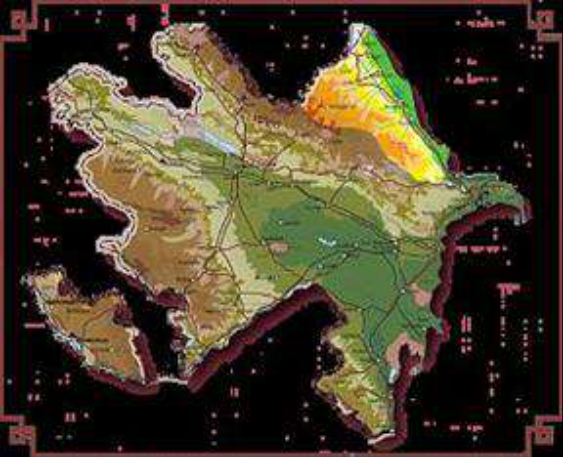 Figure 1
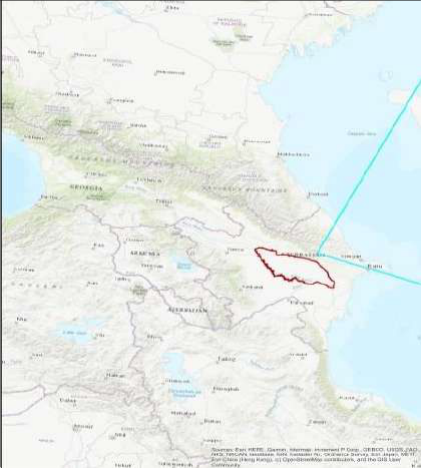 Figure 2
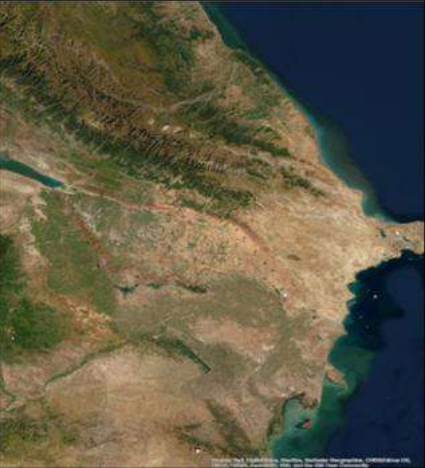 Figure 2
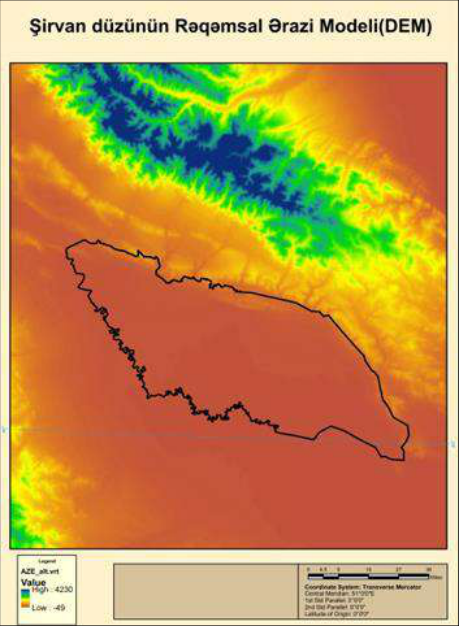 Figure 3
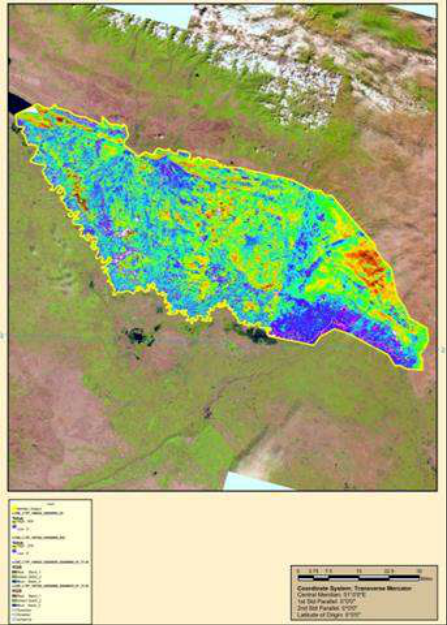 Figure 2
 Table 1
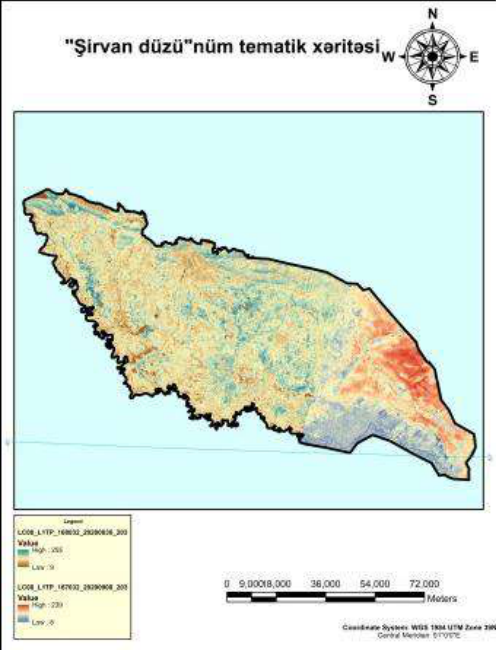 Figure 4
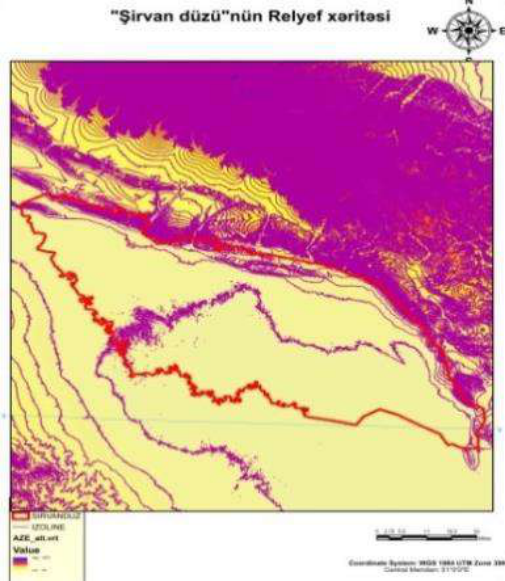 Figure 5
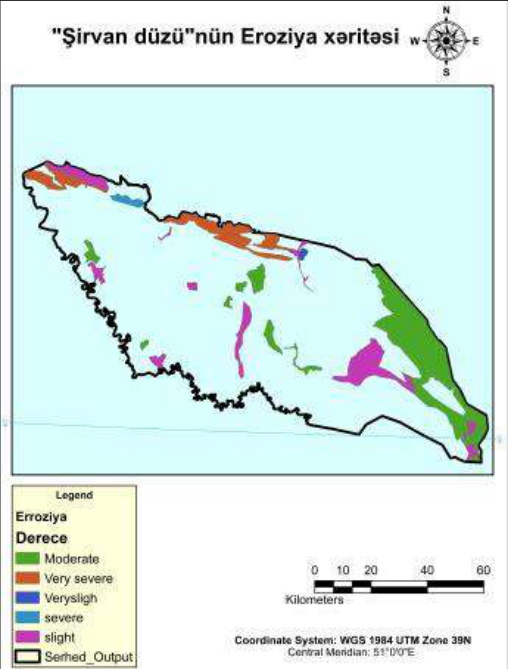 Figure 6
Introduction Fig 1:
show the soil erosion risks is a difficult under taking task due to several concurrent processes Evaluating soil erosion risks is a difficult under taking task due to several concurrent processes, which affects individually other multifaceted interactions and continues at amounts that vary in both time and space [2] . Soil erosion is caused by the erosive forces of wind or water.
In this publication, we focus our attention on concepts surrounding water-induced soil erosion. This type of erosion threatens our ability as humans to sustain our global population with food and fiber, and is closely linked to economic vitality, environmental quality, and human health concerns. Roughly 75 billion tons of fertile topsoil is lost worldwide from agricultural systems every year. Erosion in the Republic of Azerbaijan the total area of affected lands was 3144.7 thousand hectares, which is 36.4 % of the country's territory. 38.8 % (1220.1 ha) of eroded lands of the republic are weak, 29.4 % (924 ha) are medium, 31.8 % (1000.6 ha) was severely eroded. According to researchers, in the watershed and transit areas of river basins located in mountainous areas 70-80 % of the soil cover is eroded under complex geomorphological conditions [1] . Soil erosion occurs when parts of the soil are shifted around due to rainfall, wind, and ice melt. This is a natural process, but human activity can speed it up. The best way to combat soil erosion? Preventing it in the first place. Luckily, there are some additional methods that can also help you reverse the impacts of soil attrition [8] .
With the presence of GIS competencies, the efforts have been directed to be based on spatially distributed models simulating erosion dynamics and surface runoff of more complex and larger catchments [14,10] [11,12] . They also can be characterized as dynamic when the time is a contained parameter. Long-term models are based on accumulated temporal data while event-based models describe single events [13,10] . The soil erosion estimation models are focused on the identification and quantification of the erosion processes and the controlling factors, resulting in the sequential erosion models development beginning with the universal erosion equation (USLE) realized by Wischmeier and Smith [15] , followed by a modified equation (MUSLE) for the quantification of the alluvium resulting from erosion following each rainfall realized by Williams [16], and eventually computerized and more complex equation (RUSLE) developed by Renard et al. [17] .
The most important climatic variable in soil erosion processes is rainfall erosivity, which is related to rainfall amount and rainfall intensity [18,19] . Plants vegetative cover in addition to crop residues reduces soil erosion potential, due to the fact that the vegetation cover protects and leads to slowing down surface runoff movement and enhancing surplus surface water infiltration [20][21] . Type, extent, and quantity of the vegetation cover are the limiting factors of soil erosion effectiveness [22,23] .
The main aim of this research is to quantify the soil erosion in the Shirvan plain, which is the main agricultural zone in the Republic of Azerbaijan through examining the soil erodibility K-factor under different levels of soil data availability using the RUSLE model. Winds blowing in the Shirvan plain are formed under the influence of local conditions and incoming air masses. These winds often change direction due to the change of seasons [3] . The rivers entering the Shirvan plain are of transit nature. These rivers belong to the Kura basin and start from the altitude of 2000-3500 m on the southern slope of the Main Caucasus Range. Alijanchay, Turyanchay, Goychay and Girdimanchay are divided into a number of branches after rising from the lowlands to the Shirvan plain. Garasu Rivers are formed from the water that flows underground from the surface of the supply cones and rises to the surface in the form of boils in the outer parts. The Turyanchay River begins at the foot of the Bazarduzu and Tufan peaks of the Main Caucasus Range, at an absolute height of 3,680 m, and flows into the Kura at a height of 3.5 m, west of the city of Zardab.
Materials and Methods
In the upper reaches, the catchment area of the Turyanchay is 1,842 km2, water consumption is 15.6 m³ / sec, and the annual flow is 491,000 m3.The Goychay River began at an altitude of 2,500-3,000 m at the foot of the Savalan Pass and Babadag Peak and flowed into the Garasu at an absolute height of 9 m. In connection with the subsequent reclamation measures, it was connected directly to the globe. The catchment area is 1770 km2, the average annual water consumption is 12.5 m³ / sec. The length of the river is 50-60 km. Girdimanchay flowed into Garasu at an altitude of 9 m, starting from 3000 m at the foot of Babadag Peak. Later, it was discharged into the Kura River through an artificial bed. The catchment area is 232 km2, water consumption is 2.34 km3 / sec. The length of the Shirvan plain is about 25.2 km. The density of the general river network of the Shirvan plain is 0.46-0.5 ka / km2. The flow in the rivers of the Shirvan plain is uneven throughout the year.In addition to the rivers with a constant flow mentioned above, there are many dry valleys and ravines of different lengths, starting from the low mountains and having a temporary flow during heavy rains.The largest lake in the Shirvan plain is Hajigabul [3] .
Water is discharged from the Kura River to keep the water level stable in the lake, which has an area of about 16 km2. The lake is currently drying up. The dry, arid climate of the Shirvan plain requires maximum use of irrigation. The Upper Shirvan canal, which starts from the Mingachevir reservoir and stretches for 123 km, allows to irrigate more than 47,000 hectares. The Shirvan plain rivers have rich groundwater resources.
Groundwater. The food source of groundwater is rainwater, river water and irrigation leaks. The groundwater level in the 5-6 km wide strip along the Kura River is 1 m deep, and in the Goychay ground cone it is 1.5-2 m. The flow of groundwater in the Shirvan plain was very weak, mainly due to the general inclination of the plain. Mud volcanoes in the lowlands are also relatively affected by the mineralization of groundwater in the eastern part of the Shirvan plain [2] . Soil erosion from irrigated fields has been discussed previously (7, 8); this article focuses on unique aspects of irrigationinduced soil erosion that are important when managing and simulating soil erosion on irrigated lands. Soil erosion mechanics can be divided into three components: detachment, transport, and deposition. Water droplets and flowing water detach soil particles; flowing water then transports these detached particles downstream; deposition occurs when flowing water can no longer transport the soil particles because flow rate decreases as water infiltrates or as rill slope or roughness changes. Some particles are deposited within a few meters although others are transported off the field with runoff water. These mechanisms are the same for surface irrigation, sprinkler irrigation and rainfall; however, there are some systematic differences between irrigation and rainfall erosion and especially between surface irrigation and rainfall. Erosion rates as high as 145 Mg/ha in 1 h ( 9) and 40 Mg/ha in 30 min (10) were reported in some early surface irrigation erosion studies. These extreme losses do not represent a sustained seasonal rate. Withinfield erosion rates on the upper quarter of a furrow irrigated field can be 10-30 times more than the field average erosion rate (12). Some soil eroded from the upper end of a field is deposited on the lower end, whereas some soil leaves the field with runoff.
Losing topsoil from the upper end of the field can decrease crop yields by 25 % when compared with the lower end of the field (13).
Sediment cannot be transported without runoff. Runoff is planned with many surface irrigation schemes in order to irrigate all areas of the field adequately [25] .
Methodological Framework
The methodology is implemented through several steps which led to the intermediate and the final results. Initially, the 𝐶, 𝑅, 𝑃, and LS factors were calculated in order to be included in the RUSLE formula.
Then, the 𝐾-factor was estimated from the soil samples using the USDA nomograph [23] . Later, three interpolation methods (Radial Basis Functions (RBF), Inverse Distance Weighted (IDW), and Ordinary Kriging (OK)) were checked for their accuracy and the 𝐾-factor layer (thematic map) was created using the most accurate method. By multiplying the RUSLE factors calculated earlier (𝐶 * 𝑅 * 𝑃 * LS) with the 𝑘-layers (thematic map), soil erosion risk thematic map was created. Finally, the erosion risk map was reclassified into five classes of risk.
The mathematical expression of RUSLE is:
Where 𝐴 is the average annual erosion rate (t ha-1 yr-1); 𝑅 is the rainfall erosivity (MJ mm ha-1 h-1 yr-1); 𝐾 is the soil erodibility (t ha h ha-1 MJ-1 mm-1); LS is slope length and slope steepness factor (dimensionless);
𝐶 is the correction coefficient for the effect of vegetation (dimensionless); and 𝑃 is the correction coefficient for the effect of erosion control measurements (dimensionless). Digital Elevation Model (DEM) data were used DEM is highly accurate DEM covering all the land on earth with 30 m spatial resolution. Landsat 8 Operational Land Imager (OLI) scene was acquired in, 2019. Landsat 8 consists of 9 multispectral bands of 30 m spatial resolution and two thermal bands of 100 m spatial resolution in addition to the panchromatic bands of 15 m spatial resolution.
Two Full-Width-Half-Maximum (FWHM) bands of 654.6 𝜇m as red band and 864.7 𝜇m as infrared band were exercised to drive. Normalized Difference Vegetation Index (NDVI). Generation of R, K-, LS, C, and P Factors. Rainfall erosivity factor (R), estimation of the rainfall erosivity factor (𝑅), is highly based on annual rainfall (mm), and when the annual rainfall is high, erosivity (𝑅) is also high. Rainfall erosivity factor (𝑅) was estimated based on total kinetic energy (𝐸) and maximum intensity in 30 minutes (𝐼) in an average year's rain. Barfield et al. [25] .
According to Wischmeier [27] , the best predictor of 𝑅 was
Where, is the total storm kinetic energy, 𝐼30 is the maximum 30-minute rainfall intensity, 𝑗 is the counter for each year used to produce the average, 𝑘 is the counter for the number of storms in a year, 𝑚 is the number of storms 𝑛 each year, and 𝑛 is the number of years used to obtain the average 𝑅 rain kinetic energy (𝐸) could be predicted by 𝐸 = 916 + (331)log 10 (𝐼).
𝐾-factor (soil erodibility) is the one that will be mainly examined.
Using the stratified random sampling method, thirty points, randomly selected and stratified in regard to the geologic formations, were sampled for their necessary topsoil properties.
Then, 𝐾 values were calculated according to the RUSLE formula for these methods [24] . Finally, the 𝐾 values were interpolated to produce a surface of 𝐾 values for the total area. Not only is soil texture the principal component affecting 𝐾, but also soil permeability and soil organic content are essential [26] . Proposed an algebraic approximation taking into consideration five different soil features (soil organic content, soil permeability, soil texture, soil structure, and soil coarse fragments) as follows:
Where 𝑀 is the textural factor with 𝑀=(𝑚silt+𝑚vfs) * (100-𝑚c); 𝑚c [%] is clay fraction content (<0.002mm); 𝑚silt [%] is silt fraction content (0.002-0.05mm); 𝑚vfs [%] is very fine sand fraction content (0.05-0.1mm); OM %] is the organic matter content; 𝑠 is the soil structure; And 𝑝 is the permeability class. The slope factor (LS) refers to the topographic and/or the relief factor. The slope length factor L computes the effect of slope length on erosion and the slope steepness factor S computes the effect of slope steepness on erosion. The topography related parameters were derived from the Digital Elevation Model (DEM) [27] .
Based on Wischmeier and Smith [15] , LS values were estimated as follows:
Where, ℓ is the cumulative slope length in feet; Is the downhill slope angle? 𝑚, is a slope contingent variable, 0.5 If the slope angle is greater than 1.86∘, 0.4, on slopes of 1.72∘ to 2.86∘, 0.3, on slopes of 0.57∘ to1.52∘, And 0.2, on slopes less than 0.51∘.
The cover management factor (C) is dimensionless for each grid cell ranging from 0 to 1 under standard fallow conditions. As the surface cover is added to the soil, the 𝐶 factor value approaches zero. Generally, the 𝐶 factor is calculated based on derivation of Normalized Difference Vegetation Index (NDVI) and then reclassification of NDVI in order to extract the 𝐶 factor with higher positive values of NDVI. Red band and infrared band of Landsat 8 were exercised to estimate NDVI as follows:
Where 𝐼𝑅 is the infrared band and 𝑅 is the red band.
The support practice factor (P) is defined as the ratio of soil loss with a specific support practice to the corresponding soil loss with up and down cultivation. The lower the 𝑃 value is, the more effective the conservation practice is deemed to be in reducing soil erosion. Usually, in practice, expert opinion is used to qualitatively assess this factor. Integration of Factors for Erosion Risk Mapping. The erosion risk maps were generated by integrating all predestinated factors according to the RUSLE to create erosion map using 𝐾-factor values derived from soil sampling with interpolation. This was done using map algebra following the RUSLE method, where all layers generated previously were multiplied under GIS environment [15] .
Results and Discussion
In order to assess the soil erosion risks in the study area, several applications and analyses were implemented. Each generated factor was thus fully described and processed. Regression was found between the mean annual precipitation 2010-2020 (mm/year) and the elevation to be read as:
The regression relationship was established before estimating the rainfall erosivity index as a function of average annual precipitation and elevation with R2 of 0.667. The final thematic map for rainfall erosivity factor is shown in Figure 2. The standard error of estimate between the point and the surface 𝐾factor is 0.005 t ha hr./ha MJ mm; 𝐾-factor is with an acceptable level of accuracy [29] . Thematic map for the soil erodibility factor is shown in Figure 3.
To determine LS factor adjusted by Moore and Burch [27][28][29][30] under GIS environment, the slope and flow length for each grid cell were estimated and illustrated in Figure 4.
The effectiveness of the plant cover in reducing the raindrop impact depends on the height and the continuity of the canopy and the density of the ground cover.
In this study, the 𝐶 factor was calculated using sigmoidal function derivation of Normalized Difference Vegetation Index (NDVI) to extract the 𝐶 factor. The derivation of the NDVI values follows a monotonically decreasing sigmoid function with two control inflection points (0 and 1) which was used in order to define the fuzzy value of 𝐶 factor as illustrated in. However, reclassification of the NDVI values was done in order to assign small values (nearzero) for the 𝐶 factor for vegetated areas which are lessrisky in terms of erosion potential and big values (close to one) than sparsely vegetated areas and bare ground, which are more prone to erosion as it is shown in Figure 5.
Standard normal distribution function practiced on the NDVI values indicated that most of the values are around zero value as demonstrated in Figure 6. Several negative values were reordered but there were more positive values indicating higher organic content [31] . The erosion risk map was generated by integrating all predestinated factors according to the RUSLE equation to create soil erosion map using 𝐾-factor values derived from soil sampling with interpolation of RBF with 𝑅2 of 0.89. Erosion is observed in the high hills of the Shirvan plain, along natural and artificial watersheds, in areas with dense drainage. In addition, the stream network carves its course and it carries the sediment that erodes as it flows. This gives it more power to erode as there is more friction in the moving water, but it also deposits this material when it flows out of the upper stream onto the lower stream [32] . Figure 10 (which is not shown conventionally) demonstrates the proportion of each erosion risk class to the total basin area of Shirvan plain. Some of the total area is under slight risk (26.5 %). On the other hand, considerable areas are under severe risk (19.3 %) and need further attention. 4. Conclusion Erosion risk values are ranked into classes, which is in accordance with RUSLE standards as it provides better identification of the area most prone to erosion. The dissimilarities discovered earlier seem to fade out. GIS and Remote Sensing are inevitable technological environments when implementing RUSLE for assessing soil erosion risk in the spatial domain. The adopted approach was based on mapping procedures, such as conversion of categorical into numerical polygons, interpolation of point samples, map algebra, and raster map reclassification. Data quality is a crucial parameter in soil erosion modeling and those errors and uncertainties are propagated to the final erosion results. Denser grid of sampling sites for the soil survey approach would produce a better 𝑘 layer after interpolation although such a procedure is costly and time-consuming.
Conclusion
Erosion risk values are ranked into classes, which is in accordance with RUSLE standards as it provides better identification of the area most prone to erosion. GIS and Remote Sensing are inevitable technological environments when implementing RUSLE for assessing soil erosion risk in the spatial domain. The adopted approach was based on mapping procedures, such as conversion of categorical into numerical polygons, interpolation of point samples, map algebra, and raster map reclassification. Data quality is a crucial parameter in soil erosion modeling and those errors and uncertainty esare propagated to the final erosion results. Denser grid of sampling sites for the soil survey approach would produce a better 𝑘 layer after interpolation although such a procedure is costly and timeconsuming.
Figures and tables from the paper
| 1 | Erosion class | ERC 1 | ERC 2 | ERC 3 | ERC 4 | ERC 5 |
|---|---|---|---|---|---|---|
| 2 | Losst/ha/yea | 0-5 | 5-10 | 10-20 | 20-40 | >40 |
| 3 | Classification | VeriSign | slight | Moderate | Severe | Very severe |
Table text extracted from the original PDF; superscript letters are shown inline. The original table image is below.
View original table image
References
23 in the original paper- Soviet Encyclopedia of Azerbaijan. Kuba-Misir. Ch. ed. D. Guliyev. Baku. 1982;1-10(6):47-48.
- C Valentin, J Poesen, Y Li. "Gullyerosion: impacts, factors and control" Catena. 2005;63(2-3):132-153.
- J Wainwright, AJ Parsons, AD Abrahams. "Plot-scale studies of vegetation, overland flow and erosion interactions: case studies from Arizona and New Mexico," Hydrological Processes. 2000 Nov;14(16-17):2921-2943.
- M Kumar, Hazarika K, Honda. "Estimates of soil erosion using Remote and GİS, its valuation and Economic İmplications on Agricultural production. 2001;2:3-4.
- EG Gregorich, KJ Greer, DW Anderson, BC Liang. "Carbon distribution and losses: erosion and deposition effects," Soil Tillage Research. 1998 Jul 6;47(3-4):291-302.
- CJ Williams, FB Pierson, PR Robichaud, J Boll. "Hydrologic and erosion responses to wildfire along the rangeland-xeric forest continuum in the western US: are view and model of hydrologic vulnerability" International Journal of Wild land Fire. 2014 Feb 6;23(2):155-172.
- MVK Sivakumar. "Interactions between climate and desertification" Agricultural and Forest Meteorology. 2007 Feb 12;142(2-4):143-155.
- IZ Gitas, K Douros, C Minakou, GN Silleos, CG Karydas. "Multi-temporal soil erosion risk assessment in N. Chalkidiki using a modified USLE raster model," EARSEL Proceedings. 2009 Jan;8(1):40-52.
- P Podwojewski, JL Janeau, S Grellier, C Valentin, S Lorentz, V Chaplot. "Influence of grass soil cover on water runoff and soil detachment under rainfall simulation in asub-humid South African degrade drangeland" Earth Surface Processes and Landforms. 2011 Jun 15;36(7):911922.
- S Grellier, J Kemp, JL Janeau, et al. "The indirect impact of encroaching gtreesongully extension: Year study Nasubhumid Grassland of South Africa" Catena. 2012 Nov 1;98:110-119.
- K Renard, GR Foster, GA Weesies, JP Porter. "Rusle revised universal soil loss equation," Journal of Soil and Water Conservation. 1991;46:30-33.
- E Bochet, P Garcıa-Fayos. "Factors controlling vegetation establishment and water erosion on motor wayslopesin Valencia, Spain" Restoration Ecology. 2004 Jun;12(2):166174.
- VHD Zuazo, CRR Pleguezuelo. "Soil-erosion and runoff prevention by plant covers review," Agronomy for Sustainable Development. 2008;28(1):65-86.
- VHD Zuazo, JRF Martınez, CRR Pleguezuelo, AM Raya, B CRodrıguez. "Soil-erosion and runoff prevention by plant cover sin mountain outspread (SES pain): Implications for sustainable agriculture" Environmentalist. 2006 Dec;26(4):309-319.
- A Psilovikos, M Elhag. "Forecasting of remotely sensed daily evapo transpiration data over nile Delta region, Egypt" Water Resources Management. 2013 Sep;27(12):41154130.
- VM Castillo, M Martinez-Mena, J Albaladejo. "Runoff and soil loss response to vegetation removal in a semiarid environment" Soil Science Society of America Journal. 1997 Jul;61(4):1116-1121.
- VH Duran Zuazo, JRF Martınez, CRR Pleguezuelo, A Martınez Raya, BC Rodrıguez. "Soil-erosion and runoff prevention by plant covers in a mountainous area (SE Spain): Implications for sustainable agriculture" Environmentalist. 2006 Dec;26(4):309-319.
- GR Renard, GA Foster, DK Weessies. "McCool predicting soiled rosin by water: Aguideto conservation planning with the Revised Universal Soil Loss Equation (RUSLE)," in Agriculture Handbook, DC Yoder, Ed., US Department of Agriculture, Washington, DC,USA. 1997;703:703.
- W Drzewiecki, P Wezyk, M Pierzchalski, B Szafra´Nska. "Quantitative and qualitative assessment of soil erosion riskin Małopolska (Poland), supportedbyan object-based analysis of high-resolution satellite images," Pure and Applied Geophysics. 2014 Jun;171(6):867-895.
- ID Mooreand, GJ Burch. "Physical basis of the length-slope factoring the universal soil lose equation" Soil Science Society of Americaт Journal. 1986 Sep;50(5):1294-1298.
- ID Mooreand, GJ Burch. "Model ling erosion and deposition: Topographic effects" Transactions of the American Society of Agriculture Engineers. 1986 Dec;29(6):1624-1630.
- M Elhag. "Remotely sensed vegetation indices and spatial decision support system for better water consumption regime in Nile Delta. Acase study for rice cultivation suitability map" Life Science Journal. 2014;11(1):201-209.
- M Elhag. "Characterization of a typical Mediterranean watershed using remote sensing techniques and GIS tools", Hydrology: Current Research. 2015 Jan 1;6(1):197-204.