
Research article · 2021 · Full text
International Journal of Research in AgronomyGray-grass in the Shirvan plain effects of irrigation erosion on agrochemical indicators of land
Volume 4(1) · Pages 105–109 · DOI: 10.33545/2618060x.2021.v4.i1a.124 ↗
Research areasSecurity, Politics, and Digital Transformation
Abstract
Author-writtenThe article examines the actual state of water and land resources. The degree of suitability of the country's land fund for agricultural production is being studied (of course, the degree of their erosion, which greatly affects the quality and productivity of agricultural crops), recognizing that Azerbaijan is the largest country in the South Caucasus both in terms of population (8.8 million people) and area (8.66 million hectares), it ranks last in terms of water resources and second in terms of water resources. Is different. 40% of its territory is made up of plains and has an arid climate. It is also recognized that more than 20% of the country's territory was liberated from the occupation of the Armenian armed forces for 30 years, where military erosion has developed forcefully, which entails the oppression of the land fund requiring activity to their recovery.
Summary
Source-checkedPlain-language reading of the full paper, prepared with AI and checked against the text. Each point links to the authors' own words.
Why it matters
- Azerbaijan has an arid climate in 40% of its territory, characterized by low precipitation (200-300 mm) and high evaporation (1000-1200 mm). View evidence ↗
- Irrigation and land reclamation are essential in these arid regions to ensure stable and high agricultural yields. View evidence ↗
- Irrigation erosion has developed in Azerbaijan over a long period due to the improper application of irrigation methods and norms. View evidence ↗
The question
- The study aimed to examine the development of irrigation erosion under perennial pomegranate crops in the Shirvan plain between 2014 and 2016. View evidence ↗
- The research specifically focused on how different irrigation norms affect the fertility of gray-meadow soils. View evidence ↗
What they did
- Ten experimental sections were established in the Kurdamir district from 2014 to 2016 to analyze the agrochemical effects of irrigation on gray-meadow soils. View evidence ↗
- The study tested various irrigation water consumption rates, specifically 1 l/s, 1.5 l/s, and 2 l/s. View evidence ↗
- Soil analysis was conducted by examining samples across different genetic layers of the soil profile. View evidence ↗
What they found
- Improper irrigation led to a significant loss of nutrients in perennial soils, reducing humus to 0.26%, total nitrogen to 0.014%, phosphorus to 1.8%, and calcium to 6.5 mg eq. View evidence ↗
- Over two years, higher irrigation rates increased the leaching of nutrients at the end of the canopy: 1 l/s caused a loss of 0.14% humus and 0.020% nitrogen, while 2 l/s caused a loss of 0.31% humus and 0.042% nitrogen. View evidence ↗
- Phosphorus levels in the top layer varied by section location and rate, ranging from 11.7% (section 5) to 14.0% (section 4). View evidence ↗
- The highest dry residue concentration (0.640%) was found in the surface layer (0-12 cm) of section 6, located at the head of the site. View evidence ↗
- Humus levels at the end of the ridges increased with the irrigation rate: 2.81% at 1 l/s, 2.89% at 1.5 l/s, and 2.92% at 2.0 l/s. View evidence ↗
What it means
- The authors conclude that failure to follow water consumption norms leads to irrigation erosion in the Shirvan plain, which washes away organic and inorganic compounds and reduces soil fertility. View evidence ↗
- The authors recommend an irrigation rate of 1 l/s for production, as it resulted in the minimum leaching of nutrients (0.14% total and 0.020% nitrogen) over two years. View evidence ↗
Visual summary
2 visualsIllustrations explain the paper; charts are replotted from the paper's own table values.
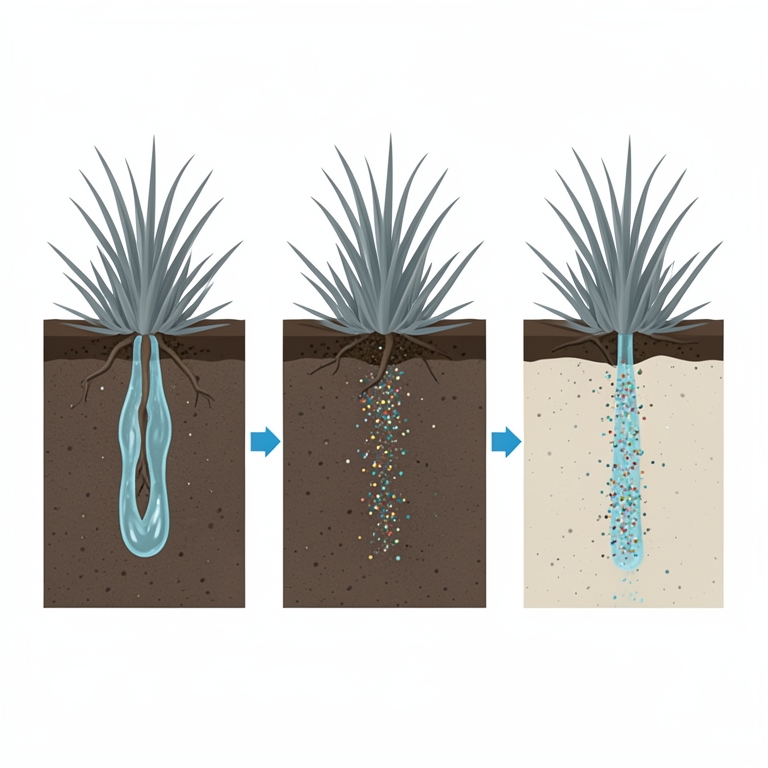
Effect of Irrigation Rate on Nutrient Leaching
AI-generated conceptual illustration (Gray-grass plants in a soil profile of the Shirvan plain). It explains the idea and does not show study data.
View source evidence ↗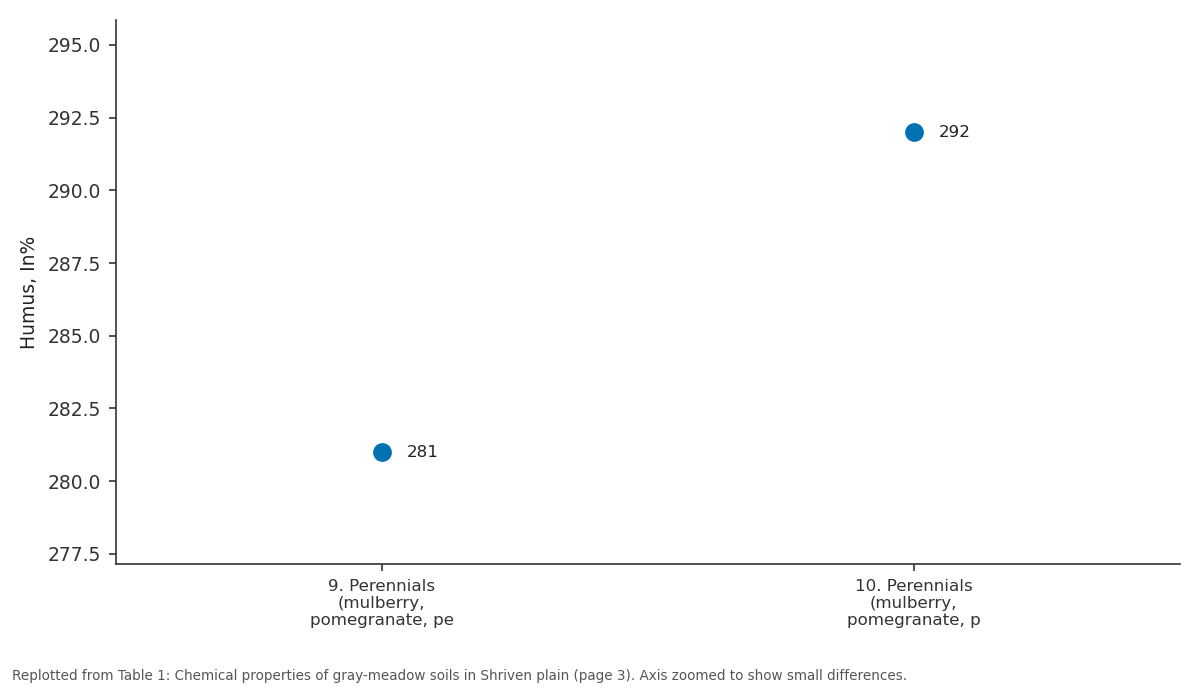
Humus, In%: 9. Perennials... vs 10. Perennials...
Replotted from Table 1 (page 3) of the original paper. Every bar is the paper's own table value.
View source evidence ↗Figures & tables
From the original paper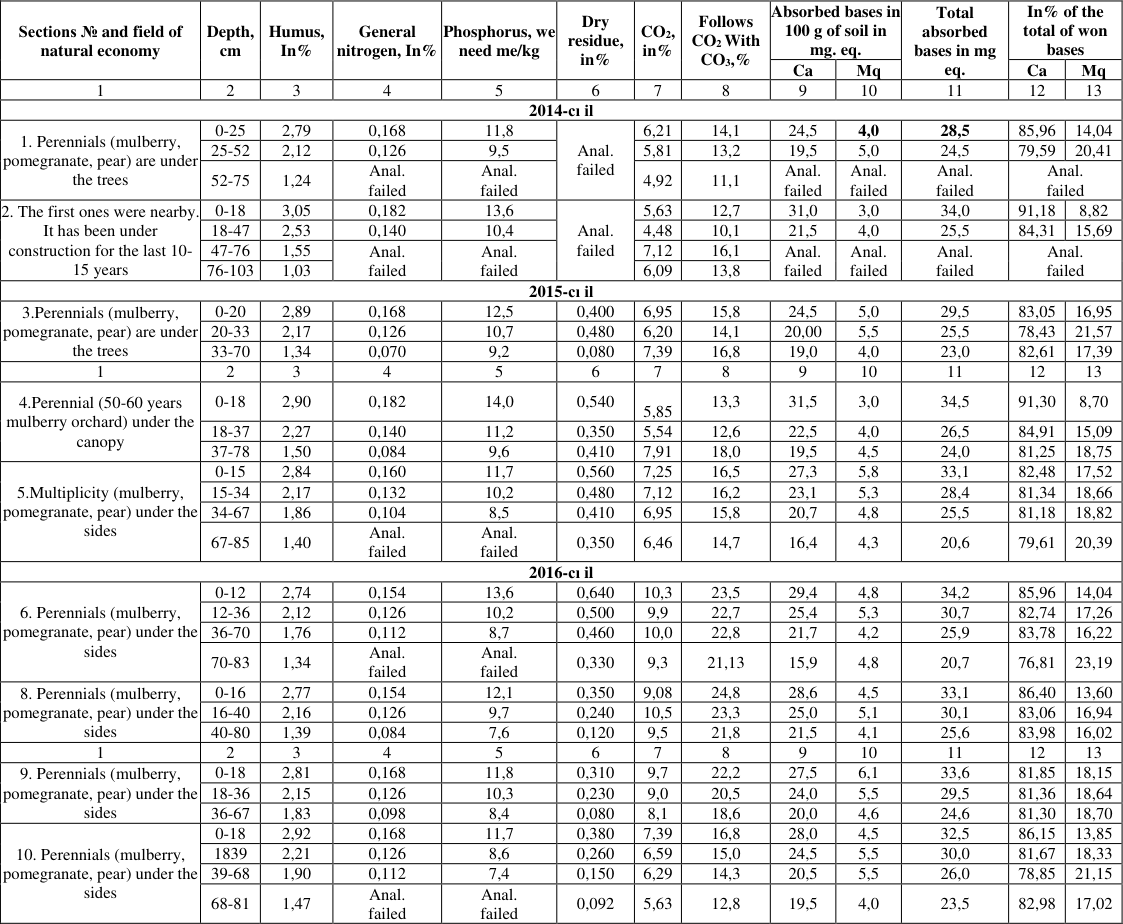 Table 1
Introduction
While Azerbaijan is the largest country in the South Caucasus in terms of both population (8.8 million people) and area (8.66 million hectares), it ranks last in terms of water resources and is the second largest in terms of water resources. Differs. 40% of its territory consists of the plains and has an arid climate. Areas with this climate differ sharply from other zones with their warm climate, low atmospheric sediments (200-300 mm) and high surface evaporation (1000-1200 mm). In order to produce high and stable agricultural yields from such fields, it is necessary to carry out irrigation and land reclamation works in these areas and increase their efficiency. The total area of the country is 4.2 million. Checks [3] are approximate. About 3.2 million hectares of arable land are suitable for irrigation, of which 1.45 million hectares are arable land. The cheeks are irrigated. In ancient times, irrigation ditches and canals were built to irrigate the surrounding area. Especially in the nineteenth and twentieth centuries, more work began to be done in this direction. There were both positive and negative aspects of the case. Thus, the adjacent land plots are under the ditches, canals, reservoirs, drainage-collector networks, irrigation erosion is intensively developed as a result of the irrigation system, from the reservoirs to the irrigation canals and irrigation canals. Depending on the amount of precipitation in the South Caucasus, which has the lowest water reserves in Azerbaijan, the surface water resources vary between 23.8-30.0 km 3 . Only 10 km 3 or 30% of this reserve is formed on the territory of the republic, and the rest is formed on the territory of neighboring countries. Internal rivers are unevenly distributed throughout the country and the bulk of their flow falls in the spring. There is also a great need for the regulation of the flow of many rivers and the construction of reservoirs. It is possible to increase the total area of irrigated lands to 1,650,000 hectares at the expense of new reservoirs [3] . Thus, Azerbaijan will have 135 reservoirs with a capacity of 21.5 million m 3 in the 21 st century, 14 hydropower stations, 49,054 km of irrigation canals, 30,328 km of collector-drainage networks, 876 pumping stations, 109,888 different hydraulic structures, 10 different types of hydraulic structures [3] . to provide the territory of the republic with the necessary agricultural products through the proper and efficient use of the existing water management systems and facilities, to reduce the maximum level of water, to reduce the level of irrigation and to reduce the cost of irrigation.
Irrigation erosion in irrigated areas has been developed in Azerbaijan since ancient times as a result of proper application of irrigation norms and methods, and areas with poor erosion and irrigated erosion have been developed. The Shriven plain is one of the most physically and geographically developed areas from ancient times to the present. Here, too, irrigation erosion has developed as a result of poor adherence to irrigation standards, and no serious measures have been taken to prevent it. With this in mind, in 2014-2016, the development of irrigation erosion under perennial (pomegranate) deposits in the Shirvan plain was studied. Different irrigation rates (1 l/s, 1.5 l/s) have been tested to study irrigation erosion. We have only studied the effect of irrigation norms on the fertility of graymeadow soils. In general, the scientific study of irrigation erosion in Azerbaijan was started in the 1960s by the staff of the of İnstitute Erosion and Irrigation ANAS has been studied in the Nakhchivan Autonomous Republic [3,4] , in the Alazan-Jairichay valley [2,6,7] , in the Mil [8] and Mujan [9] valleys, and in the Absheron Peninsula [3] . Some of the organic and non-organic compounds in the soil are dissolved in irrigation water, which accumulates there in the subsoil, and another part is absorbed by the water, which is not able to penetrate the soil. Thus, irrigation erosion occurs in both horizontal and vertical directions. In order to study the agrochemical effects of irrigation on grass-meadow soils in the experimental area located in the territory of Kurdamir district, 10 sections were installed in 2014-2016. One of the plots was planted in the field and the other in a 50-60year-old mulberry orchard. 2-3 years old pomegranate orchard in you the pieces are placed at the beginning and end of the verses. Soil samples were analyzed by transferring them to the genetic layers. The results of the analyzes were found in Table 1. Two cuts were made in 2014. Section 1 was placed in the experimental field, and Section 2 was placed in the field. While the amount of humus in the upper layer of part 1 was 2.79%, in the upper layer of part 2 it was 3.05%. Thus, the amount of sand in the top layer of the section laid during the walk was 0.26% more than the top layer of the section laid in the pomegranate garden. The reason for this is the irrigation of the pomegranate orchard. However, there are some differences in the total nitrogen and phosphorus concentrations, which contain the necessary nutrients, in both the upper and lower energy layers. Thus, the amount of total nitrogen in the top layer of section 1 was 0.168%, while the amount of phosphorus was 11.8 me, while in section 2 these levels were 0.182% and 13.6 me/kg. The amount of total nitrogen and phosphorus in the top layer of section 2 is slightly higher than the volume of the same layer in section 1, and is 0.014% and 1.8%, respectively. The projections of the subfloor of section 2 were also higher than those of section 1. Thus, the amount of humus was 0.41%, total nitrogen was 0.024%, and phosphorus was 0.9%. The amount of humus in each of the 2 sections gradually decreases and is 1.24% at the end of the 1st section, and 1.03% at the end of the 2nd section. In section 1 of the pomegranate orchard, the amount of humus does not decrease sharply towards the six layers, and the thickness of the individual genetic layers differs little from each other. These hysteria also suggest the ancient irrigation of icemeadow soils in the experimental field. The amount of carbonates in these soils is slightly higher than in the adjacent strata of each 2 parts. Thus, while in the upper layer of section 1 it is 14.1%, and in section 2 it is 12.7%, in the subsoil of other sections it is 13.2% and 10.1%, respectively, relative to the close layer. Decreased (0.9% in election 1 and 2.6% in election 2). the amount of carbonates in the fraction gradually decreases towards the bottom layer and falls to the bottom layer at the end of the lateral elevation and reaches 11.1%. On the contrary, in section 2, the amount of carbonates in the near layer is much higher than in the near layer. On the third floor, the side will have a higher elevation (16.1%), and on the third floor it will have a roof of 13.8% less. The amount of carbonates is both near and below the bottom layer. The fact that the amount of carbonates in the lower layers of section 2 (47-103 cm) is higher than in the upper layers (0-18, 18-47 cm) is due to the high level of carbonate in the soil Calcium cation plays an important role in the formation of the structure in the soil. Calcium cation is predominant in the soil absorption complex. The amount of calcium cation in the half-meter layer of both sections was higher than in the adjacent layer and was 24.5 mg. eq. And (section 1) 31.0 mg. eq. (Part 2). Accordingly, these esters were significantly reduced in the near future to 19.5 mg. eq. And 21.5 mg. eq. is formed. Thus, the amount of cation absorbed by a piece placed in the ground is much higher than the amount of a piece laid under a multilayered side. This is due to the occurrence of irrigation erosion on the site as a result of noncompliance with water consumption norms during regular irrigation of pomegranate orchards. In 2015, 4 sections (sections 3, 4, 5 and 6) were installed in the experimental field. One of the sections (section 6) is placed at the beginning of the section, and the third section is placed at the end (sections 3, 4, 5). Irrigation in the fields was carried out at different water consumption rates (1 l/s, 1, 5 l/s, 2 l/s). In the experimental field, only the bottoms of the feet are softened, and the remaining areas are mowed once a year. The grass system of the fire shelter protects the soil. The fire dries up in the summer. Dry skies protect the soil from being washed away, albeit slightly. As a result of irrigation, the soil particles washed from the top of the furrows are buried at the end of the furrows. The necessary nutrients and chemical compounds in the topsoil are also washed away by the Naryn soil particles. This is confirmed by the results of the analysis. In 2015, the amount of humus in the top layer of section 6, which was placed at the head of the shrubs, was 2.74%, while the total nitrogen was 0.154%, in number 5 (1 l/sec.) 2.84% and 0.160%, in number 3 (1, 5 l/sec) was 2.89% and 0.168%, while 4 was 2.90% and 0.183%. Thus, the amount of washed humus and total nitrogen relative to the top layer of the section placed at the head of the ridge is 1 l/sec. 0.1% and 0.006% in water consumption (section 5), 0.15% and 0.014% in 1.5 l/s, 0.16% and 0.028% in 2 l/s (section 4) It's been a long time. It is clear from the analysis of the results of the chemical analysis of graygrass soils that, depending on the water consumption rate, the composition of both the main nutrient elements and the chemical compounds in the topsoil depends on the water content. Because phosphorus compounds are poorly soluble in water, it is not felt to be washed away. The amount of phosphorus in the top layer of the section placed at the head of the pile (section 6) was 13.6%, in the section No. 3 placed at the end of the pile was 12.5%, in section 4 14.0%, and in section 5 11.7%. The height of the section placed at the head of the test site (section 6) is 1.1% and 1.9% more than the sections of section 2 (sections 3 and 5) placed at the end of the plots, and 0.4% more, 4 parts. The amount of phosphorus in each section gradually decreases from the top layer to the bottom layer. The amount of dry residue is predominant in the top layer of the remaining sections, with the exception of section 3. Of the three sections, the highest elevation is at the top of section 6, placed at the head of the section, and is 0.640%. The lateral surface is on the top layer of section 3 and is 0.400%. In this section, the highest elevation is observed in the second layer (20-33 cm) (0.480%). In the Shriven plain, surface evaporation is also very high due to the extreme heat of the summer months. As a result, the amount of salt accumulated in the 0-40 cm sections of the salts in the upper rising groundwater through capillaries (varies between 0.350-0.640 percent). These soils are very weak and moderately saline. Among the sections placed on the test site, the highest elevation of the dry residue (0.640%) was observed on the surface (0-12 cm) of section 6 placed on the head of the site. The reason for the large amount of dry residue on the surface of this section is related to the more intensive washing at the head of the field. Due to the high rate of irrigation water at the beginning of irrigation, water cannot penetrate the soil. As a result, there is less moisture at the beginning of the cycle. Groundwater lacks moisture through capillaries n moves towards the part. Shield water evaporates on the surface of the soil, and the salts it contains accumulate in the top layer. In 2016, 4 sections were installed in the field of experimentation. One of the sections (section 8) is placed at the beginning of the section, and the third section (sections 4, 7, 9,) is placed at the end. Humus and nitrogen were observed in the upper part of section 4 to section 8, with 2.77% and 0.154%, respectively. The amount of sand in the top layer of the sections placed at the end of the ridges varied depending on the water consumption rate. Thus, at the rate of water consumption of 1 l/s (section 9), this rate is 2.81% at 1.5 l/s (section 7), 2.89%, and at 2.0 l/s (section 9). Section) varied between 2.92%. The amount of total nitrogen is the same in all three parts and is 0.168%. The fact that the nitrogen content in all three sections is the same is due to the fact that there is no sharp difference between the top layers of the sections. The amount of sand in the top layer of the section placed at the head of the section (section No. 8) is 1 l/sec more than the volume of the sections placed at the end. Water consumption was 0.04%, 0.12% at 1.5 l/s, and 0.35% at 2.0 l/s. Total nitrogen content was 0.014% lower. This difference is directly related to the effect of washing. The highest lateral phosphorus concentration is observed in the upper layer of the section (section 8) placed at the head of the site and is 12.1%. The amount of phosphorus gradually decreases towards the six layers. The amount of dry residue varies between 0.310-0.450percent in the near-surface layer of the sections. In the profiles of the sections, this rate is 0.080-0.450%. The amount of dry residue in the near layer (0-40 cm layer) is 0.230-0.450% higher than in the near layer. These figures show that the upper layer of the sections is weakly saline, the proximal layer is weakly salty, partially saline, the individual energy layers of the profiles are not slightly saline, and the salinity is partially saline. The amount of dry residue is much less than the soil samples taken in 2015 from the soil samples taken in 2016. Thus, from the soil samples taken in 2015, the amount of dry residue in only one layer (section 3, layer 33-70 cm) is 0.080%. In the remaining strata, weak and moderate salinization is observed, and the amount of dry residue varies between 0.330 and 640%.
| Sections № and field of natural economy | Depth, cm | Humus, In% | General nitrogen, In% | Phosphorus, we need me/kg | Dry residue, in% | CO2, in% | Follows CO2 With CO3,% | Absorbed bases in 100 g of soil in mg. eq. | — | Total absorbed bases in mg eq. | In% of the total of won bases | — |
|---|---|---|---|---|---|---|---|---|---|---|---|---|
| Ca | Мq | Ca | Мq | |||||||||
| 1 | 2 | 3 | 4 | 5 | 6 | 7 | 8 | 9 | 10 | 11 | 12 | 13 |
| 2014-cı il | ||||||||||||
| 1. Perennials (mulberry, pomegranate, pear) are under the trees | 0-25 | 2,79 | 0,168 | 11,8 | Anal. failed | 6,21 | 14,1 | 24,5 | 4,0 | 28,5 | 85,96 | 14,04 |
| 25-52 | 2,12 | 0,126 | 9,5 | 5,81 | 13,2 | 19,5 | 5,0 | 24,5 | 79,59 | 20,41 | ||
| 52-75 | 1,24 | Anal. failed | Anal. failed | 4,92 | 11,1 | Anal. failed | Anal. failed | Anal. failed | Anal. failed | |||
| 2. The first ones were nearby. It has been under construction for the last 10- 15 years | 0-18 | 3,05 | 0,182 | 13,6 | Anal. failed | 5,63 | 12,7 | 31,0 | 3,0 | 34,0 | 91,18 | 8,82 |
| 18-47 | 2,53 | 0,140 | 10,4 | 4,48 | 10,1 | 21,5 | 4,0 | 25,5 | 84,31 | 15,69 | ||
| 47-76 | 1,55 | Anal. failed | Anal. failed | 7,12 | 16,1 | Anal. failed | Anal. failed | Anal. failed | Anal. failed | |||
| 76-103 | 1,03 | 6,09 | 13,8 | |||||||||
| 2015-cı il | ||||||||||||
| 3.Perennials (mulberry, pomegranate, pear) are under the trees | 0-20 | 2,89 | 0,168 | 12,5 | 0,400 | 6,95 | 15,8 | 24,5 | 5,0 | 29,5 | 83,05 | 16,95 |
| 20-33 | 2,17 | 0,126 | 10,7 | 0,480 | 6,20 | 14,1 | 20,00 | 5,5 | 25,5 | 78,43 | 21,57 | |
| 33-70 | 1,34 | 0,070 | 9,2 | 0,080 | 7,39 | 16,8 | 19,0 | 4,0 | 23,0 | 82,61 | 17,39 | |
| 1 | 2 | 3 | 4 | 5 | 6 | 7 | 8 | 9 | 10 | 11 | 12 | 13 |
| 4.Perennial (50-60 years mulberry orchard) under the canopy | 0-18 | 2,90 | 0,182 | 14,0 | 0,540 | 5,85 | 13,3 | 31,5 | 3,0 | 34,5 | 91,30 | 8,70 |
| 18-37 | 2,27 | 0,140 | 11,2 | 0,350 | 5,54 | 12,6 | 22,5 | 4,0 | 26,5 | 84,91 | 15,09 | |
| 37-78 | 1,50 | 0,084 | 9,6 | 0,410 | 7,91 | 18,0 | 19,5 | 4,5 | 24,0 | 81,25 | 18,75 | |
| 5.Multiplicity (mulberry, pomegranate, pear) under the sides | 0-15 | 2,84 | 0,160 | 11,7 | 0,560 | 7,25 | 16,5 | 27,3 | 5,8 | 33,1 | 82,48 | 17,52 |
| 15-34 | 2,17 | 0,132 | 10,2 | 0,480 | 7,12 | 16,2 | 23,1 | 5,3 | 28,4 | 81,34 | 18,66 | |
| 34-67 | 1,86 | 0,104 | 8,5 | 0,410 | 6,95 | 15,8 | 20,7 | 4,8 | 25,5 | 81,18 | 18,82 | |
| 67-85 | 1,40 | Anal. failed | Anal. failed | 0,350 | 6,46 | 14,7 | 16,4 | 4,3 | 20,6 | 79,61 | 20,39 | |
| 2016-cı il | ||||||||||||
| 6. Perennials (mulberry, pomegranate, pear) under the sides | 0-12 | 2,74 | 0,154 | 13,6 | 0,640 | 10,3 | 23,5 | 29,4 | 4,8 | 34,2 | 85,96 | 14,04 |
| 12-36 | 2,12 | 0,126 | 10,2 | 0,500 | 9,9 | 22,7 | 25,4 | 5,3 | 30,7 | 82,74 | 17,26 | |
| 36-70 | 1,76 | 0,112 | 8,7 | 0,460 | 10,0 | 22,8 | 21,7 | 4,2 | 25,9 | 83,78 | 16,22 | |
| 70-83 | 1,34 | Anal. failed | Anal. failed | 0,330 | 9,3 | 21,13 | 15,9 | 4,8 | 20,7 | 76,81 | 23,19 | |
| 8. Perennials (mulberry, pomegranate, pear) under the sides | 0-16 | 2,77 | 0,154 | 12,1 | 0,350 | 9,08 | 24,8 | 28,6 | 4,5 | 33,1 | 86,40 | 13,60 |
| 16-40 | 2,16 | 0,126 | 9,7 | 0,240 | 10,5 | 23,3 | 25,0 | 5,1 | 30,1 | 83,06 | 16,94 | |
| 40-80 | 1,39 | 0,084 | 7,6 | 0,120 | 9,5 | 21,8 | 21,5 | 4,1 | 25,6 | 83,98 | 16,02 | |
| 1 | 2 | 3 | 4 | 5 | 6 | 7 | 8 | 9 | 10 | 11 | 12 | 13 |
| 9. Perennials (mulberry, pomegranate, pear) under the sides | 0-18 | 2,81 | 0,168 | 11,8 | 0,310 | 9,7 | 22,2 | 27,5 | 6,1 | 33,6 | 81,85 | 18,15 |
| 18-36 | 2,15 | 0,126 | 10,3 | 0,230 | 9,0 | 20,5 | 24,0 | 5,5 | 29,5 | 81,36 | 18,64 | |
| 36-67 | 1,83 | 0,098 | 8,4 | 0,080 | 8,1 | 18,6 | 20,0 | 4,6 | 24,6 | 81,30 | 18,70 | |
| 10. Perennials (mulberry, pomegranate, pear) under the sides | 0-18 | 2,92 | 0,168 | 11,7 | 0,380 | 7,39 | 16,8 | 28,0 | 4,5 | 32,5 | 86,15 | 13,85 |
| 1839 | 2,21 | 0,126 | 8,6 | 0,260 | 6,59 | 15,0 | 24,5 | 5,5 | 30,0 | 81,67 | 18,33 | |
| 39-68 | 1,90 | 0,112 | 7,4 | 0,150 | 6,29 | 14,3 | 20,5 | 5,5 | 26,0 | 78,85 | 21,15 | |
| 68-81 | 1,47 | Anal. failed | Anal. failed | 0,092 | 5,63 | 12,8 | 19,5 | 4,0 | 23,5 | 82,98 | 17,02 |
Table text extracted from the original PDF; superscript letters are shown inline. The original table image is below.
View original table image
In the soil samples taken in 2016, the subsoil (a total of 6 strata) was not subject to salinization (dry matter content is 0.080-0.210%). In the adjacent layer, 2 layers (dry residue 0.240% in the 16-40 cm layer of section 8, 0.230% in the 18-36 cm layer of section 9) were not saline, and 6 layers were slightly saline. The reason why the amount of dry residue in the individual genetic layers of the sections laid in 2015 was higher than in the sections laid in 20016 is related to the drought of 2015. Due to the hot weather, groundwater has migrated to the soil layers. The water has evaporated and the salts in the water have accumulated in the soil.
As a result, the following is recommended
The following results of the multi-year research conducted in Kurd Amir District in 2006-2008 can be summarized as follows:
1. As a result of non-compliance with water consumption norms, glacial-meadow soils in the Shriven plain are subject to irrigation erosion. 2. Along with the soil washed away as a result of irrigation erosion, both organic and inorganic compounds in it are washed away, which has a negative impact on soil fertility. 3. A comparison of the results of the analysis of gold-bearing soils in the field in 2014 shows that most of the irrigated lands in the agro-chemical plantations of the part of the field were irrigated. Thus, the amount of humus in the surface of the section is 3.05%, total nitrogen, 0.182%, and phosphorus 13.6%, calcium 31.0 mg. eq. In the case of perennial fat, 2.79%, 0.168%, 11.8% and 24.5 mg, respectively. eq. He is dead. It is precisely the failure of irrigation that results in gold-bearing soils producing 0.26% humus, 0.014% total nitrogen, 1.8% phosphorus, and 6.5 mg of perennial soil. Eq. Calcium was washed away. 4. As a result of irrigation under perennial crops, the amount of total and total nitrogen leached from the topsoil, which contains the necessary nutrients for 2 years at different water consumption rates, has also varied. Thus, in comparison with the section on the top of the canopy, the amount of water consumption at the rate of 1 l/s for 2 years on the surface of the sections at the end of the canopy is 0.14%, nitrogen 0.020%, 1.5 l/s at 1.5 l/s. and 0.028%, while at 2 l/s it was 0.31% and 0.042% more. This increase was directly due to the washing away of the upper part of the ridges. 5. During 2 years, the minimum leaching of total, total nitrogen and essential nutrients (total 0.14%, total nitrogen 0.020%) was at the rate of 1 l/s water consumption. This is water consumption it is considered expedient to apply the norm in production.
References
2 in the original paper- Aliyev BH. Nurullayev SM, Ayaev Sh. B. Study and application of irrigation erosion control measures in Absheron conditions. Scientific Foundation of the Institute of Erosion and Irrigation. Baku. 2005. p. 102.
- Babatunde RO, Kareem AT, Olayemi OO, Adelusi FT, Ugege BH, Elesho RO, et al. Effect of use of agrochemical among arable crop farmers in Osun state. Int. J Agric. Food Sci. 2020;2(1):01-04. DOI: 10.33545/2664844X.2020.v2.i1a.27