
Research article · 2022 · Full text
International Journal of Horticulture and Food ScienceGenetic diversity of Ethiopian barley (Hordeum vulgare L.) genotypes based on multivariate statistical analysis for acid soil tolerance
Volume 4(1) · Pages 36–48 · DOI: 10.33545/26631067.2022.v4.i1a.84 ↗
Research areasGenetics and Plant BreedingPlant Micronutrient Interactions and EffectsWheat and Barley Genetics and Pathology
Abstract
Author-writtenSoil acidity is now a serious threat to barley production in most high lands of Ethiopia. Three hundred twenty (320) barley genotypes were evaluated in 2017 main-season, at Holeta Agricultural Research Center using 20x16 Alpha Lattice design under two-soil conditions (limed and unlimed). The objectives of the study were to evaluate the genetic variability among barley genotypes for soil acidity tolerance using multivariate analysis. Barley genotypes were classified into thirteen, sixteen and twelve clusters under unlimed and limed soil condition and by stress index cluster analysis, respectively. Principal component analysis exhibited 81% and 78% of total variation under unlimed and limed soil condition respectively. Phenotypic diversity index was very high for ear attitude, kernel row number and Kernel color and comparatively low for spike density.
Summary
Source-checkedPlain-language reading of the full paper, prepared with AI and checked against the text. Each point links to the authors' own words.
Why it matters
- Soil acidity is currently a major threat to the production of barley in the Ethiopian highlands. View evidence ↗
- Compared to other cereals like wheat, rice, oat, and rye, barley is more sensitive to acidic soils. View evidence ↗
- The significant diversity found in Ethiopian barley landraces is likely caused by long-term geographical isolation and variations in topography, altitude, climate, and soil. View evidence ↗
The question
- The study aimed to use multivariate analysis to evaluate genetic variability among barley genotypes specifically for their tolerance to soil acidity. View evidence ↗
What they did
- In 2017, 320 barley genotypes were tested at the Holeta Agricultural Research Center using a 20x16 Alpha Lattice design in both limed and unlimed soil conditions. View evidence ↗
- The 320 genotypes used in the study consisted of 293 pure lines from various acid-soil zones in Ethiopia and 27 released varieties. View evidence ↗
What they found
- Applying lime successfully increased the soil pH to 6.24 and reduced exchangeable acidity from 1.71 to 0.21 cmol/kg. View evidence ↗
- Principal component analysis showed that 81% of total variation occurred under unlimed soil and 78% under limed soil. View evidence ↗
- The phenotypic diversity index was found to be very high for kernel color, kernel row number, and ear attitude, while it was relatively low for spike density. View evidence ↗
- In unlimed soil, a small group of genotypes (1.56% of the population), including Miscal-21, Travller, EH 1847, HB 1964, and Ibon174/03, showed the best overall performance. View evidence ↗
- Based on grain yield, clusters III, IX, XI, VII, and II showed the lowest susceptibility indices, ranging from -1.82 to -5.22. View evidence ↗
- Clusters V, VIII, and XII were found to be highly vulnerable to acid soil stress, with high susceptibility indices of 3.09, 2.87, and 2.52. View evidence ↗
What it means
- The authors concluded that there is significant genetic diversity among barley genotypes collected from different acid-prone growing areas in Ethiopia. View evidence ↗
- The observation of tolerant genotypes with better yields in acidic environments indicates that Ethiopia possesses a wide genetic diversity of barley capable of tolerating soil acidity stress. View evidence ↗
Visual summary
3 visualsIllustrations explain the paper; charts are replotted from the paper's own table values.
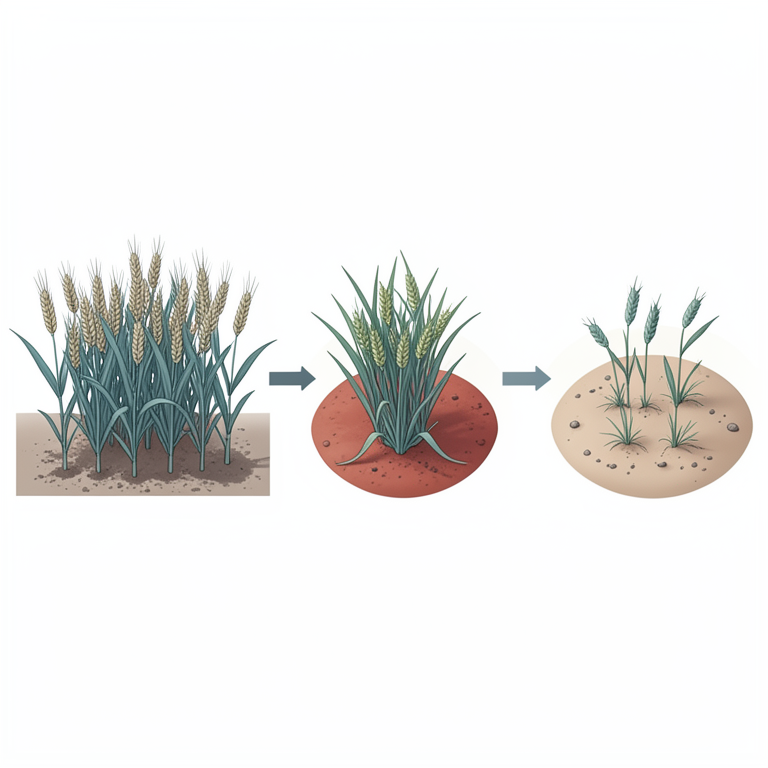
Genetic Diversity Clustering
AI-generated conceptual illustration (Ethiopian barley plants (Hordeum vulgare L.) in soil). It explains the idea and does not show study data.
View source evidence ↗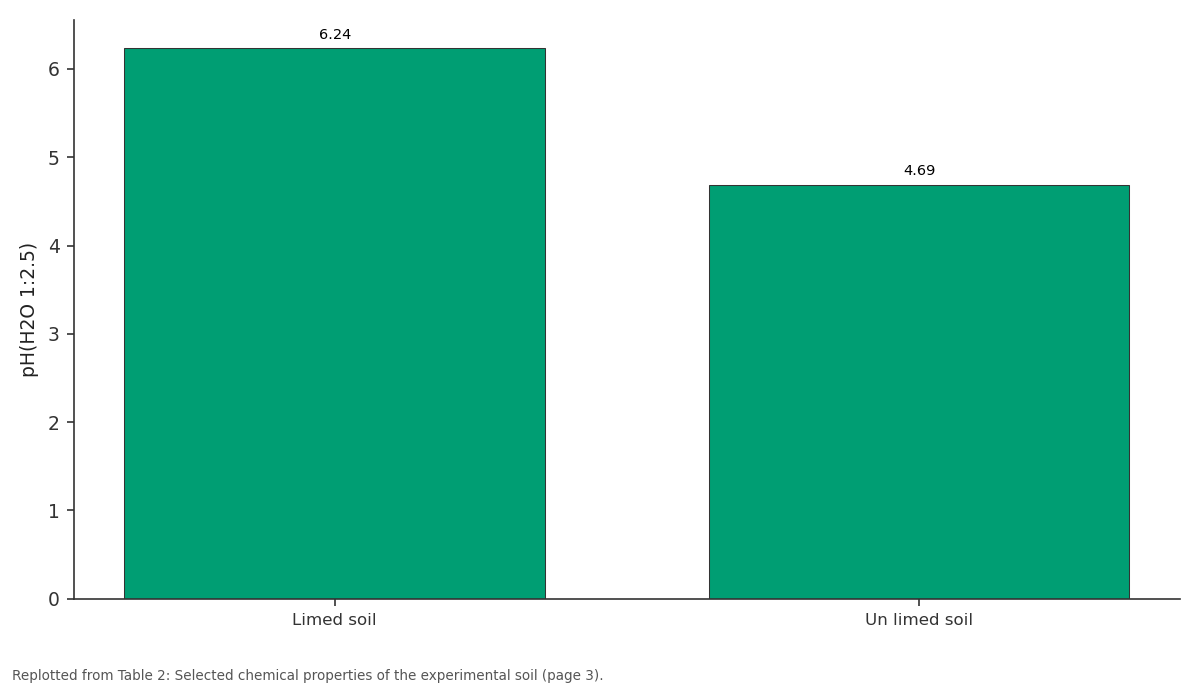
pH(H2O 1:2.5): Limed soil vs Un limed soil
Replotted from Table 2 (page 3) of the original paper. Every bar is the paper's own table value.
View source evidence ↗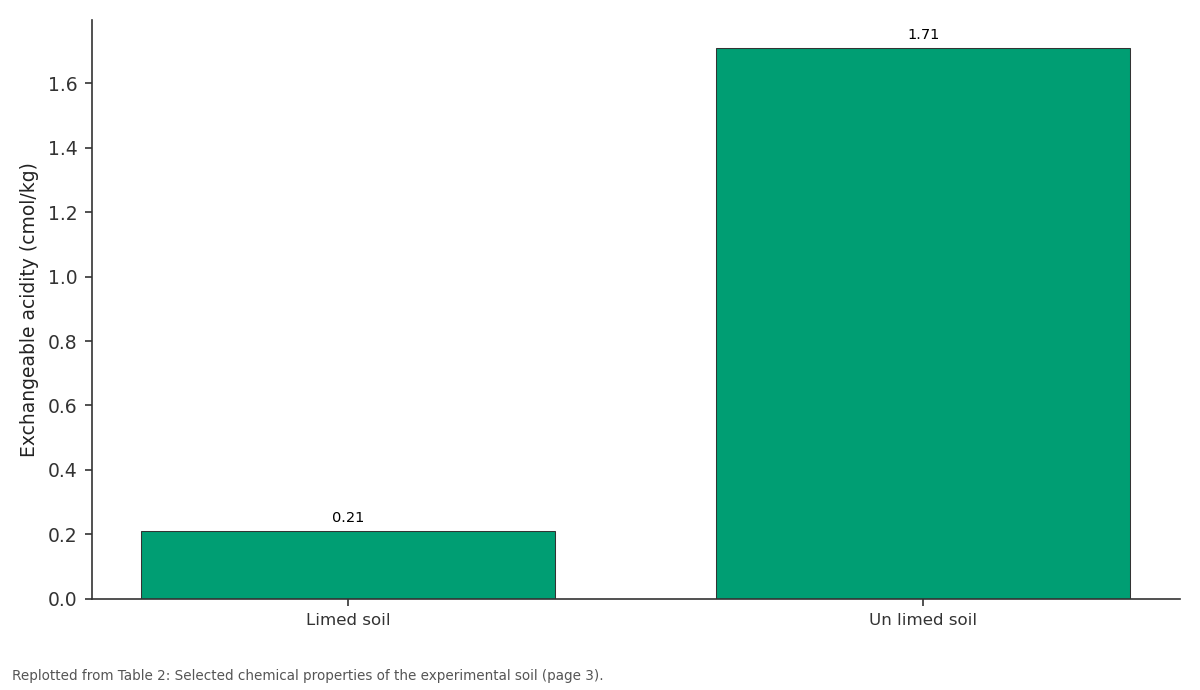
Exchangeable acidity (cmol/kg): Limed soil vs Un limed soil
Replotted from Table 2 (page 3) of the original paper. Every bar is the paper's own table value.
View source evidence ↗Figures & tables
From the original paper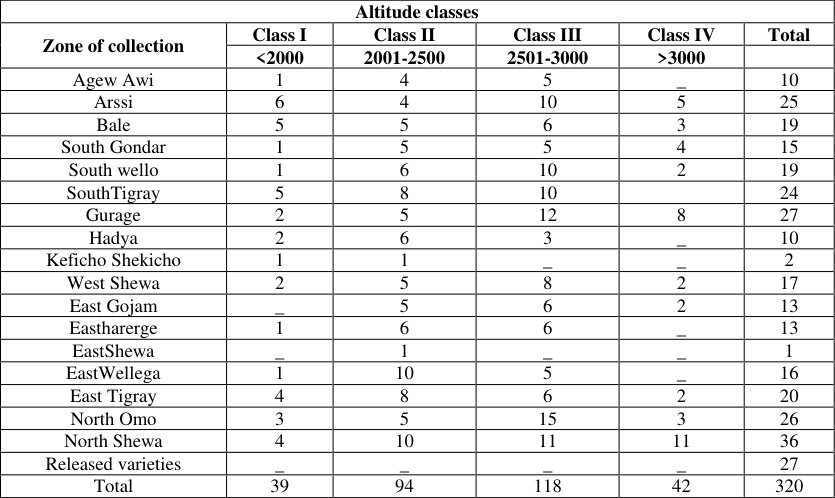 Table 1
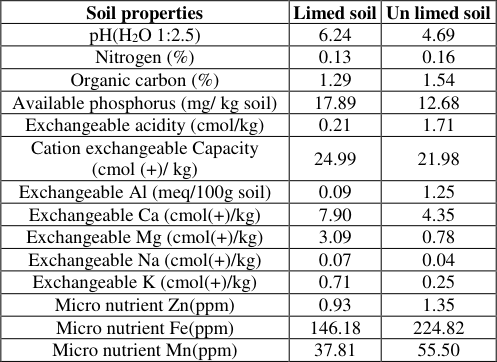 Table 2
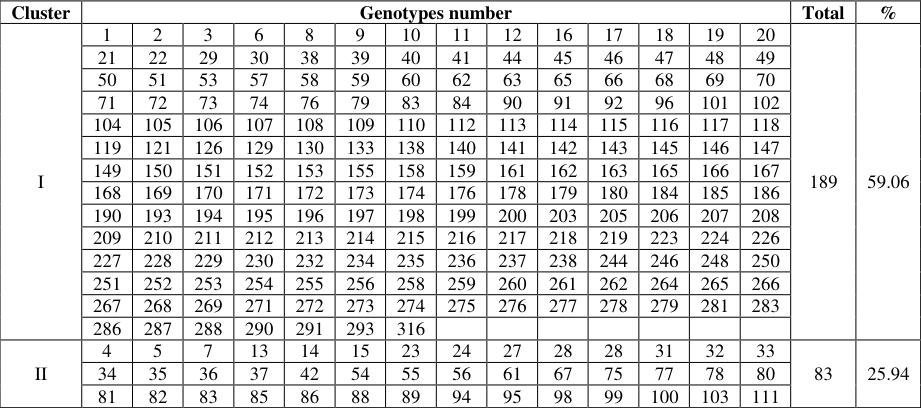 Table 3
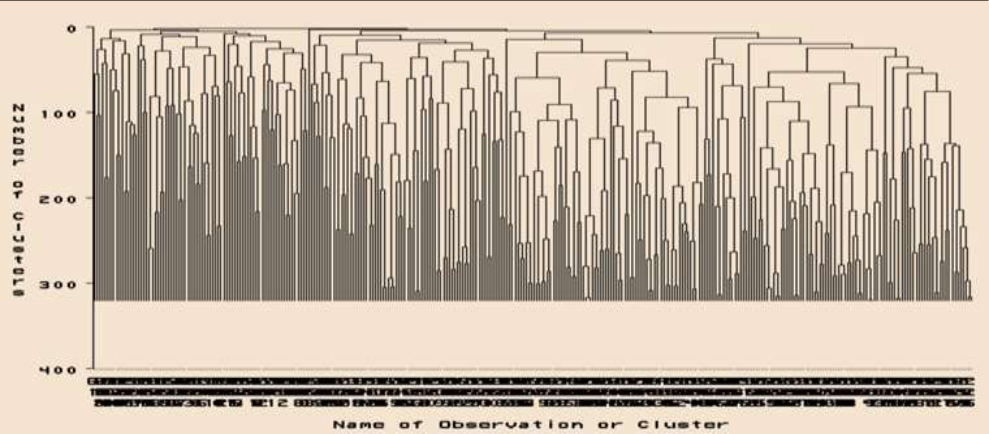 Figure 1
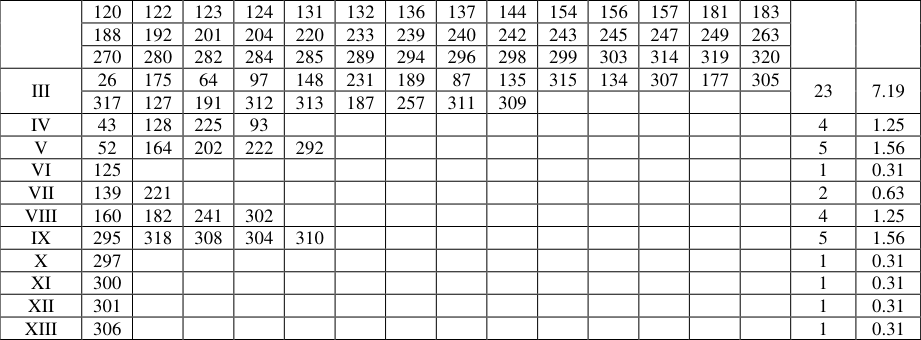 Table 4
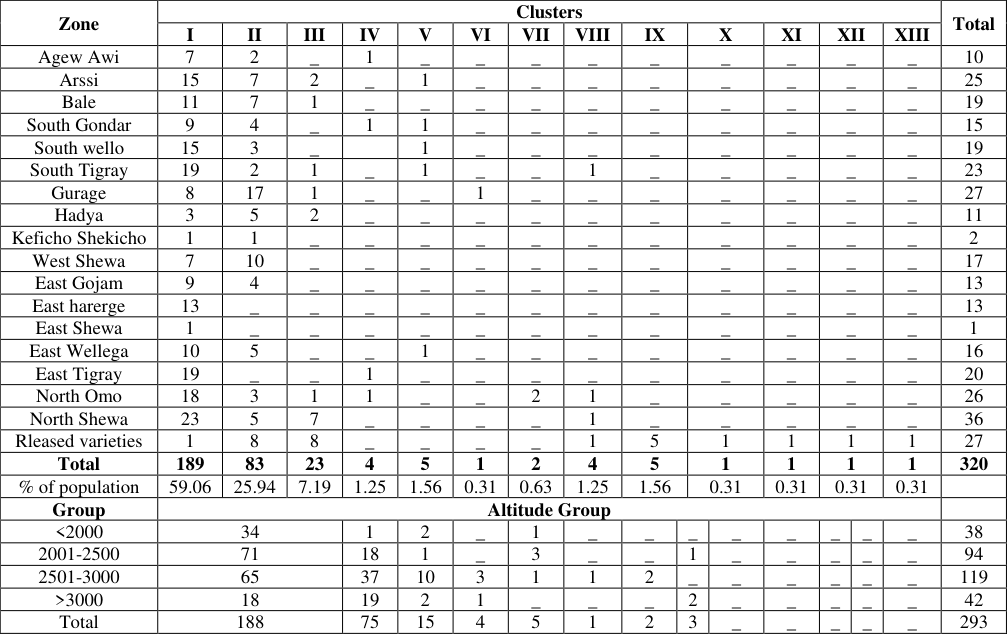 Table 4
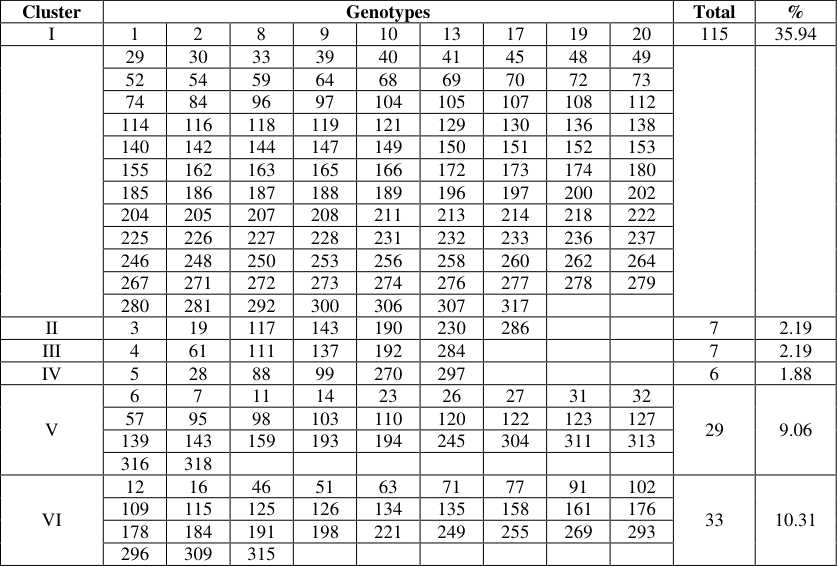 Table 5
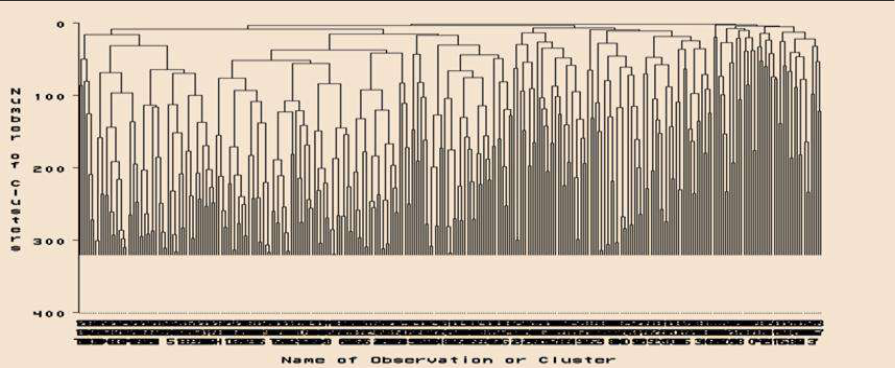 Figure 2
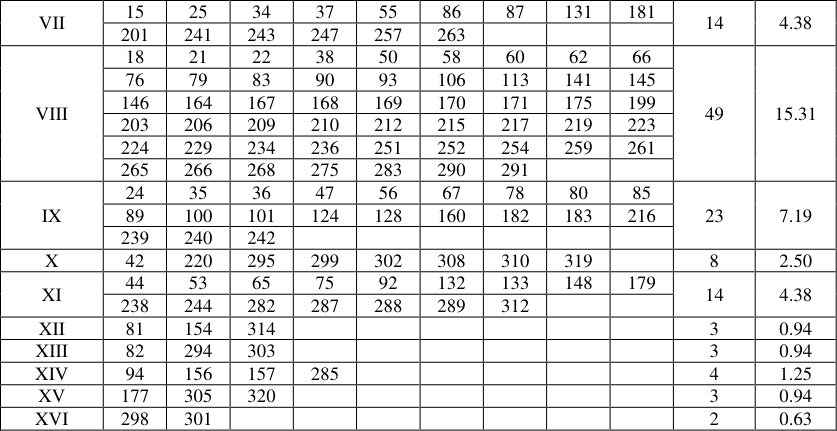 Table 6
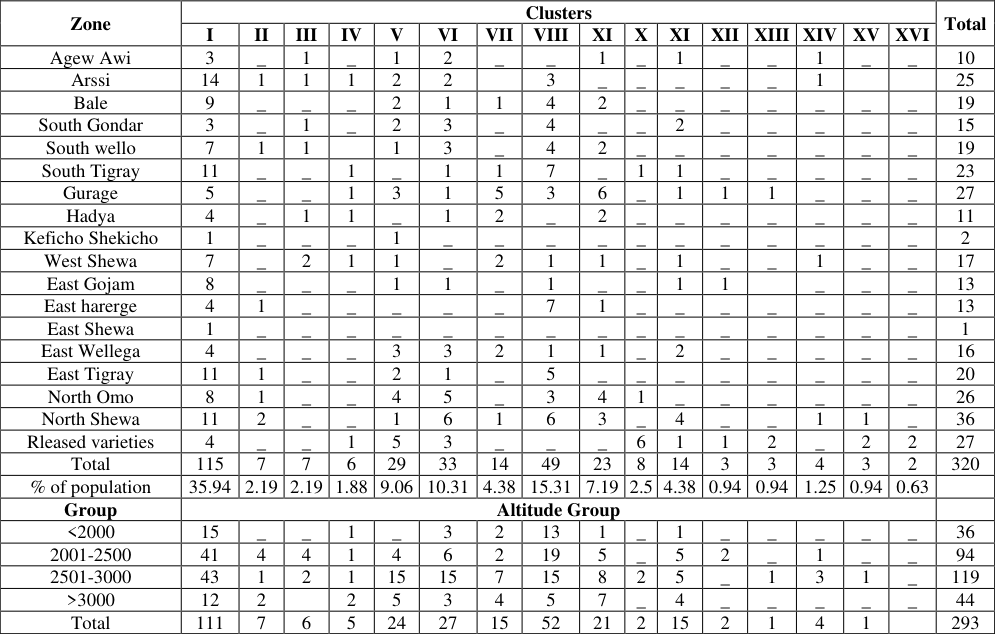 Table 6
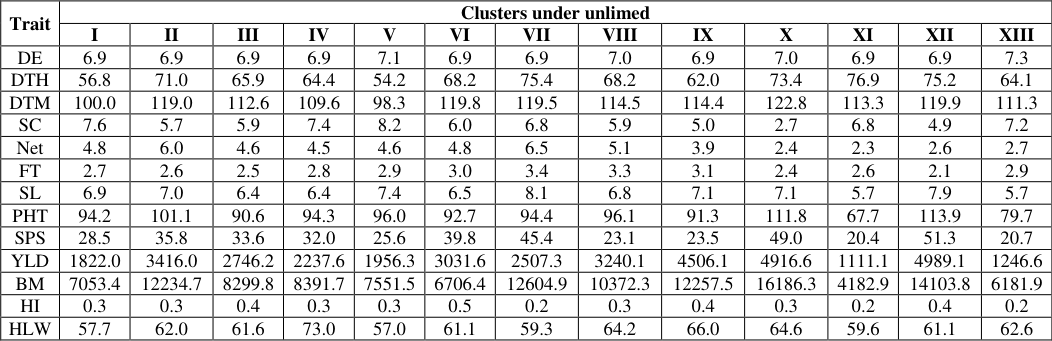 Table 7
 Table 8
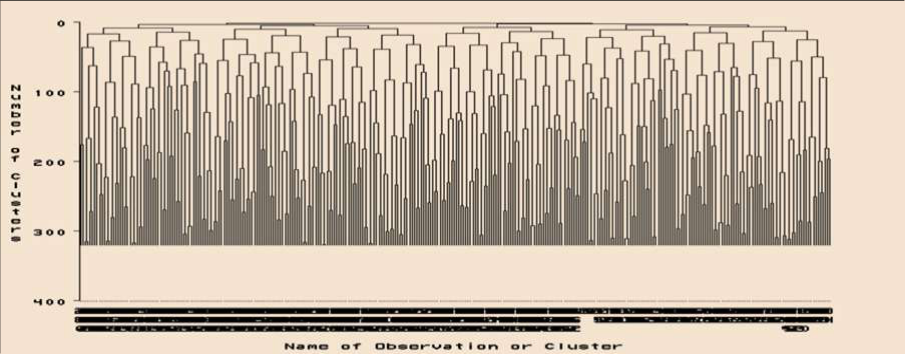 Figure 3
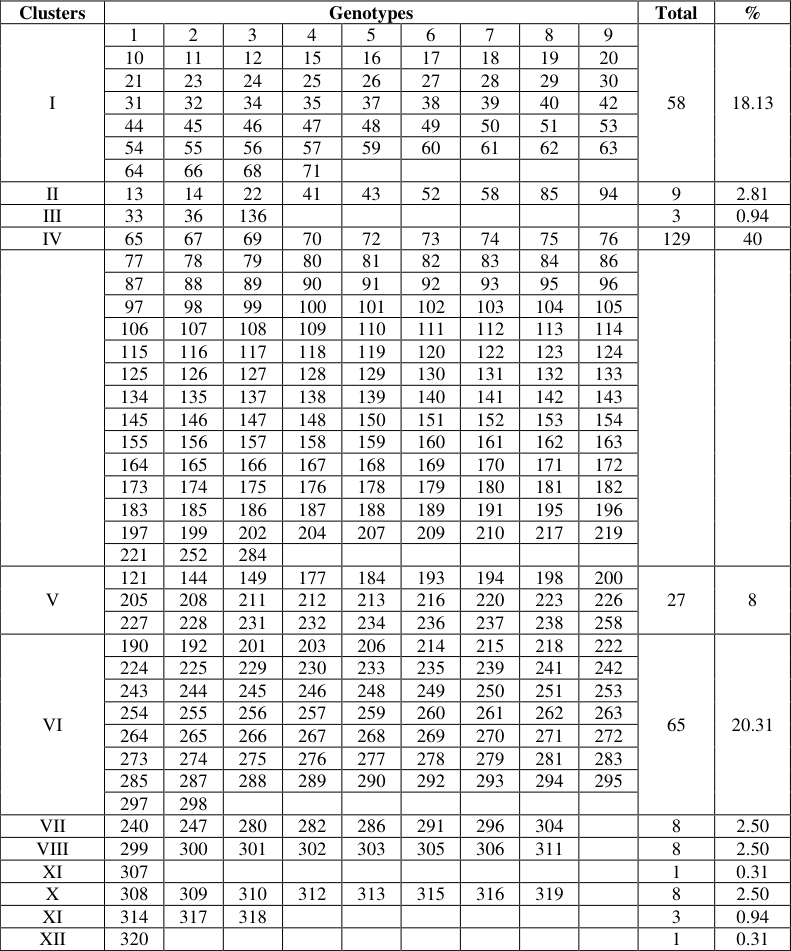 Table 9
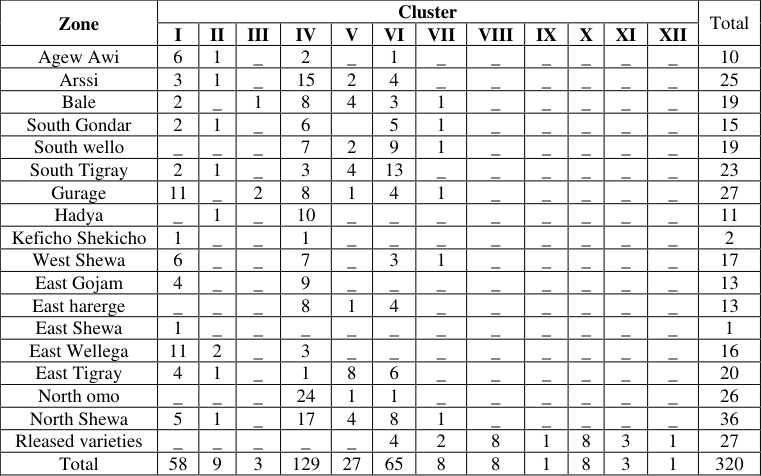 Table 10
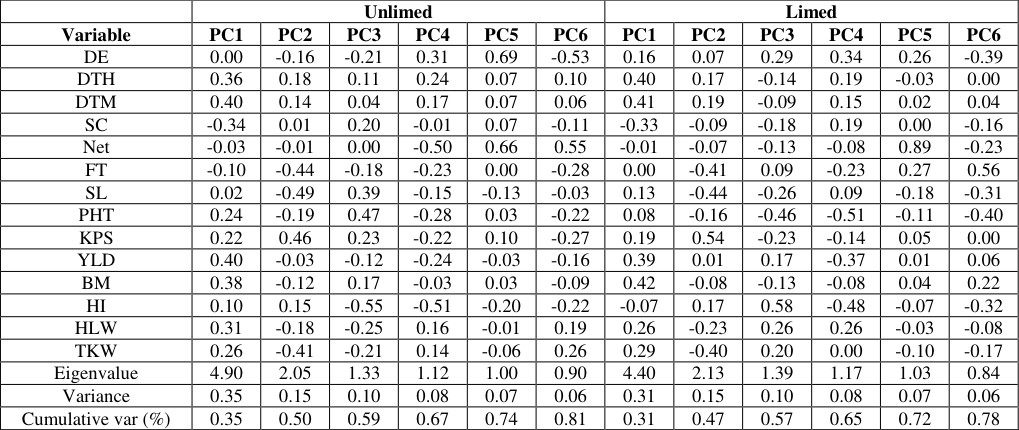 Table 11
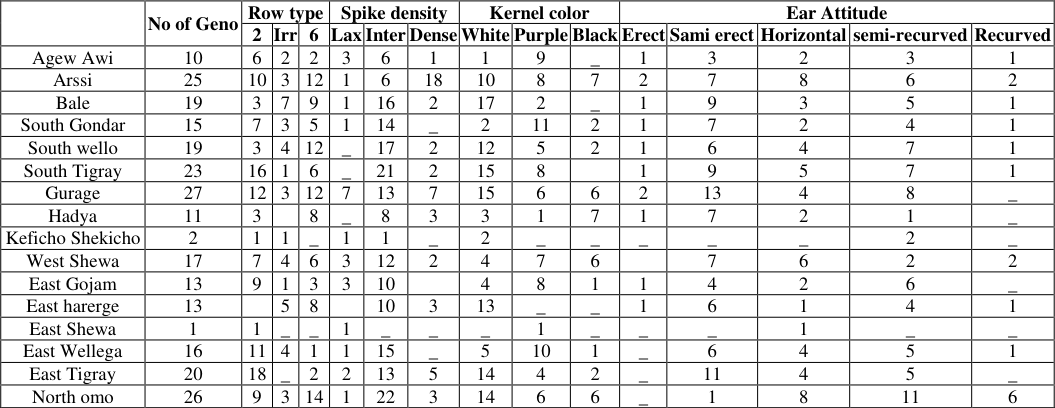 Table 12
 Table 13
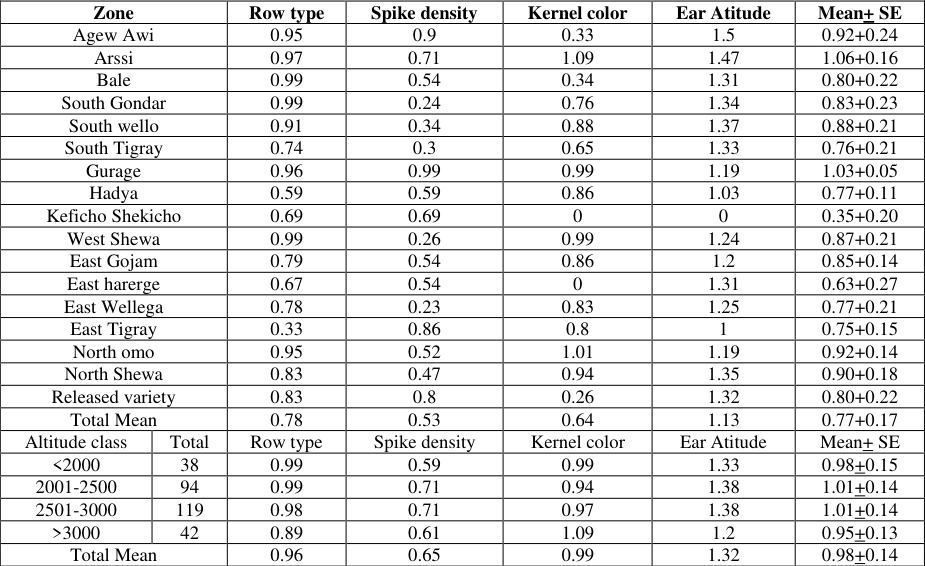 Table 13
Introduction
Barley (Hordeum vulgare L.) is the most important cereal crop in Ethiopia, with productivity of 2.53 ton ha -1 [1] . It is an important crop grown in diverse agro-ecology from 1,500 to 3,500m altitude for many purpose in different seasons and production systems and a common food grain, especially for highlands of Ethiopia [2,3] . Soil acidity is one of the most important constraints in barley production, mainly on Nitisols or Oxisols, of the Ethiopian highlands where the rainfall intensity is high and crop cultivation has been carried out for centuries [4,5] . Barley is considered to be more sensitive to acidic soils than rye, oat, rice and wheat [6] . Among cultivated cereals, barley has several accessions preserved in the Ethiopian gene bank with more than 15, 300 collections. This is approximately 23% of the total landraces conserved in the gene bank of the country [7] . The large diversity in the Ethiopian barley landraces could be due to the diversity in soils, climate, altitude and topography together with geographical isolation for long periods [8] . Barley in gene bank serves as a reservoir of potentially useful genes for many purposes, including breeding for resistance to diseases, pests and other environmental stresses, as well as for traits that increase yield or food quality [9] . Most of acid tolerant crop varieties are usually obtained from highly acidic soils of the world. The most likely reasons for such associations are natural selection and adaptation or human selection by early agriculturalists. Hence, evaluation of germplasm collected from acid soil areas was considered as the logical and appropriate entry strategy in acid tolerance breeding [10] . Estimating genetic diversity and determining the relationship between the germplasm collections enhance efficient collection management and genetic improvement [11] . Multivariate statistical techniques are used by geneticists to estimate genetic diversity among cultivars within a crop under the presumption that cultivars within groups are genetically related whereas diverse cultivars are classified into different groups. The premise was that genotypes from different geographical regions would exhibit genetically diverse due to mutation, genetic drift and selection [12] . Hence, this study was done with the objective to evaluate the genetic variability among barley genotypes for soil acidity tolerance using multivariate analysis. using a zigzag sampling pattern from experimental field before sowing and after harvest [13] . The collected samples were immediately air-dried and sieved to separate the roots and other unwanted materials from the soil and all samples were combined. Finally, composite sample was submitted for laboratory analysis. Soil pH was measured potentiometrically with a digital pH meter in the supernatant suspension of 1:2.5 soils to water ratio [14] . Exchangeable cations (Ca, Mg, K and Na) and cation exchange capacity (CEC) were determined after leaching the soil samples with 1 M ammonium acetate solution at pH 7 [15] . Exchangeable acidity (Al + H) was determined by saturating the soil samples with 1M KCl solution and titrated with 0.02 M NaOH [16] . Before sowing the acid soil was ameliorated by lime (CaCO3), to raise soil pH from acidic conditions to a target level that was optimized for the plant growth [17]. The amount of lime required was calculated based on the formula of [18] . LR, CaCO3 (kg/ha) = Where EA= exchangeable acidity, expressed in Cmol/kg of soil, 0.15 m plowing depth. Total volume of hectares of soil = area (10000m 2 )*Depth (0.15m), B.D = bulk density taken as 1.1 g/cm 3 for loam soil textural class. Then multiplied by a crop coefficient factor for soil acidity which is 2.0 = for Al-sensitive crops (barley belongs to these groups).
Experimental Design and Procedures
The study was conducted on two soil acidity conditions (unlimed and limed soils) as two separate experiments laid out in 20x16 Alpha Lattice Design with two replications for each experiment. Plots consisted of four rows each 2.5m long by 0.8m width (2m 2 ). Each plot had 0.2m spacing between rows. The spacing between plots, blocks in each replication and between replications were 0.5m, 1.0m and 1.0m respectively. The seed rate was 85kgha -1 and fertilizers were applied during planting in the form of Urea and Diamonium phosphate (DAP) at the rate of 41 and 46kgha -1 respectively. The experiment was planted on the first week of July in 2017.All field management practices were handled as per the recommendation for barley production.
Data collection
Crop phonology like days to emergence (DTE), days to heading (DTH) and days to maturity (DTM) were counted from date of planting to 50% seedling emergence and from date of emergence to 50% heading and 75% physiological maturity of plants in each plot respectively. The average plant height (PH) was measured from the ground to the tip of spikes of five main plants of the two middle rows of each plot. Disease scoring on barley leaf scaled and net blotch disease was assessed by visual examination using a scale of 0 to 9 according to [19] . Yield components such as fertile tillers per plant (FTP), spike length per plant (SLP) and kernels per spike (KPS) were determined from five random plants of the middle rows of each plot. After harvesting, indiscriminately counted thousand kernels weight (TKW) from each plot were weighted and adjusted to 12.5% standard grain moisture content of cereals, while hectolitre weight (HLW) was measured after drying the grain of each plot up to 12.5% moisture content. The total above ground biomass yield (BY) harvested from the middle two rows of each plot was dried out for some days under sun and then weighted. The grain yield (GY) was harvested from the middle two rows of each plot and adjusted to the standard grain moisture content (12.5%). Stress susceptibility index (SSI) was calculating for each genotype using the formula developed by [20] and Stress tolerance index (STI) was calculated for each genotype using the formula developed by [21] . Qualitative traits (ear attitude, kernel row number, kernel color, spike density) were collected according to descriptors for barley [22] .
Statistical Procedures Cluster Analysis
Multivariate analysis computes two or more variables at a time. For this purpose the data will be standardized to mean of zero and a variance of one. Three hundred twenty genotypes and seventeen regions of origin were grouped into respective classes. The values of pseudo F statistic (PSF) and Hotellin's pseudo T 2 statistic were used for defining the optimum number of clusters. Hierarchical cluster analysis was computed using the PROC CLUSTER Procedure SAS Version 9.1.3 [23] . Unweighted Pair Group Method using Arithmetic Average linkage (UWPGMA) was employed. The results of the cluster analysis were presented in the form of a dendrogram to depict the degree of similarity and interrelationships among regions and genotypes.
Principal component analysis
The principal component analysis (PCA) was computed to reduce the number of variables in to a few correlated components that can explain much of the variability. It was performed using the correlation matrix to define the patterns of variation among genotypes based on the mean of quantitative characters. It also helps to identify characters that load the most in explaining the observed variation. The PROC PRINCOMP Procedure of SAS Version 9.1.3 [23] was used for principal component analysis.
Estimate of diversity index
The Shannon-Weaver diversity index (H′) was used to compute the phenotypic frequencies and to assess the phenotypic diversity for each character for all accessions. It is used in genetic resource studies as a convenient measure of both richness and evenness using quantitative data. It was computed using the phenotypic frequencies to assess the overall phenotypic diversity for each trait by zones and altitude ranges.
H' =
Where: H' = standardized relative diversity index, n = is the number of phenotypic classes per characters Pi = is the proportion of the total number of entries in the i th class, ln = natural logarithm
Results and Discussion
Results and Discussion
Effect of Lime Application on Soil Acidity Related Chemical Properties of the Soil
The soil chemical analysis results after harvest for some chemical properties are presented in Table 2. The Soil acidity changed from strongly acidic to slightly acidic classes and the deficiency of certain plant nutrients were observed. The application of lime raised the soil pH to 6.24 and dropped exchangeable acidity from 1.71 to 0.21(cmol/kg) under unlimed and limed, respectively. The organic carbon (OC) content was 1.29 and 1.54 % under unlimed and limed soil which is medium according to [24] who categorized OC content as very low (<0.06%), low (0.60-1.25%) and medium (1.26-2.50%). This have an impact on the availability of organic matter content in the soil. The values for total nitrogen (N) were 0.13 and 0.16% under limed and unlimed soil. According to [25], these values were rated as low. The available phosphorus (P) was 12.68 and 17.89 mg/kg under unlimed and limed soil, respectively. The available P categorized as high (> 50 mg/kg), as medium (15 -50 mg/kg) and as low (< 15 mg/kg) [25] . Based on this classification, available P of limed soil was grouped as medium and unlimed as low. The Cation Exchange Capacity (CEC) was 21.98 and 24.99 (cmol/kg) under unlimed and limed soil. According to [25] , soils had optimum CEC values. Liming also affected exchangeable Al, exchangeable bases (Ca, Na, Mg and K), Available Micronutrient (Zn, Fe and Mn) (Table 2). This result was in agreement with the result of [26] indicated that an increase in the exchangeable bases as a result of lime application to soils. Reclaiming acid soils by liming had significant effect on selected soil chemical properties of soil [27] . Cluster analysis for Genotypes under limed and unlimed soil Cluster mean analysis was used to compare and classify the observed trait variation in the genotypes. Barley genotypes collected from wide eco-geographic range of the country had best adaptation to soil acidity [28] . Based on various phenotypic data, barley genotypes were grouped by cluster analysis on the basis of Euclidean distances of dissimilarity to their distinct groups under unlimed and limed soil conditions (Table 3 and5). Under unlimed soil condition, barley genotypes were classified into thirteen clusters (Table 3). Numbers of genotypes per cluster varied from one hundred eighty nine genotypes in cluster I to 1 genotypes in cluster XIII. Within cluster trait means (Table 7) and percent of genotypes in each cluster were shown in (Table 3, Figure 1). Cluster I hold 59.06% of the total experimental materials. Genotypes grouped under cluster I were scattered along all regions and more at altitude group between (2001 and 3000m.a.s.l). Majority of landraces were collected from zones North Shewa, East Tigray, South Tigray, North omo, South wello, Arssi and one released variety, whereas cluster II and III contained the second and third large number of barley genotypes, each of these cluster constitute eight released varieties and different number of landraces collected from different part of Ethiopia (Table 4). Furthermore cluster I has been characterized by early flowering and maturing, highly susceptible to scald and moderately susceptible for net blotch diseases, relatively lower number of fertile tillers per plant, relatively the lightest thousand seed weight, intermediate plant height, relatively shorter spike length, relatively lower grain yield and biomass yield as compared to grand mean of genotypes.
| Trait | Clusters under unlimed | — | — | — | — | — | — | — | — | — | — | — | — |
|---|---|---|---|---|---|---|---|---|---|---|---|---|---|
| I | II | III | IV | V | VI | VII | VIII | IX | X | XI | XII | XIII | |
| DE | 6.9 | 6.9 | 6.9 | 6.9 | 7.1 | 6.9 | 6.9 | 7.0 | 6.9 | 7.0 | 6.9 | 6.9 | 7.3 |
| DTH | 56.8 | 71.0 | 65.9 | 64.4 | 54.2 | 68.2 | 75.4 | 68.2 | 62.0 | 73.4 | 76.9 | 75.2 | 64.1 |
| DTM | 100.0 | 119.0 | 112.6 | 109.6 | 98.3 | 119.8 | 119.5 | 114.5 | 114.4 | 122.8 | 113.3 | 119.9 | 111.3 |
| SC | 7.6 | 5.7 | 5.9 | 7.4 | 8.2 | 6.0 | 6.8 | 5.9 | 5.0 | 2.7 | 6.8 | 4.9 | 7.2 |
| Net | 4.8 | 6.0 | 4.6 | 4.5 | 4.6 | 4.8 | 6.5 | 5.1 | 3.9 | 2.4 | 2.3 | 2.6 | 2.7 |
| FT | 2.7 | 2.6 | 2.5 | 2.8 | 2.9 | 3.0 | 3.4 | 3.3 | 3.1 | 2.4 | 2.6 | 2.1 | 2.9 |
| SL | 6.9 | 7.0 | 6.4 | 6.4 | 7.4 | 6.5 | 8.1 | 6.8 | 7.1 | 7.1 | 5.7 | 7.9 | 5.7 |
| PHT | 94.2 | 101.1 | 90.6 | 94.3 | 96.0 | 92.7 | 94.4 | 96.1 | 91.3 | 111.8 | 67.7 | 113.9 | 79.7 |
| SPS | 28.5 | 35.8 | 33.6 | 32.0 | 25.6 | 39.8 | 45.4 | 23.1 | 23.5 | 49.0 | 20.4 | 51.3 | 20.7 |
| YLD | 1822.0 | 3416.0 | 2746.2 | 2237.6 | 1956.3 | 3031.6 | 2507.3 | 3240.1 | 4506.1 | 4916.6 | 1111.1 | 4989.1 | 1246.6 |
| BM | 7053.4 | 12234.7 | 8299.8 | 8391.7 | 7551.5 | 6706.4 | 12604.9 | 10372.3 | 12257.5 | 16186.3 | 4182.9 | 14103.8 | 6181.9 |
| HI | 0.3 | 0.3 | 0.4 | 0.3 | 0.3 | 0.5 | 0.2 | 0.3 | 0.4 | 0.3 | 0.2 | 0.4 | 0.2 |
| HLW | 57.7 | 62.0 | 61.6 | 73.0 | 57.0 | 61.1 | 59.3 | 64.2 | 66.0 | 64.6 | 59.6 | 61.1 | 62.6 |
Table text extracted from the original PDF; superscript letters are shown inline. The original table image is below.
View original table image
| Zone | Clusters | — | — | — | — | — | — | — | — | — | — | — | — | — | — | Total |
|---|---|---|---|---|---|---|---|---|---|---|---|---|---|---|---|---|
| I | II | III | IV | V | VI | VII | VIII | IX | X | XI | XII | XIII | ||||
| Agew Awi | 7 | 2 | 1 | 10 | ||||||||||||
| Arssi | 15 | 7 | _ 2 | _ 1 | _ | _ | _ | _ | _ | _ | _ | _ | 25 | |||
| Bale | 11 | 7 | 1 | _ | _ | _ | _ | _ | _ | _ | _ | _ | 19 | |||
| South Gondar | 9 | 4 | _ 1 | _ 1 | _ | _ | _ | _ | _ | _ | _ | _ | 15 | |||
| South wello | 15 | 3 | _ | 1 | _ | _ | _ | _ | _ | _ | _ | _ | 19 | |||
| South Tigray | 19 | 2 | _ 1 | 1 | _ | _ | _ 1 | _ | _ | _ | _ | _ | 23 | |||
| Gurage | 8 | 17 | 1 | _ | _ 1 | _ | _ | _ | _ | _ | _ | 27 | ||||
| Hadya | 3 | 5 | 2 | _ | _ | _ | _ | _ | _ | _ | _ | _ | 11 | |||
| Keficho Shekicho | 1 | 1 | _ | _ | _ | _ | _ | _ | _ | _ | _ | _ | 2 | |||
| West Shewa | 7 | 10 | _ | _ | _ | _ | _ | _ | _ | _ | _ | _ | _ | 17 | ||
| East Gojam | 9 | 4 | _ | _ | _ | _ | _ | _ | _ | _ | _ | _ | _ | 13 | ||
| East harerge | 13 | _ | _ | _ | _ | _ | _ | _ | _ | _ | _ | _ | 13 | |||
| East Shewa | 1 | _ | _ | _ | _ | _ | _ | _ | _ | _ | _ | _ | _ | 1 | ||
| East Wellega | 10 | _ 5 | _ | _ | _ 1 | _ | _ | _ | _ | _ | _ | _ | _ | 16 | ||
| East Tigray | 19 | _ | _ 1 | _ | _ | _ | _ | _ | _ | _ | _ | 20 | ||||
| North Omo | 18 | _ 3 | _ 1 | 1 | _ | _ | _ 2 | _ 1 | _ | _ | _ | _ | _ | 26 | ||
| North Shewa | 23 | 5 | 7 | _ | _ | 1 | _ | _ | _ | _ | _ | 36 | ||||
| Rleased varieties | 1 | 8 | 8 | _ | _ | _ | _ | 1 | _ 5 | _ 1 | _ 1 | _ 1 | _ 1 | 27 | ||
| Total | 189 | 83 | 23 | _ 4 | _ 5 | _ 1 | _ 2 | 4 | 5 | 1 | 1 | 1 | 1 | 320 | ||
| % of population | 59.06 | 25.94 | 7.19 | 1.25 | 1.56 | 0.31 | 0.63 | 1.25 | 1.56 | 0.31 | 0.31 | 0.31 | 0.31 | |||
| Group | Altitude Group | |||||||||||||||
| <2000 | 34 | 1 | 2 | 1 | 38 | |||||||||||
| 2001-2500 | 71 | 18 | 1 | _ | 3 | _ | _ | _ 1 | _ | _ | _ | _ | _ | 94 | ||
| 2501-3000 | 65 | 37 | 10 | _ 3 | 1 | _ 1 | _ 2 | _ | _ | _ | _ | _ | 119 | |||
| >3000 | 18 | 19 | 2 | 1 | _ 2 | _ | _ | _ | _ | _ | 42 | |||||
| Total | 188 | 75 | 15 | 4 | _ 5 | _ 1 | _ 2 | 3 | _ | _ | _ | _ | _ | 293 |
Table text extracted from the original PDF; superscript letters are shown inline. The original table image is below.
View original table image
| — | 120 | 122 | 123 | 124 | 131 | 132 | 136 | 137 | 144 | 154 | 156 | 157 | 181 | 183 | — | — |
|---|---|---|---|---|---|---|---|---|---|---|---|---|---|---|---|---|
| 188 | 192 | 201 | 204 | 220 | 233 | 239 | 240 | 242 | 243 | 245 | 247 | 249 | 263 | |||
| 270 | 280 | 282 | 284 | 285 | 289 | 294 | 296 | 298 | 299 | 303 | 314 | 319 | 320 | |||
| III | 26 | 175 | 64 | 97 | 148 | 231 | 189 | 87 | 135 | 315 | 134 | 307 | 177 | 305 | 23 | 7.19 |
| 317 | 127 | 191 | 312 | 313 | 187 | 257 | 311 | 309 | ||||||||
| IV | 43 | 128 | 225 | 93 | 4 | 1.25 | ||||||||||
| V | 52 | 164 | 202 | 222 | 292 | 5 | 1.56 | |||||||||
| VI | 125 | 1 | 0.31 | |||||||||||||
| VII | 139 | 221 | 2 | 0.63 | ||||||||||||
| VIII | 160 | 182 | 241 | 302 | 4 | 1.25 | ||||||||||
| IX | 295 | 318 | 308 | 304 | 310 | 5 | 1.56 | |||||||||
| X | 297 | 1 | 0.31 | |||||||||||||
| XI | 300 | 1 | 0.31 | |||||||||||||
| XII | 301 | 1 | 0.31 | |||||||||||||
| XIII | 306 | 1 | 0.31 |
Table text extracted from the original PDF; superscript letters are shown inline. The original table image is below.
View original table image
| Cluster | Genotypes number | — | — | — | — | — | — | — | — | — | — | — | — | — | Total | % |
|---|---|---|---|---|---|---|---|---|---|---|---|---|---|---|---|---|
| I | 1 | 2 | 3 | 6 | 8 | 9 | 10 | 11 | 12 | 16 | 17 | 18 | 19 | 20 | 189 | 59.06 |
| 21 | 22 | 29 | 30 | 38 | 39 | 40 | 41 | 44 | 45 | 46 | 47 | 48 | 49 | |||
| 50 | 51 | 53 | 57 | 58 | 59 | 60 | 62 | 63 | 65 | 66 | 68 | 69 | 70 | |||
| 71 | 72 | 73 | 74 | 76 | 79 | 83 | 84 | 90 | 91 | 92 | 96 | 101 | 102 | |||
| 104 | 105 | 106 | 107 | 108 | 109 | 110 | 112 | 113 | 114 | 115 | 116 | 117 | 118 | |||
| 119 | 121 | 126 | 129 | 130 | 133 | 138 | 140 | 141 | 142 | 143 | 145 | 146 | 147 | |||
| 149 | 150 | 151 | 152 | 153 | 155 | 158 | 159 | 161 | 162 | 163 | 165 | 166 | 167 | |||
| 168 | 169 | 170 | 171 | 172 | 173 | 174 | 176 | 178 | 179 | 180 | 184 | 185 | 186 | |||
| 190 | 193 | 194 | 195 | 196 | 197 | 198 | 199 | 200 | 203 | 205 | 206 | 207 | 208 | |||
| 209 | 210 | 211 | 212 | 213 | 214 | 215 | 216 | 217 | 218 | 219 | 223 | 224 | 226 | |||
| 227 | 228 | 229 | 230 | 232 | 234 | 235 | 236 | 237 | 238 | 244 | 246 | 248 | 250 | |||
| 251 | 252 | 253 | 254 | 255 | 256 | 258 | 259 | 260 | 261 | 262 | 264 | 265 | 266 | |||
| 267 | 268 | 269 | 271 | 272 | 273 | 274 | 275 | 276 | 277 | 278 | 279 | 281 | 283 | |||
| 286 | 287 | 288 | 290 | 291 | 293 | 316 | ||||||||||
| II | 4 | 5 | 7 | 13 | 14 | 15 | 23 | 24 | 27 | 28 | 28 | 31 | 32 | 33 | 83 | 25.94 |
| 34 | 35 | 36 | 37 | 42 | 54 | 55 | 56 | 61 | 67 | 75 | 77 | 78 | 80 | |||
| 81 | 82 | 83 | 85 | 86 | 88 | 89 | 94 | 95 | 98 | 99 | 100 | 103 | 111 |
Table text extracted from the original PDF; superscript letters are shown inline. The original table image is below.
View original table image
| Soil properties | Limed soil | Un limed soil |
|---|---|---|
| pH(H2O 1:2.5) | 6.24 | 4.69 |
| Nitrogen (%) | 0.13 | 0.16 |
| Organic carbon (%) | 1.29 | 1.54 |
| Available phosphorus (mg/ kg soil) | 17.89 | 12.68 |
| Exchangeable acidity (cmol/kg) | 0.21 | 1.71 |
| Cation exchangeable Capacity (cmol (+)/ kg) | 24.99 | 21.98 |
| Exchangeable Al (meq/100g soil) | 0.09 | 1.25 |
| Exchangeable Ca (cmol(+)/kg) | 7.90 | 4.35 |
| Exchangeable Mg (cmol(+)/kg) | 3.09 | 0.78 |
| Exchangeable Na (cmol(+)/kg) | 0.07 | 0.04 |
| Exchangeable K (cmol(+)/kg) | 0.71 | 0.25 |
| Micro nutrient Zn(ppm) | 0.93 | 1.35 |
| Micro nutrient Fe(ppm) | 146.18 | 224.82 |
| Micro nutrient Mn(ppm) | 37.81 | 55.50 |
Table text extracted from the original PDF; superscript letters are shown inline. The original table image is below.
View original table image
Cluster II include eighty three genotypes and characterized by intermediate flowering and maturing date, moderately susceptible to scald and net blotch diseases, relatively lower number of fertile tillers per plant, relatively longer spike length, intermediate plant height, higher number of kernel per spike, relatively the higher thousand seed weight, hectolitre weight, grain yield per hectare and relatively higher biomass yield per hectare as compared to grand mean of genotypes. Most of these landraces were collected at an altitude group between (2001 and 3000m.a.s.l) and all zones of collections except East Harerge, East Shewa and East Tigray. Relatively genotypes better in almost all performance were grouped under cluster IX which contribute 1.56% to the population these were Miscal-21, Travller, EH 1847, HB 1964 and Ibon174/03 (Table 4). Under limed soil conditions, barley genotypes were assigned to sixteen clusters (Table 5). Numbers of genotypes per cluster varied from One hundred fifteen genotypes in cluster I to two genotypes in cluster XVI.
| Cluster | Genotypes | — | — | — | — | — | — | — | — | Total | % |
|---|---|---|---|---|---|---|---|---|---|---|---|
| I | 1 | 2 | 8 | 9 | 10 | 13 | 17 | 19 | 20 | 115 | 35.94 |
| 29 | 30 | 33 | 39 | 40 | 41 | 45 | 48 | 49 | |||
| 52 | 54 | 59 | 64 | 68 | 69 | 70 | 72 | 73 | |||
| 74 | 84 | 96 | 97 | 104 | 105 | 107 | 108 | 112 | |||
| 114 | 116 | 118 | 119 | 121 | 129 | 130 | 136 | 138 | |||
| 140 | 142 | 144 | 147 | 149 | 150 | 151 | 152 | 153 | |||
| 155 | 162 | 163 | 165 | 166 | 172 | 173 | 174 | 180 | |||
| 185 | 186 | 187 | 188 | 189 | 196 | 197 | 200 | 202 | |||
| 204 | 205 | 207 | 208 | 211 | 213 | 214 | 218 | 222 | |||
| 225 | 226 | 227 | 228 | 231 | 232 | 233 | 236 | 237 | |||
| 246 | 248 | 250 | 253 | 256 | 258 | 260 | 262 | 264 | |||
| 267 | 271 | 272 | 273 | 274 | 276 | 277 | 278 | 279 | |||
| 280 | 281 | 292 | 300 | 306 | 307 | 317 | |||||
| II | 3 | 19 | 117 | 143 | 190 | 230 | 286 | 7 | 2.19 | ||
| III | 4 | 61 | 111 | 137 | 192 | 284 | 7 | 2.19 | |||
| IV | 5 | 28 | 88 | 99 | 270 | 297 | 6 | 1.88 | |||
| V | 6 | 7 | 11 | 14 | 23 | 26 | 27 | 31 | 32 | 29 | 9.06 |
| 57 | 95 | 98 | 103 | 110 | 120 | 122 | 123 | 127 | |||
| 139 | 143 | 159 | 193 | 194 | 245 | 304 | 311 | 313 | |||
| 316 | 318 | ||||||||||
| VI | 12 | 16 | 46 | 51 | 63 | 71 | 77 | 91 | 102 | 33 | 10.31 |
| 109 | 115 | 125 | 126 | 134 | 135 | 158 | 161 | 176 | |||
| 178 | 184 | 191 | 198 | 221 | 249 | 255 | 269 | 293 | |||
| 296 | 309 | 315 |
Table text extracted from the original PDF; superscript letters are shown inline. The original table image is below.
View original table image
Cluster means (Table 7) and percent of populations in each cluster were shown in (Table 5, Figure 2). One hundred fifteen genotypes were found in cluster I, which was 35.93% of the total experimental materials. Landraces grouped under cluster I were scattered along all zones and at altitude group between (2001and 3000m.a.s.l). This cluster containing the majority of landrace from zones of Arssi, North Shewa, East Tigray and South Tigray and released varieties, followed by cluster VIII and VI ( The result above showed that number of cluster under limed is greater than number of cluster under un limed soil these was due to under unlimed soil genotypes were exposed to nutritional toxicity and deficiency that found in growing soil environments. Soil acidity could prevent barley genotypes from expressing its maximum genetic potential and plant responses affected by the stresses. Under acidic stress large number of genotypes found under similar groups owing to little variation on their quantitative traits as a result of stress. Under both unlimed and limed soil condition cluster I had larger number experimental materials which account 59.06% and 35.94%, respectively. Similarly much of the material from Arssi, South Tigray, East Tigray and North Shewa had greater contribution to cluster I but the number of genotypes under un limed was larger than that of limed soil condition. Comparatively small numbers of released varieties were found under both unlimed and limed soil condition but relatively greater number found under limed soil condition this implied that landraces ecological amplitudes may exceed those of the varieties derived from them in terms of evolution and adaptation to change in agricultural systems under specific cultural and environmental stresses [29] .
Based on the altitudinal clustering under both unlimed and limed soil condition cluster I had larger number experimental materials which account 64.16% and 37.88% respectively for total population. Under both soil conditions much of the materials grouped under altitudinal range between 2000-3000 m.a.s.l. similar results were indicated that landraces ecological amplitude may exceed those of the varieties derived from them [29] . Abiotic stress factors could prevent the plant from expressing its maximum genetic potential [30] . Altitude range between 2000-3000 m.a.s.l. was affected by soil acidity and barley genotypes collected from these areas were grouped to gather in response to stress than normal growing environments [31] . 6.9 6.9 6.9 6.9 7.1 6.9 6.9 7.0 6.9 7.0 6.9 6.9
Cluster analysis for genotypes by SSI and STI
Based on grain yield data under both soil conditions, genotypes were grouped according to their acid susceptible and tolerance index on the basis of Euclidean distances of dissimilarity. Under index cluster analysis, barley genotypes were subdivided into twelve clusters (Figure 3). The greatest number of genotype was found under Cluster VI and I had sixty five and fifty eight genotypes per cluster, respectively and characterized by high susceptibility and low tolerance index (Table 9). Cluster III, IX, XI, VII and II contained three, one, three, eight, and nine genotypes per cluster and had lower susceptible index of -5.22, -3.45, -2.06, -1.91 and -1.82, respectively for grain yield (Table 8 &9). Cluster VII and II had genotypes collected from almost all acid soil affected zones of country and released varieties and grouped under attitude groups suitable for barley production, reflecting their higher yields in the unlimed than in the limed environment, indicating that they are less vulnerable to acidic soil stress and hence acid soil tolerant. Cluster V, VIII, and XII, had high susceptible index of 3.09, 2.87 and 2.52, indicating that they were highly vulnerable to acid soil stress. These are genotypes with specific adaptation to more favourable environments and they gave higher yield under limed environment, but gave low yields under unlimed environment. Cluster XII, XI, X, IX,VIII,VII and VI contained one, three, eight, one, eight, eight and sixty five genotypes per cluster and had high tolerance index of 4.43, 3.64 , 3.35, 2.81, 2.64, 1.86 and 1.47, respectively, for grain yield, indicating that they could tolerate soil acidity stress (Table 8). The greatest number of genotype was under Cluster VI and VII. Cluster VII had genotypes collected from acid soil affected zones of Bale, South Gondar, South wello, Gurage, West Shewa, North Shewa and realised varieties and grouped under attitude groups suitable for barley production, characterized by low susceptibility and high tolerance index (Table 8, 9, 10).
| Clusters | Genotypes | — | — | — | — | — | — | — | — | Total | % |
|---|---|---|---|---|---|---|---|---|---|---|---|
| I | 1 | 2 | 3 | 4 | 5 | 6 | 7 | 8 | 9 | 58 | 18.13 |
| 10 | 11 | 12 | 15 | 16 | 17 | 18 | 19 | 20 | |||
| 21 | 23 | 24 | 25 | 26 | 27 | 28 | 29 | 30 | |||
| 31 | 32 | 34 | 35 | 37 | 38 | 39 | 40 | 42 | |||
| 44 | 45 | 46 | 47 | 48 | 49 | 50 | 51 | 53 | |||
| 54 | 55 | 56 | 57 | 59 | 60 | 61 | 62 | 63 | |||
| 64 | 66 | 68 | 71 | ||||||||
| II | 13 | 14 | 22 | 41 | 43 | 52 | 58 | 85 | 94 | 9 | 2.81 |
| III | 33 | 36 | 136 | 3 | 0.94 | ||||||
| IV | 65 | 67 | 69 | 70 | 72 | 73 | 74 | 75 | 76 | 129 | 40 |
| 77 | 78 | 79 | 80 | 81 | 82 | 83 | 84 | 86 | |||
| 87 | 88 | 89 | 90 | 91 | 92 | 93 | 95 | 96 | |||
| 97 | 98 | 99 | 100 | 101 | 102 | 103 | 104 | 105 | |||
| 106 | 107 | 108 | 109 | 110 | 111 | 112 | 113 | 114 | |||
| 115 | 116 | 117 | 118 | 119 | 120 | 122 | 123 | 124 | |||
| 125 | 126 | 127 | 128 | 129 | 130 | 131 | 132 | 133 | |||
| 134 | 135 | 137 | 138 | 139 | 140 | 141 | 142 | 143 | |||
| 145 | 146 | 147 | 148 | 150 | 151 | 152 | 153 | 154 | |||
| 155 | 156 | 157 | 158 | 159 | 160 | 161 | 162 | 163 | |||
| 164 | 165 | 166 | 167 | 168 | 169 | 170 | 171 | 172 | |||
| 173 | 174 | 175 | 176 | 178 | 179 | 180 | 181 | 182 | |||
| 183 | 185 | 186 | 187 | 188 | 189 | 191 | 195 | 196 | |||
| 197 | 199 | 202 | 204 | 207 | 209 | 210 | 217 | 219 | |||
| 221 | 252 | 284 | |||||||||
| V | 121 | 144 | 149 | 177 | 184 | 193 | 194 | 198 | 200 | 27 | 8 |
| 205 | 208 | 211 | 212 | 213 | 216 | 220 | 223 | 226 | |||
| 227 | 228 | 231 | 232 | 234 | 236 | 237 | 238 | 258 | |||
| VI | 190 | 192 | 201 | 203 | 206 | 214 | 215 | 218 | 222 | 65 | 20.31 |
| 224 | 225 | 229 | 230 | 233 | 235 | 239 | 241 | 242 | |||
| 243 | 244 | 245 | 246 | 248 | 249 | 250 | 251 | 253 | |||
| 254 | 255 | 256 | 257 | 259 | 260 | 261 | 262 | 263 | |||
| 264 | 265 | 266 | 267 | 268 | 269 | 270 | 271 | 272 | |||
| 273 | 274 | 275 | 276 | 277 | 278 | 279 | 281 | 283 | |||
| 285 | 287 | 288 | 289 | 290 | 292 | 293 | 294 | 295 | |||
| 297 | 298 | ||||||||||
| VII | 240 | 247 | 280 | 282 | 286 | 291 | 296 | 304 | 8 | 2.50 | |
| VIII | 299 | 300 | 301 | 302 | 303 | 305 | 306 | 311 | 8 | 2.50 | |
| XI | 307 | 1 | 0.31 | ||||||||
| X | 308 | 309 | 310 | 312 | 313 | 315 | 316 | 319 | 8 | 2.50 | |
| XI | 314 | 317 | 318 | 3 | 0.94 | ||||||
| XII | 320 | 1 | 0.31 |
Table text extracted from the original PDF; superscript letters are shown inline. The original table image is below.
View original table image
| Trait | Clusters | — | — | — | — | — | — | — | — | — | — | — |
|---|---|---|---|---|---|---|---|---|---|---|---|---|
| I | II | III | IV | V | VI | VII | VIII | IX | X | XI | XII | |
| SSI | 1.33 | -1.82 | -5.22 | 0.66 | 3.09 | 1.05 | -1.91 | 2.87 | -3.45 | 1.44 | -2.06 | 2.52 |
| STI | 0.35 | 0.38 | 0.43 | 0.62 | 0.97 | 1.47 | 1.86 | 2.64 | 2.81 | 3.35 | 3.64 | 4.43 |
Table text extracted from the original PDF; superscript letters are shown inline. The original table image is below.
View original table image
Principal Component Analysis
Principal component analysis was performed with the standardized mean values for each of the fourteen quantitative traits used to observe the general pattern for variation of traits and to determine relationships among traits.
Under un limed soil condition, the principal component analysis exhibited variances of 35%, 15%, 10%, 8%, 7% and 6%, for the first six principal components and accounts for about 81% of total variation. The first two principal components (PCA1and PCA2) contributed about 50.0% of the total variation (Table 11). Characters with relatively larger absolute values of eigenvector weights in principal component had the largest contribution to the variation of the genotypes into clusters, as it was normally assumed that characters with larger absolute values closer to unity within the principal component influence the clustering more than those with lower absolute values closer to zero [32] . Based on the Eigen values and Eigen vectors, it is possible to indicate which traits are mainly responsible to explain the variation [33] . The first principal component analysis (PCA1) clarified 35% of the variation. Characters with relatively greater positive weights of eigenvectors in PCA1 includes, grain yield, days to maturity, biomass yield and days to heading showed greater loading for the variation in the first principal components, Traits like incidence of scald, fertile tiller per plant, incidence of net blotch, days to emergence and spike length had smaller negative/ positive eigenvector values contributed least loadings for the first principal component. Kernel per spike, days to heading, harvest index and days to maturity had relatively larger positive contribution to the second principal component. Besides, spike length, fertile tiller per plant and thousand kernel weights had smaller negative eigenvector values contributed least loadings for the second principal component (Table 11). Under limed soil condition, the principal component analysis exhibited variances of 31%, 15%, 10%, 8%, 7% and 6%, were extracted for the first six principal components and accounts about 78% of total variation. The first two principal components (PCA1 and PCA2) contributed about 46% of the total variation. Characters with relatively greater positive weight of eigenvectors in PCA1 include biomass yield, days to maturity, days to heading and grain yield had a greater contribution to variation in PCA1. However, the incidence of scald, harvest index, incidence of net blotch and fertile tiller per plant had the least contribution to variation in PCA1. Kernel per spike, days to maturity, days to heading and harvest index had relatively larger positive contribution to the second principal component and traits spike length, fertile tiller per plant, hectolitre weight and plant height had smaller negative eigenvector values contributed least loadings for the second principal component (Table 11). The PCA based on data from stressed and non-stress treatments revealed that PCA1 account for 47.9% of variation and showed the larger loading value of yield related and morphological characters [34] . Traits such as days to heading and days to maturity and seed per spike contributed major variation and traits fertile tiller per plant had least loadings for the first principal component [35] .
| — | Unlimed | — | — | — | — | — | Limed | — | — | — | — | — |
|---|---|---|---|---|---|---|---|---|---|---|---|---|
| Variable | PC1 | PC2 | PC3 | PC4 | PC5 | PC6 | PC1 | PC2 | PC3 | PC4 | PC5 | PC6 |
| DE | 0.00 | -0.16 | -0.21 | 0.31 | 0.69 | -0.53 | 0.16 | 0.07 | 0.29 | 0.34 | 0.26 | -0.39 |
| DTH | 0.36 | 0.18 | 0.11 | 0.24 | 0.07 | 0.10 | 0.40 | 0.17 | -0.14 | 0.19 | -0.03 | 0.00 |
| DTM | 0.40 | 0.14 | 0.04 | 0.17 | 0.07 | 0.06 | 0.41 | 0.19 | -0.09 | 0.15 | 0.02 | 0.04 |
| SC | -0.34 | 0.01 | 0.20 | -0.01 | 0.07 | -0.11 | -0.33 | -0.09 | -0.18 | 0.19 | 0.00 | -0.16 |
| Net | -0.03 | -0.01 | 0.00 | -0.50 | 0.66 | 0.55 | -0.01 | -0.07 | -0.13 | -0.08 | 0.89 | -0.23 |
| FT | -0.10 | -0.44 | -0.18 | -0.23 | 0.00 | -0.28 | 0.00 | -0.41 | 0.09 | -0.23 | 0.27 | 0.56 |
| SL | 0.02 | -0.49 | 0.39 | -0.15 | -0.13 | -0.03 | 0.13 | -0.44 | -0.26 | 0.09 | -0.18 | -0.31 |
| PHT | 0.24 | -0.19 | 0.47 | -0.28 | 0.03 | -0.22 | 0.08 | -0.16 | -0.46 | -0.51 | -0.11 | -0.40 |
| KPS | 0.22 | 0.46 | 0.23 | -0.22 | 0.10 | -0.27 | 0.19 | 0.54 | -0.23 | -0.14 | 0.05 | 0.00 |
| YLD | 0.40 | -0.03 | -0.12 | -0.24 | -0.03 | -0.16 | 0.39 | 0.01 | 0.17 | -0.37 | 0.01 | 0.06 |
| BM | 0.38 | -0.12 | 0.17 | -0.03 | 0.03 | -0.09 | 0.42 | -0.08 | -0.13 | -0.08 | 0.04 | 0.22 |
| HI | 0.10 | 0.15 | -0.55 | -0.51 | -0.20 | -0.22 | -0.07 | 0.17 | 0.58 | -0.48 | -0.07 | -0.32 |
| HLW | 0.31 | -0.18 | -0.25 | 0.16 | -0.01 | 0.19 | 0.26 | -0.23 | 0.26 | 0.26 | -0.03 | -0.08 |
| TKW | 0.26 | -0.41 | -0.21 | 0.14 | -0.06 | 0.26 | 0.29 | -0.40 | 0.20 | 0.00 | -0.10 | -0.17 |
| Eigenvalue | 4.90 | 2.05 | 1.33 | 1.12 | 1.00 | 0.90 | 4.40 | 2.13 | 1.39 | 1.17 | 1.03 | 0.84 |
| Variance | 0.35 | 0.15 | 0.10 | 0.08 | 0.07 | 0.06 | 0.31 | 0.15 | 0.10 | 0.08 | 0.07 | 0.06 |
| Cumulative var (%) | 0.35 | 0.50 | 0.59 | 0.67 | 0.74 | 0.81 | 0.31 | 0.47 | 0.57 | 0.65 | 0.72 | 0.78 |
Table text extracted from the original PDF; superscript letters are shown inline. The original table image is below.
View original table image
Diversity Index
Estimates of Shannon Weaver diversity index over zones of origin and altitude groups showed high diversity index for the four qualitative traits studied. Phenotypic diversity was very high for ear Attitude (H′=1.13), kernel row number (H′=0.78) and Kernel color (H′=0.65) and comparatively spike density (H′=0.53) had low phenotypic diversity (Table 13) at zone of origin. For ear attitude, semi erect (122 genotypes) and semi re-curved (90 genotypes) had larger contribution for phenotypic diversity, contrary erect (22 genotypes) and re-curved (19 genotypes) had lower contribution for phenotypic diversity. Zonal distribution of trait ear attitude showed that North Shewa, Gurage and East Tigray had large number of genotypes with semi erect ear attitude and North Omo, North Shewa and Gurage had large number of genotypes with semi re curved ear attitude (Table 12). Phenotypic diversity was very high for Ear Attitude (1.32), Kernel color (H′=0.99) and kernel row number (H′=0.96), comparatively spike density (H′=0.65) had low Phenotypic diversity for altitude groups (Table 13). This was due to high ecological heterogeneity of the country, which was favourable condition for barley cultivation. All characters were high in phenotypic diversity over all zones of origin and altitude groups for this study. The same results were reported by Berhane and Alemayehu [36] , polymorphism was high for kernel row type (H' = 0.80), spike density (H' = 0.76) and kernel colour (H' = 0.75). Abebe and Bjornstad [37] also had The highest mean diversity index (H) pooled over traits was shown by populations from Arsi and Welega, whereas the lowest is for individual populations from Bale,Shewa, Tigray and Gamu Gofa.
| Zone | — | Row type | Spike density | Kernel color | Ear Atitude | Mean+ SE |
|---|---|---|---|---|---|---|
| Agew Awi | 0.95 | 0.9 | 0.33 | 1.5 | 0.92+0.24 | |
| Arssi | 0.97 | 0.71 | 1.09 | 1.47 | 1.06+0.16 | |
| Bale | 0.99 | 0.54 | 0.34 | 1.31 | 0.80+0.22 | |
| South Gondar | 0.99 | 0.24 | 0.76 | 1.34 | 0.83+0.23 | |
| South wello | 0.91 | 0.34 | 0.88 | 1.37 | 0.88+0.21 | |
| South Tigray | 0.74 | 0.3 | 0.65 | 1.33 | 0.76+0.21 | |
| Gurage | 0.96 | 0.99 | 0.99 | 1.19 | 1.03+0.05 | |
| Hadya | 0.59 | 0.59 | 0.86 | 1.03 | 0.77+0.11 | |
| Keficho Shekicho | 0.69 | 0.69 | 0 | 0 | 0.35+0.20 | |
| West Shewa | 0.99 | 0.26 | 0.99 | 1.24 | 0.87+0.21 | |
| East Gojam | 0.79 | 0.54 | 0.86 | 1.2 | 0.85+0.14 | |
| East harerge | 0.67 | 0.54 | 0 | 1.31 | 0.63+0.27 | |
| East Wellega | 0.78 | 0.23 | 0.83 | 1.25 | 0.77+0.21 | |
| East Tigray | 0.33 | 0.86 | 0.8 | 1 | 0.75+0.15 | |
| North omo | 0.95 | 0.52 | 1.01 | 1.19 | 0.92+0.14 | |
| North Shewa | 0.83 | 0.47 | 0.94 | 1.35 | 0.90+0.18 | |
| Released variety | 0.83 | 0.8 | 0.26 | 1.32 | 0.80+0.22 | |
| Total Mean | 0.78 | 0.53 | 0.64 | 1.13 | 0.77+0.17 | |
| Altitude class | Total | Row type | Spike density | Kernel color | Ear Atitude | Mean+ SE |
| <2000 | 38 | 0.99 | 0.59 | 0.99 | 1.33 | 0.98+0.15 |
| 2001-2500 | 94 | 0.99 | 0.71 | 0.94 | 1.38 | 1.01+0.14 |
| 2501-3000 | 119 | 0.98 | 0.71 | 0.97 | 1.38 | 1.01+0.14 |
| >3000 | 42 | 0.89 | 0.61 | 1.09 | 1.2 | 0.95+0.13 |
| Total Mean | 0.96 | 0.65 | 0.99 | 1.32 | 0.98+0.14 |
Table text extracted from the original PDF; superscript letters are shown inline. The original table image is below.
View original table image
| North Shewa | 36 | 5 | 6 | 25 | 1 | 31 | 4 | 20 | 12 | 4 | 2 | 16 | 7 | 9 | 2 |
|---|---|---|---|---|---|---|---|---|---|---|---|---|---|---|---|
| Released varieties | 27 | 13 | 1 | 13 | 1 | 16 | 10 | 25 | 2 | 8 | 10 | 4 | 5 | ||
| Total | 320 | 134 | 48 | 138 | 27 | 231 | 62 | 176 | 100 | _ 44 | 22 | 122 | 67 | 90 | _ 19 |
Table text extracted from the original PDF; superscript letters are shown inline. The original table image is below.
View original table image
| — | No of Geno | Row type | — | — | Spike density | — | — | Kernel color | — | — | Ear Attitude | — | — | — | — |
|---|---|---|---|---|---|---|---|---|---|---|---|---|---|---|---|
| 2 | Irr | 6 | Lax | Inter | Dense | White | Purple | Black | Erect | Sami erect | Horizontal | semi-recurved | Recurved | ||
| Agew Awi | 10 | 6 | 2 | 2 | 3 | 6 | 1 | 1 | 9 | 1 | 3 | 2 | 3 | 1 | |
| Arssi | 25 | 10 | 3 | 12 | 1 | 6 | 18 | 10 | 8 | _ 7 | 2 | 7 | 8 | 6 | 2 |
| Bale | 19 | 3 | 7 | 9 | 1 | 16 | 2 | 17 | 2 | 1 | 9 | 3 | 5 | 1 | |
| South Gondar | 15 | 7 | 3 | 5 | 1 | 14 | 2 | 11 | _ 2 | 1 | 7 | 2 | 4 | 1 | |
| South wello | 19 | 3 | 4 | 12 | 17 | _ 2 | 12 | 5 | 2 | 1 | 6 | 4 | 7 | 1 | |
| South Tigray | 23 | 16 | 1 | 6 | _ | 21 | 2 | 15 | 8 | 1 | 9 | 5 | 7 | 1 | |
| Gurage | 27 | 12 | 3 | 12 | _ 7 | 13 | 7 | 15 | 6 | 6 | 2 | 13 | 4 | 8 | |
| Hadya | 11 | 3 | 8 | 8 | 3 | 3 | 1 | 7 | 1 | 7 | 2 | 1 | _ | ||
| Keficho Shekicho | 2 | 1 | 1 | _ 1 | 1 | 2 | 2 | _ | |||||||
| West Shewa | 17 | 7 | 4 | _ 6 | 3 | 12 | _ 2 | 4 | _ 7 | _ 6 | _ | _ 7 | _ 6 | 2 | _ 2 |
| East Gojam | 13 | 9 | 1 | 3 | 3 | 10 | 4 | 8 | 1 | 1 | 4 | 2 | 6 | ||
| East harerge | 13 | 5 | 8 | 10 | 3 | 13 | 1 | 6 | 1 | 4 | _ 1 | ||||
| East Shewa | 1 | 1 | 1 | _ 1 | _ | 1 | |||||||||
| East Wellega | 16 | 11 | _ 4 | _ 1 | 1 | _ 15 | _ | _ 5 | 10 | _ 1 | _ | _ 6 | 4 | _ 5 | _ 1 |
| East Tigray | 20 | 18 | 2 | 2 | 13 | _ 5 | 14 | 4 | 2 | _ | 11 | 4 | 5 | ||
| North omo | 26 | 9 | _ 3 | 14 | 1 | 22 | 3 | 14 | 6 | 6 | _ | 1 | 8 | 11 | _ 6 |
Table text extracted from the original PDF; superscript letters are shown inline. The original table image is below.
View original table image
Regional diversity index
Estimate of diversity index (H') pooled over zone of origin showed high phenotypic diversity among four qualitative characters. The mean H' ranged from 0.35 for Keficho Shekicho to 1.06 for Arssi zone. Arssi, Gurage, North Omo, Agew Awi, North Shewa, South Welo, West shewa, East Gojam, South Gonder and Bale showed greater diversity index followed by Misrak harerge and Keficho Shekicho zones showed lower phenotypic diversity index (Table 13). Among all characters, Ear Attitude shows high polymorphic in all zone of origin except Keficho Shekicho, followed by kernel row number from West Shewa,South Gonder, Bale,Arssi, Gurage, Agew Awi, North Omo,and South Welo, showed high phenotypic diversity index. Genotypes from East Tigray and Hadeya showed lower phenotypic diversity index for kernel row number. Spike density from Gurage, Agew, Awi, East Tigray showed high phenotypic diversity index. Genotypes from East Welega, South Gonder, West Shewa, South Tigray, South Wello, and North Shewa showed lower phenotypic diversity index. Kernel color from Arssi, West Shewa, North Omo, Gurage, North Shewa, South Wello, Hadeya, Misrak Gojam, East Welega and East Tigray showed high phenotypic diversity index. Genotypes from Agew Awi, Bale and released varieties, showed lower phenotypic diversity index. Similarly a previous report found among all characters, kernel row number from Gonder, grain color from Gojam, Shewa, and Wellega, spike density from Arssi and Tigray showed high phenotypic diversity index [38] .
Altitudinal diversity index
Altitude groups showed high phenotypic diversity among four qualitative characters. The mean H' pooled over characters for four altitude groups varied from 1.01 for altitude between 2000 and 3000 to 0.95 for altitudes group greater than 3000 m.a.s.l with total mean value of 0.98+0.14. Altitude groups between 2500-3000 m.a.s (119 genotypes) followed by altitude groups 2001-2500 m.a.s (94 genotypes) had a large number of genotypes with the highest mean diversity index of 1.01+0.14. Ear Attitude and kernel color showed the highest altitudinal diversity index in all altitude and relatively spike density showed lower altitudinal diversity index (Table 13). Similarly reported to mean diversity index for characters increases with altitude reaching a maximum between 2400-2800 m.a.s.l and decreasing beyond that altitude [9,37,39] . This indicates high phenotypic diversity in barley was related to high rainfall and lower temperature at high altitudes, which shows barley that is a cool season crop.
According to Bedasa et al [38] difference in altitude gradient and agro ecological setting gave high diversity variation in barley genotypes and found that Kernel row number from altitude group between 2001and 3000 m.a.s.l, grain color from altitude group 1500-2000 and 2501-3000 m.a.s.l and spike density from altitude group 2501 and 3500 m.a.s.l showed the highest diversity index.
Conclusion
Soil acidity is now a serious threat to barley production in most high lands of Ethiopia. The extent of acidity is increased in 2.1% within the past three decades mainly due to increase in continuous cropping and use of acidifying fertilizers in parity with increased in demand for barley production without expansion of the cultivated area. However, the assessment of genetic diversity among barely genotypes using multivariate statistical analysis is indispensable for plant breeding purposes, since it provides selection and screening tolerant genotypes available in germplam collections.
Results from the field evaluation of barley genotypes under acidic (unlimed) and non-acidic (limed) soil condition demonstrated that there were genetic diversity between genotypes collected from different barley growing acid prone areas. Better responses of barley phonological and yield components were observed under limed environments. Acidic soil had severe impact on growth, development and genetic diversity of barley genotypes from early seedling emergence to final harvest by depleting soil nutrient and make barley growing Ethiopian highland unproductive.
Although better yield and yield components also observed under acidic environment from tolerant genotypes that gave indication of Ethiopia had wide genetic diversity of barley genotypes that could tolerance to soil acidity stress.
Acknowledgement
AcknowledgementThe authors are grateful Ethiopian Institute of Agricultural Research (EIAR) for its financial support for this research.
Figures and tables from the paper
| Altitude classes | — | — | — | — | — |
|---|---|---|---|---|---|
| Zone of collection | Class I | Class II | Class III | Class IV | Total |
| <2000 | 2001-2500 | 2501-3000 | >3000 | ||
| Agew Awi | 1 | 4 | 5 | 10 | |
| Arssi | 6 | 4 | 10 | _ 5 | 25 |
| Bale | 5 | 5 | 6 | 3 | 19 |
| South Gondar | 1 | 5 | 5 | 4 | 15 |
| South wello | 1 | 6 | 10 | 2 | 19 |
| SouthTigray | 5 | 8 | 10 | 24 | |
| Gurage | 2 | 5 | 12 | 8 | 27 |
| Hadya | 2 | 6 | 3 | 10 | |
| Keficho Shekicho | 1 | 1 | _ | 2 | |
| West Shewa | 2 | 5 | _ 8 | _ 2 | 17 |
| East Gojam | 5 | 6 | 2 | 13 | |
| Eastharerge | _ 1 | 6 | 6 | 13 | |
| EastShewa | 1 | _ | 1 | ||
| EastWellega | _ 1 | 10 | _ 5 | _ | 16 |
| East Tigray | 4 | 8 | 6 | _ 2 | 20 |
| North Omo | 3 | 5 | 15 | 3 | 26 |
| North Shewa | 4 | 10 | 11 | 11 | 36 |
| Released varieties | 27 | ||||
| Total | _ 39 | _ 94 | _ 118 | _ 42 | 320 |
Table text extracted from the original PDF; superscript letters are shown inline. The original table image is below.
View original table image
| VII | 15 | 25 | 34 | 37 | 55 | 86 | 87 | 131 | 181 | 14 | 4.38 |
|---|---|---|---|---|---|---|---|---|---|---|---|
| 201 | 241 | 243 | 247 | 257 | 263 | ||||||
| VIII | 18 | 21 | 22 | 38 | 50 | 58 | 60 | 62 | 66 | 49 | 15.31 |
| 76 | 79 | 83 | 90 | 93 | 106 | 113 | 141 | 145 | |||
| 146 | 164 | 167 | 168 | 169 | 170 | 171 | 175 | 199 | |||
| 203 | 206 | 209 | 210 | 212 | 215 | 217 | 219 | 223 | |||
| 224 | 229 | 234 | 236 | 251 | 252 | 254 | 259 | 261 | |||
| 265 | 266 | 268 | 275 | 283 | 290 | 291 | |||||
| IX | 24 | 35 | 36 | 47 | 56 | 67 | 78 | 80 | 85 | 23 | 7.19 |
| 89 | 100 | 101 | 124 | 128 | 160 | 182 | 183 | 216 | |||
| 239 | 240 | 242 | |||||||||
| X | 42 | 220 | 295 | 299 | 302 | 308 | 310 | 319 | 8 | 2.50 | |
| XI | 44 | 53 | 65 | 75 | 92 | 132 | 133 | 148 | 179 | 14 | 4.38 |
| 238 | 244 | 282 | 287 | 288 | 289 | 312 | |||||
| XII | 81 | 154 | 314 | 3 | 0.94 | ||||||
| XIII | 82 | 294 | 303 | 3 | 0.94 | ||||||
| XIV | 94 | 156 | 157 | 285 | 4 | 1.25 | |||||
| XV | 177 | 305 | 320 | 3 | 0.94 | ||||||
| XVI | 298 | 301 | 2 | 0.63 |
Table text extracted from the original PDF; superscript letters are shown inline. The original table image is below.
View original table image
| Zone | Clusters | — | — | — | — | — | — | — | — | — | — | — | — | — | — | — | Total |
|---|---|---|---|---|---|---|---|---|---|---|---|---|---|---|---|---|---|
| I | II | III | IV | V | VI | VII | VIII | XI | X | XI | XII | XIII | XIV | XV | XVI | ||
| Agew Awi | 3 | 1 | 1 | 2 | 1 | 1 | 1 | 10 | |||||||||
| Arssi | 14 | _ 1 | 1 | _ 1 | 2 | 2 | _ | _ 3 | _ | _ | _ | 1 | _ | _ | 25 | ||
| Bale | 9 | 2 | 1 | 1 | 4 | _ 2 | _ | _ | _ | _ | 19 | ||||||
| South Gondar | 3 | _ | _ 1 | _ | 2 | 3 | 4 | _ | _ 2 | _ | _ | _ | _ | _ | 15 | ||
| South wello | 7 | _ 1 | 1 | _ | 1 | 3 | _ | 4 | _ 2 | _ | _ | _ | _ | _ | _ | 19 | |
| South Tigray | 11 | 1 | 1 | _ 1 | 7 | _ 1 | _ 1 | _ | _ | _ | _ | _ | 23 | ||||
| Gurage | 5 | _ | _ | 1 | _ 3 | 1 | 5 | 3 | _ 6 | 1 | _ 1 | _ 1 | _ | _ | _ | 27 | |
| Hadya | 4 | _ | _ 1 | 1 | 1 | 2 | 2 | _ | _ | _ | _ | 11 | |||||
| Keficho Shekicho | 1 | _ | _ 1 | _ | _ | _ | _ | _ | _ | _ | _ | 2 | |||||
| West Shewa | 7 | _ | _ 2 | _ 1 | 1 | _ | _ 2 | _ 1 | _ 1 | _ | _ 1 | _ | _ | _ 1 | _ | _ | 17 |
| East Gojam | 8 | _ | 1 | _ 1 | 1 | _ | 1 | _ 1 | _ | _ | _ | 13 | |||||
| East harerge | 4 | _ 1 | _ | _ | _ | 7 | _ 1 | _ | _ | _ | _ | 13 | |||||
| East Shewa | 1 | _ | _ | _ | _ | _ | _ | _ | _ | _ | _ | _ | _ | 1 | |||
| East Wellega | 4 | _ | _ | _ | _ 3 | _ 3 | _ 2 | _ 1 | _ 1 | _ | _ 2 | _ | _ | _ | _ | _ | 16 |
| East Tigray | 11 | _ 1 | _ | _ | 2 | 1 | 5 | _ | _ | _ | _ | _ | _ | 20 | |||
| North Omo | 8 | 1 | _ | _ | 4 | 5 | _ | 3 | _ 4 | _ 1 | _ | _ | _ | _ | _ | _ | 26 |
| North Shewa | 11 | 2 | _ | _ | 1 | 6 | _ 1 | 6 | 3 | _ 4 | _ | _ | _ 1 | _ 1 | _ | 36 | |
| Rleased varieties | 4 | _ | _ 1 | 5 | 3 | _ 6 | 1 | _ 1 | _ 2 | 2 | _ 2 | 27 | |||||
| Total | 115 | _ 7 | _ 7 | 6 | 29 | 33 | _ 14 | _ 49 | _ 23 | 8 | 14 | 3 | 3 | _ 4 | 3 | 2 | 320 |
| % of population | 35.94 | 2.19 | 2.19 | 1.88 | 9.06 | 10.31 | 4.38 | 15.31 | 7.19 | 2.5 | 4.38 | 0.94 | 0.94 | 1.25 | 0.94 | 0.63 | |
| Group | Altitude Group | ||||||||||||||||
| <2000 | 15 | 1 | 3 | 2 | 13 | 1 | 1 | 36 | |||||||||
| 2001-2500 | 41 | _ 4 | _ 4 | 1 | _ 4 | 6 | 2 | 19 | 5 | _ | 5 | _ 2 | _ | _ 1 | _ | _ | 94 |
| 2501-3000 | 43 | 1 | 2 | 1 | 15 | 15 | 7 | 15 | 8 | _ 2 | 5 | _ 1 | 3 | _ 1 | _ | 119 | |
| >3000 | 12 | 2 | 2 | 5 | 3 | 4 | 5 | 7 | 4 | _ | _ | 44 | |||||
| Total | 111 | 7 | 6 | 5 | 24 | 27 | 15 | 52 | 21 | _ 2 | 15 | _ 2 | _ 1 | _ 4 | _ 1 | _ | 293 |
Table text extracted from the original PDF; superscript letters are shown inline. The original table image is below.
View original table image
| Zone | Cluster | — | — | — | — | — | — | — | — | — | — | — | Total |
|---|---|---|---|---|---|---|---|---|---|---|---|---|---|
| I | II | III | IV | V | VI | VII | VIII | IX | X | XI | XII | ||
| Agew Awi | 6 | 1 | 2 | 1 | 10 | ||||||||
| Arssi | 3 | 1 | _ | 15 | _ 2 | 4 | _ | _ | _ | _ | _ | _ | 25 |
| Bale | 2 | _ 1 | 8 | 4 | 3 | _ 1 | _ | _ | _ | _ | _ | 19 | |
| South Gondar | 2 | _ 1 | 6 | 5 | 1 | _ | _ | _ | _ | _ | 15 | ||
| South wello | _ | 7 | 2 | 9 | 1 | _ | _ | _ | _ | _ | 19 | ||
| South Tigray | _ 2 | _ 1 | _ | 3 | 4 | 13 | _ | _ | _ | _ | _ | 23 | |
| Gurage | 11 | _ 2 | 8 | 1 | 4 | _ 1 | _ | _ | _ | _ | _ | 27 | |
| Hadya | _ 1 | 10 | _ | _ | _ | _ | _ | 11 | |||||
| Keficho Shekicho | _ 1 | _ | 1 | _ | _ | _ | _ | _ | _ | _ | _ | 2 | |
| West Shewa | 6 | _ | _ | 7 | _ | _ 3 | _ 1 | _ | _ | _ | _ | _ | 17 |
| East Gojam | 4 | _ | _ | 9 | _ | _ | _ | _ | _ | _ | 13 | ||
| East harerge | _ | _ | 8 | _ 1 | _ 4 | _ | _ | _ | _ | _ | _ | 13 | |
| East Shewa | _ 1 | _ | _ | _ | _ | _ | _ | _ | _ | 1 | |||
| East Wellega | 11 | _ 2 | _ | _ 3 | _ | _ | _ | _ | _ | _ | _ | _ | 16 |
| East Tigray | 4 | 1 | _ | 1 | _ 8 | _ 6 | _ | _ | _ | _ | _ | _ | 20 |
| North omo | _ | 24 | 1 | 1 | _ | _ | _ | _ | _ | _ | 26 | ||
| North Shewa | _ 5 | _ 1 | _ | 17 | 4 | 8 | _ 1 | _ | _ | _ | _ | _ | 36 |
| Rleased varieties | _ | 4 | 2 | _ 8 | _ 1 | _ 8 | _ 3 | _ 1 | 27 | ||||
| Total | _ 58 | _ 9 | _ 3 | _ 129 | _ 27 | 65 | 8 | 8 | 1 | 8 | 3 | 1 | 320 |
Table text extracted from the original PDF; superscript letters are shown inline. The original table image is below.
View original table image
References
39 in the original paper- CSA (Central Statistical Agency). Agricultural sample survey: area and production of major crops, meher season. Addis Ababa, Ethiopia. 2021, I.
- Berhane Lakew, Hailu Gebrea, Fekadu Alemayehu. Barley production and research. In G. Hailu and J. van Leur (eds.). Barley Research in Ethiopia. Past work and future prospects. Proceedings of the First Barley Review work shop, 16-19 October 1993, Addis Ababa: IAR/ICARDA. 1996.
- Muluken Bantayehu. Study on malting barley genotypes under diverse agro ecologies of north western Ethiopia: Adet agricultural research centre, p. O. Box 08, bahirdar, Ethiopia. 2013.
- Desta Beyene. Effects of liming and nitrogen and phosphorus fertilizers on grain yield of barley. Ethiopian Journal of Agricultural Science. 1987;9:1-13.
- Taye Bekele, Höfner W. Effects of different phosphate fertilizers on yield of barley and rapeseed on reddishbrown soils of the Ethiopian highlands. Fertilizer Research. 1993;34:243-250.
- Bona L, Wright RJ, Baligar VC, Matuz J. Screening wheat and other small grains for acid soil tolerance. J. Landscape and Urban Planning. 1993;27(2-4):175-178.
- Abebe Demissie. Regional strategy for the ex situ conservation of plant geneti resources: Eastern Africa. Eastern Africa Plant Genetic Resources Network (EAPGRN). 2006.
- Harlan JR. On the origin of barley. In Barley: Origin, Botany, Culture, Winter Hardiness, Genetics, Utilization & Pests, USDA Agricultural Handbook 1968;338:12-34.
- Adugna Abdi. Barley genetic resources collection and conservation in Ethiopia In: Mulatu, B. and Grando, S. (Eds.).Barley Research and Development in Ethiopia. Proc. the 2nd National Barley Research and Development Review Workshop. November 28-30, 2006. HARC, Holetta, Ethiopia. 2011, 19.
- Ermias Abate, Shimelis Hussien, Mark Laing, Fentahun Mengistu. Aluminium toxicity tolerance in cereals: Mechanisms, genetic control and breeding methods. Academic journal. 2013;8(9):711-722.
- Khan M, Khan A, Nisar M. Diversity in commercial Trifolium repens reported from using biochemical markers (SDS-PAGE). Int. J. Adv. Res. 2014, 2.
- Tewari SN. Studies in genetic divergence in barley (Hordeum vulgare L.). In H. Gaul (ed.) Barley Genetics III. Verlag Karl Thiemig, Munchen. 1975, 821-831.
- Dan Pennock, Thomas Yates. Soil Sampling Designs. M.R. Carter and E.G. Gregorich (eds.). Soil Sampling and Methods of Analysis.2nd edtion. Taylor & Francis Group. united ststeof America. 2006, 30-34.
- Pam H, Brian M. Interpreting Soil Test Results; University of Technology, Sydney (UTS), Department of Infrastructure, Natural Resources & Planning: CSIRO Publishing. 2007,59-63.
- Chapman H. Cation Exchange Capacity. In: Black, C.A. et al., (ed.), Methods of Soil Analysis, Part 2 - Chemical and Microbiological Properties. Am. Soc. Agron., Inc., Madison Wisconsin. 1965, 891-901.
- Abbott TS. BCRI soil testing methods and interpretation NSW Agriculture and Fisheries, Rydalmere, NSW. 1989.
- Alatas J, Tasdilas CD, Sgouras J. Comparison of two methods of lime requirement de Baize, D. 1993. Soil Science and analysis. A guide to current use, John Wiley and sons Ltd, West Sussex. 201pp. termination. Commun. J. Soil Sci. Plant Anal. 2005;36:183-190.
- Bruce R, Hoskins. Soil testing handbook for professionals in agriculture, horticulture, nutrient and residuals management. 3rd edition. University of Maine. 1997, 27.
- Saari EE, Prescott JM. A scale for appraising the foliar intensity of wheat diseases. Plant Disease Reporter. 1975;59:377-380.
- Fisher RA, Maurer R. Drought resistance in spring wheat cultivar Grain yield responses. Aust J Agric Res. 1978;29:897-912.
- Fernandez GCJ. Effective selection criteria for assessing plant stress tolerance. Crop Sci. 1992;28:136.
- IPGRI. Descriptors for barley (Hordeum vulgare L.). International Plant Genetic Resources Instit. (IPGRI), Rome (Italy). 1994.
- SAS Institute Inc. SAS/STAT, Statistical Software. Version 9.1.3, SAS Institute Inc., Cary, North Carolina, U.S.A. 2004.
- Baize D. Soil Science and analysis. A guide to current use, John Wiley and sons Ltd, West Sussex. 1993, 201.
- Landon JR. Booker tropical soil manual, Hand Book for soil survey and Agricultural land evaluation in Tropics and sub-tropics. Longman. New York. 1991, 74.
- Effiong G, Isirimah N, Eshiet E. Influence of liming on extractable phosphorus. Growth and Yield of Okra (Abelmoschus esculentus (L.) Moench). Nigerian J. Agric., Food and Environ. 2006;3:131-134.
- Tenaye Sisay, Tesfaye Balemi. Screening of Barley Cultivars (Hordeum vulgare ssp. vulgare L.) for Acid Soil Tolerance Under Greenhouse Condition. Ethiop. J. Appl. Sci. Technol. 2014;5(1):58-84.
- Ellis R, Foster B, Handley L, Gordon D, Russell J, Powell W. Wild barley: a source of genes for crop improvement in the 21st century. J. Exp. Bot 2000;51:9-17.
- Kneupffer H, Terentyeva I, Hammer K, Kovaleva O, Sato K. Ecogeographical diversity a Vavilovian approach. In: von Bothmer, R., van Hintum, T., Kneupffer, H. (Eds.). In: Diversity in Barley (Hordeum vulgare). Developments in Plant Genetics and Breeding, Elsevier, Amsterdam. 2003;7:53-76.
- Luigi Cattivelli. Abiotic stresses in barley: problems and solutions. Barley: improvement, production, and uses. 2011, 9.
- Ethiosis. Soil fertility mapping and fertilizer blending. Agricultural Transormation Agency (ATA) Report, Ethiopia soil information system (Ethiosis).Ministry of Agriculture, Addis Ababa. 2014.
- Chahal GS, Gosal SS. Principles and procedures ofplant breeding: biotechnological and conventional approaches. Narosa Publishing House, New Delhi. 2002.
- Johnson RA, Wichern DW. Applied Multivariate Statistical Analysis. Prentice-Hall, Upper Saddle River, NJ. 2002.
- Ivandic V, Hackett C, Zhang Z, Staub J, Nevo E, Thomas W et al. Phenotypic responses of wild barley to experimentally imposed water stress. J. Exp. Bot. 2000;51:2021-2029.
- Tigist Dejene, Andrea MB, Jens L. Morphological diversity of ethiopian barleys in relation to geographic regions and altitudes. Hereditas. 2010;147:154-164.
- Berhane Lakew, Alemayehu Assefa. Advances and experiences in barley landrace improvement in Ethiopia. In: Mulatu, B. and Grando, S. (Eds.). Barley Research and Development in Ethiopia.Proc. the 2nd National Barley Research and Development Review Workshop. November 28-30, 2006. HARC, Holetta, Ethiopia. 2011, 31-46.
- Abebe Demissie, Bjornstad A. Geographical, altitude and agro-ecologica differentiation of isozyme and hordein genotypes of landraces barley from Ethiopia: implication to germplasm conservation. J. Genetic Res. crop Evol. 1996;44:43-55.
- Bedasa Mekonnon, Berhane Lakew, Tadesse Dessalegn. Morphological diversity and association of traits in ethiopian food barley (Hordeum vulgare l.) landraces in relation to regions of origin and altitudes. Journal of Plant Breeding and Crop Science. 2014;7(2):44-54.
- Engles JMM. Genetic diversity in Ethiopia barley in relation to altitude. J.Genet. Resour. Crop Evol. 1994;41:67-73.
Cited by 3
From OpenAlex, OpenCitations and reference lists read by Scinovex
- Exploring barley (Hordeum vulgare L.) tolerance to acid soil/Al3+ toxicity using morphological, molecular, and omics techniques: a systematic review ↗
Yilkal Bezie, Mulugeta Atnaf, Mengistie Taye · Euphytica · 2025
❝ 3 - Optimization and conformational study to increase nutrients and biofuel content in the extract of sorghum's plant augmented by nano NPK and zeolite ↗
Mastu Patel, Prasann Kumar, Sudhir Kumar Upadhyay · Biomass and Bioenergy · 2025
❝ 3 - Multivariate analysis of agro-morphological traits to unlock the genetic divergence of Ethiopian cultivated barley (Hordeum vulgare L.) genotypes ↗
Alemayehu Zewodu, Delessa Angassa, Gizie Abeje Belay, Gerezgiher Mekonen Gebrhud, Jemal Mohammed, Getu Tulu · Discover Plants. · 2026
Barley is a prominent cereal crop and a center of diversity in Ethiopia, with a huge collection in the genebank. However, its productivity in the country remains low due to the underutilization of the available genetic resources. Thus, the study aimed to explore the genetic divergence and association of agro-morphological traits and identify the highest-performing barley genotypes through multivariate analysis.…
❝ 0PDF