
Research article · 2022 · Full text
International Journal of Agriculture Extension and Social DevelopmentPerformance evaluation of improved hybrid and open pollinated maize varieties in potential maize producing area of Benishangul Gumuz region
Volume 5(1) · Pages 07–09 · DOI: 10.33545/26180723.2022.v5.i1a.116 ↗
Research areasGenetics and Plant BreedingCrop Yield and Soil Fertility
Abstract
Author-writtenDuring the main rainy season, seven maize genotypes were planted in RCBD with three replications each in a 5 meter by. 25 meter (row) plot to evaluate adaptation performance and identify high-yielding and moisture stress tolerant genotypes adapted to Kumruk district in order to increase net national crop production in general and product diversification in maize benishangul gumuz in particular. The analysis of variance revealed that genotypes in the test differed significantly at the (p=0.05) probability level for all traits, and the maize grain yield mean value comparison or mean separation result revealed that genotype BH-549 is superior to others with 87.4qt/ha quintals grain yield per hectare value, followed by MHQ-138 and MH-140 genotypes with 70.1 and 62.7 quintals grain yield per hectare value. The superior genotype BH-549 outperformed the other genotypes by 142.78 percent and 74.8 percent, respectively, according to the productivity criterion.
Summary
Source-checkedPlain-language reading of the full paper, prepared with AI and checked against the text. Each point links to the authors' own words.
Why it matters
- Maize is the second most significant commodity crop in Ethiopia based on the area it covers, trailing only tef. View evidence ↗
- Developing new crop varieties is essential for food security and increasing agricultural output, especially as climate change increases the need for adapted crops. View evidence ↗
- The study was initiated to address yield losses caused by moisture stress from erratic rainfall and to provide suitable crop materials to local farmers. View evidence ↗
The question
- The research aimed to identify maize genotypes adapted to the Kumruk district that are high-yielding and tolerant to moisture stress. View evidence ↗
What they did
- Seven maize genotypes were tested during the main rainy season using a randomized complete block design (RCBD) with three replications in plots measuring 5 by 25 meters. View evidence ↗
- The tested genotypes included four hybrids (BH546, BH549, MH-140, MHQ-138) and three open-pollinated varieties (MOPV-2, MOPV-6Q, MOPV-4). View evidence ↗
- The researchers measured several traits, including plant height, ear height, total ears per plant, ears per plot, and grain yield. View evidence ↗
- Data were analyzed using SAS for analysis of variance, and significant means were separated using the least significant difference (LSD) at a 5% probability level. View evidence ↗
What they found
- The analysis of variance showed that the tested genotypes differed significantly across all measured traits at the p=0.05 level. View evidence ↗
- Following BH-549, the next highest yielding genotypes were MHQ-138 (7.01 t/ha or 70.1 qt/ha) and MH-140 (6.27 t/ha or 62.7 qt/ha). View evidence ↗
- The lowest grain yield was recorded for the MOPV-4 variety, at 3.82 t/ha. View evidence ↗
- BH-549 had the greatest plant height, though it was not statistically different from MH-140 and MOPV-2, while BH-545 was the shortest. View evidence ↗
- BH-549 produced more than double the number of ears per plant compared to MOPV-4. View evidence ↗
What it means
- The authors conclude that there is significant phenotypic diversity among the varieties, indicating a need for further research. View evidence ↗
Visual summary
2 visualsIllustrations explain the paper; charts are replotted from the paper's own table values.
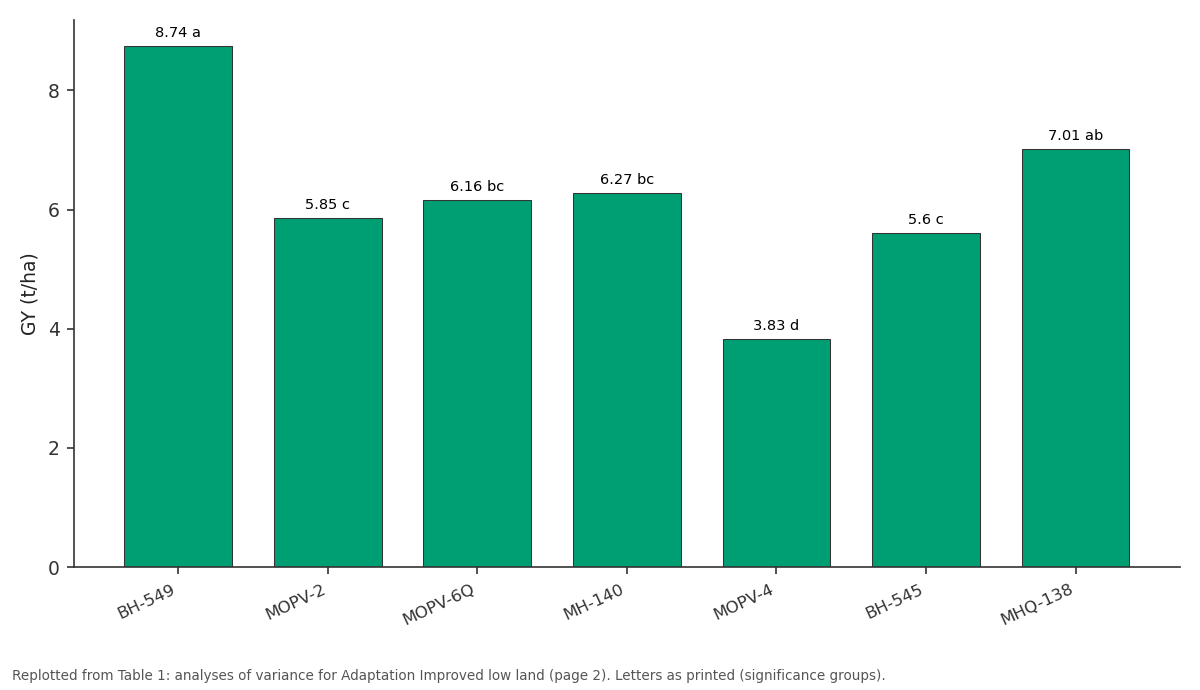
GY (t/ha): BH-549 vs MOPV-2 vs MOPV-6Q vs MH-140 vs MOPV-4
Replotted from Table 1 (page 2) of the original paper. Every bar is the paper's own table value.
View source evidence ↗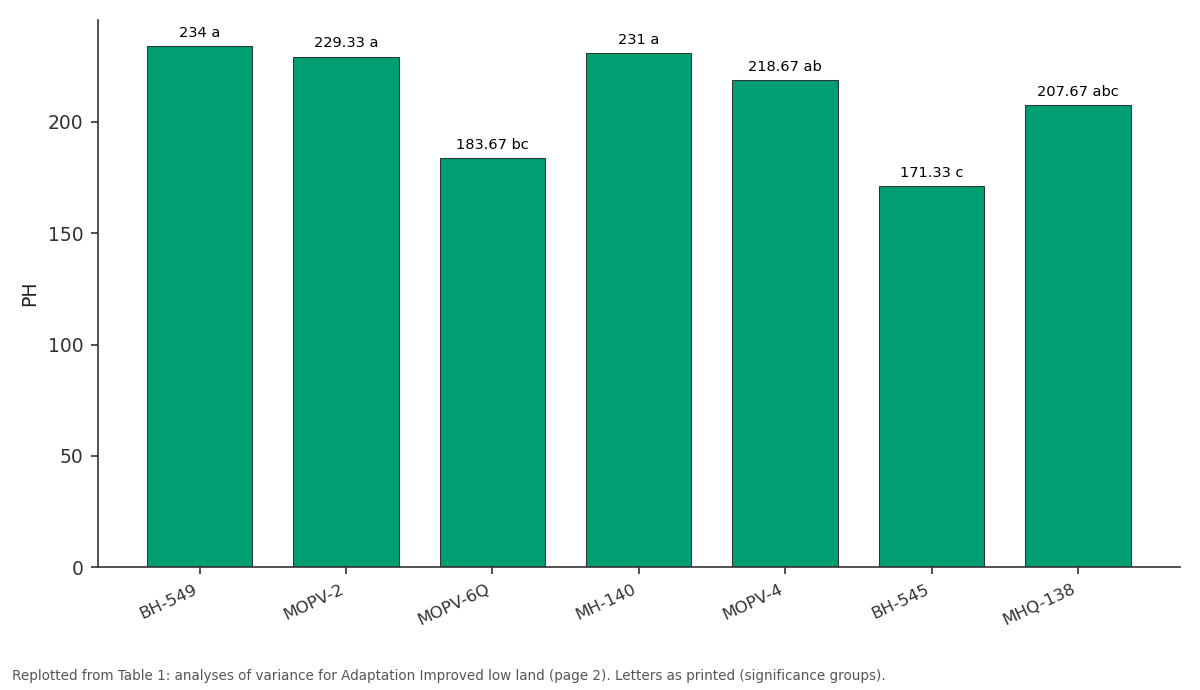
PH: BH-549 vs MOPV-2 vs MOPV-6Q vs MH-140 vs MOPV-4
Replotted from Table 1 (page 2) of the original paper. Every bar is the paper's own table value.
View source evidence ↗Figures & tables
From the original paper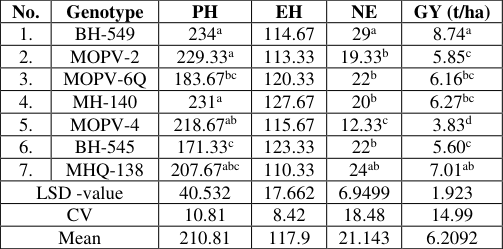 Table 1
Introduction
Ethiopia has been growing maize for almost 500 years (Alemu et al., 2012) [1] . It can be found growing in all parts of Ethiopia. Since 1985, a million hectares of land have generated roughly 17 million quintals of maize every year (Belete, 2020) [2] . Benishangul-Gumuz was previously regarded as a vital growth corridor for the country due to its wide and fertile territory. Several investors have previously worked in commercial farming, producing a range of cash crops for export, such as sesame and groundnuts (Chemura et al., 2021) [5] . Every year, even small-scale farmers used to produce surpluses. Residents were largely unaware of government safety-net initiatives. Maize (Zea mays L.) is the second most important commodity crop in terms of area coverage, after only tef. The southern, western, and south-western regions, as well as the Hararge highlands in the east, are the main producing regions (Yami et al., 2020) [14] . The majority of maize is consumed by humans (Dilnesaw et al., 2019) [7] . In terms of yield per unit area, maize is the most productive crop (Westengen et al., 2019) [13] . Over the last 30 years, the area of maize hectares has steadily expanded, while the acreage of other cereals has dropped (Mutta et al., 2011) [11] . Maize study in Ethiopia dates back to 1952, when it began at Jima Junior Agricultural College (Westengen et al., 2019; Eticha, 2020) [13,8] . There are four agro-ecologies being studied at the moment: mid-altitude sub-humid, mid-altitude moisture stress, highland sub-humid and lowland sub-humid, each with its own research facilities (Terefa, 2017) [12] . The research team includes experts in breeding, agronomy, entomology, pathology, weed science, soil science, agricultural economics, and farming systems research, as well as research and extension collaboration. Four improved populations and three hybrids were suggested for production. There is a lot of potential for maize production in Ethiopia's highlands and lowlands if the right varieties are developed. Irrigation potential and the exploitation of bimodal rainfall patterns in the Southern and Eastern areas are two more possibilities. Crop development is critical for improving agricultural output and ensuring food and nutrition security. Climate change is exacerbating the demand for new crop kinds. To keep up with constantly changing climate conditions, farmers must replace crop varieties with better-adapted kinds (Hellin et al., 2014) [9] . Where acceptable modern varieties do not exist, suitable farmer varieties are required ("variety" refers to all farmed materials in this context). The issue of variety replacement has yet to be successfully addressed. One proposed remedy is to enhance variety availability by speeding up crop breeding, removing older varieties from the seed supply chain, and aggressively promoting new varieties to farmers. We were proposed this activity to solve moisture stress that has been caused by erratic rainy type causing yield losses in the area and to address those materials to the local farmers.
Materials and Methods
Materials and Methods
Description of the study area
Agro-climatically, the Kurmuk district is divided into two zones: hot to warm moist lowland plain and hot to warm www.extensionjournal.com sub-humid lowland plain. This subzone's topography is mostly flat with few undulations. The average annual rainfall is between 800 and 1200 mm. The average annual temperature ranges from 25 to 30 degrees Celsius. The growth phase lasts between 121 and 180 days. The district lies between 10° 31' 59" N latitude and 34° 16' 59" E longitude, with elevations ranging from 500 to 1200 meters above sea level. It lies roughly 800 kilometers west of Addis Ababa in the direction to the north. It can be found in the Assosa Zone of the Benshangul gumuz Region, in the plain lands of the lower bordering Sudan. Nitosols, which are clay loam in nature, are thought to be the soil.
Design Used and Treatment Details
The design used was randomized complete block (RCB) design having three replications. The RCBD was row column arrangement for electronic data capturing with in which the plot has two rows and the column and the replication or the block are the same. There were fourteen rows (plot). The number of plants row -1 was 22 (twenty two). Plant spacing was 75cm and 25cm between row and plant, respectively. The Space between plots and blocks were 0.5m and 1.5m, respectively. The seed rate was 25 kgha -1 . The fertilizer rate was 125 kgha -1 NPS at planting and application of 189kgha -1 of Urea in 2 splits that is 1/2 at planting and 1/2 at knee height. The experiment consisted of seven improved maize varieties considering BH545 as standard check to low land (500-1500 m.a.s.l) area of the selected farms. The treatments were Hybrids:-BH546, BH549, MH-140, MHQ-138 and OPVS (Open Pollinated Varieties): MOPV-2, MOPV-6Q, and MOPV-4.
Data Collection and Analysis
Plant height (cm), ear height (cm), total number of ears plant-1, number of ears per plot, and grain yield were all measured (kgha -1 ). SAS was used to do statistical analysis of variance on the acquired data for each character (SAS Institute, 20014). At a 5% probability level, significant means were separated using the least significant difference (LSD 0.05).
Data collection compresses
Days to 50% anthesis: the number of days from emergence to when 50% of the plants started shedding pollen. Days to 50% silking: the number of days from emergence to when 50% of the plants in the plot produced 3cm long silk. Days to 75% maturity: the number of days from emergence to when 75% of the plants in the plot reached physiological maturity.
Heights of five randomly taken plants from each plot measured from the ground level to the base of tassel and the average was recorded.
Ear heights of five randomly taken plants from each plot were measured from Number of ears per plant: number of ears per plant from five randomly taken plants of each plot was counted and the average was recorded. Ear length (cm): Length of five randomly taken ears from each plot was measured using centimeter and the average was recorded Ear diameter (cm): Diameter of five randomly taken ears from each plot was measured using calliper and the average was recorded.
Number of kernels per row:
The number kernels per row from five randomly taken ears per plot were counted and the mean was recorded.
Number of rows per ear:
The number of rows/ear from five randomly taken ears from each plot was counted and the mean was recorded. 1000 kernel weight: Thousands of kernels from each plot were counted by automatic seed counter and were weighed using a sensitive balance after adjusting the moisture content to 12.5%.
The yield of grain of each plot was weighed and adjusted to 12.5% moisture. Adjusted yield per plot= (FW×0.81) × (100-MMR)/ (100-12.5) Grain yield (kg/ha): this was calculated by converting plot yield into hectare basis. GY= (Yield per plot (g) / Plot size) X 10000 m
Results and Discussion
Rainfall and Temperature Rainfall distribution in 2020 was not uniform or irrational, as is common. For example, it rained for at least three weeks throughout sowing season. Pollen loss and silking stress can reduce yields more than any other stage of crop development. (Dilnesaw et al., 2019) [7] . When the plant is very dehydrated, any silks that do emerge may soon desiccate, rendering the plant pollen-insensitive (Mutta et al., 2011) [11] . High temperatures can cause problems even when soil moisture is adequate, and they will worsen problems in drought-stressed maize, particularly during pollination and kernel development (Dawit et al., 2014; [6] Westengen et al., 2019 [13] ; Chemura et al., 2021) [5] .
Number of ear:
The number of ears produced was influenced by the variety, with MOPV-4 producing the most (29) and being the shortest (MOPV-4). The number of ears per plant varied greatly depending on the variety, according to the statistical analysis of variance. The BH549 variety produced more than 100 percent more ears per plant than MOPV-4, according to the mean values of the number of ears per plant in Table 1. It's probable that the genetic variances between the two types are to blame Dawit and Bedru et al. [6] (Beshir; Alemu et al., 2012) [1] revealed how the number of ears per plant is determined by genetics.
| No. | Genotype | PH | EH | NE | GY (t/ha) |
|---|---|---|---|---|---|
| 1. | BH-549 | 234a | 114.67 | 29a | 8.74a |
| 2. | MOPV-2 | 229.33a | 113.33 | 19.33b | 5.85c |
| 3. | MOPV-6Q | 183.67bc | 120.33 | 22b | 6.16bc |
| 4. | MH-140 | 231a | 127.67 | 20b | 6.27bc |
| 5. | MOPV-4 | 218.67ab | 115.67 | 12.33c | 3.83d |
| 6. | BH-545 | 171.33c | 123.33 | 22b | 5.60c |
| 7. | MHQ-138 | 207.67abc | 110.33 | 24ab | 7.01ab |
| LSD -value | 40.532 | 17.662 | 6.9499 | 1.923 | |
| CV | 10.81 | 8.42 | 18.48 | 14.99 | |
| Mean | 210.81 | 117.9 | 21.143 | 6.2092 |
Table text extracted from the original PDF; superscript letters are shown inline. The original table image is below.
View original table image
Grain Yield
Grain yield was highly (p<0.05) affected by variety. As indicated in Table 1, the maximum mean value of grain yield (8.7 t ha -1 ) was obtained from BH549 variety whereas minimum grain yield (3.82 t ha -1 ) was obtained from MOPV-4 (Table 1) as already known the hybrid is more prolific than open pollenated one (Kodamaya et al., 2007; Mutta et al., 2011; Beyene et al., 2016; Yami et al., 2020) [10, 11, 4, 14] .
Conclusion and Recommendation
This suggests that there is a lot of phenotypic diversity and that all types differ in terms of the features they provide, signalling that more research is needed. The grain yield mean value per hectare in tons for BH549 was substantially higher (8.74), followed by MHQ-138 (7.01) and MH-140 (6.27). As can be observed, the majority of the varieties produce more than their test area. This could be related to high temperatures hastening physiological processes, as well as the clay nature of the soil, which has a higher potential for water-holding capacity, supplying enough moisture when there is a water shortage.
References
9 in the original paper- Alemu D, Ayele G, Behute B, Beyone Y, Dewana R, Fekadu B, et al. Cereals Availability Study in Ethiopia, 2008. Development of a Spatial Equilibrium Modeling Approach to Study the Impact of Policy Intervention on Cereals Availability; c2012. Doi: 10.2788/14890.
- Belete AS. Analysis of technical efficiency in maize production in Guji Zone: Stochastic frontier model. Agriculture & Food Security. 2020;9(1):1-15.
- Chemura A, Yalew AW, Gornott C. Quantifying Agroforestry Yield Buffering Potential Under Climate Change in the Smallholder Maize Farming Systems of Ethiopia. 2021;3:1-14.
- Dilnesaw Z, Ebrahim M, Getnet B, Mequaninnet Y. Evaluation of Maize (Zea mays L.) Variety Adaptation Performance at Omo Kuraz Sugar Development Project South Omo Zone, SNNPRs, Ethiopia. International Journal of Advanced Multidisciplinary Research. 2019;6(4):13-20. Doi: 10.22192/ijamr
- Eticha AB. Contributing factors of maize production using multiple linear regressions in mizan-aman district, bench-shako zone, Southwest of Ethiopia. Open Journal of Plant Science. 2020;5(1):40-55.
- Hellin J, Bellon MR, Hearne SJ. Maize Landraces and Adaptation to Climate Change in Mexico. Journal of Crop Improvement. 2014;28(4):484-501.
- Mutta D, Kefri PO, Pwani MP. Paper prepared for the UNU-IAS workshop on Indigenous Peoples, Marginalised Populations and Climate Change: Vulnerability, Adaptation and Traditional Knowledge, Mexico. 2011;1:1-16.
- Westengen OT, Haug R, Guthiga P, Macharia E. Governing Seeds in East Africa in the Face of Climate Change: Assessing Political and Social Outcomes. Frontiers in Sustainable Food Systems. 2019;3:53. Doi: 10.3389/fsufs.2019.00053
- Yami M, Meyer F, Hassan R. The impact of production shocks on maize markets in Ethiopia: implications for regional trade and food security. Agricultural and Food Economics. 2020;8(1):5.