
Research article · 2022 · Full text
International Journal of Horticulture and Food ScienceAssessing the dietary intake among pregnant women attending layeni primary health care in Ajegunle Apapa Lagos state in their second and third trimester
Volume 4(1) · Pages 98–104 · DOI: 10.33545/26631067.2022.v4.i1b.91 ↗
Research areasChild Nutrition and Water Access
Abstract
Author-writtenBackground: Pregnancy is a physiological condition in which a woman carries and nurture a developing embryo or fetus as the case may be according to the age in her uterus. Objective: This Study Assessed. The Dietary Intake of Pregnant Women Attending, Layeni Primary Health Care in Ajegunle Apapa Lagos State in their Second and Third TrimesterMethod: A cross sectional study design was adopted to address the research problems. The study was designed to determine the nutritional knowledge of pregnant women in the study area. A well-structured questionnaire was used to collect data from 195 respondents. Data were analyzed using the SPSS version 20 to determine the mean with their standard deviation, frequencies, and percentages as well as drew chart. Results: The analysis showed that most of the respondents (93.3%) were in their third trimester, 54.9% were between the ages of 20-30 years, 57.4% had children between ages 1-3 years. A larger percentage of (91.8%) had gave birth to their child at the clinic and only 9.7% attended antenatal clinic sixteen (16) times and above. The Yoruba’s constituted the main population of 74.4%. There were more Christians than Muslims as 55.9% were Christians and 42.6% were Muslims. Results also indicated that 36.9% were artisans, 17.9% were traders, 16.9% were housewife, and 13.3% were students. 39% had secondary school education, showing that majority of the respondents had secondary education Majority of the respondents earned less than 30,000 per month. Mean nutritional knowledge score was 42.8+ 6.9 and only 29.2% had good knowledge. 10.3% of the respondents had low dietary intake, 46.2% had moderate dietary intake, 43.6% had high dietary intake. The result of hypothesis 1 showed there was a significant relationship between the nutritional knowledge and dietary intake of the pregnant women at P=0.001. However, about 68.7% practice food taboo based on family history. Conclusion: The increased in Low Nutritional knowledge in this study intensify great need for nutrition counselling in antenatal clinics in urban and rural places in Nigeria to help teach pregnant women on the significance of healthy food choice throughout pregnancy which is key in healthy pregnancy and growth of the child.
Summary
Source-checkedPlain-language reading of the full paper, prepared with AI and checked against the text. Each point links to the authors' own words.
Why it matters
- Under-nutrition during pregnancy is a critical issue because it can lead to impaired intrauterine growth and low birth weight in newborns. View evidence ↗
- Conversely, over-nutrition and excessive weight gain during pregnancy increase the risk of gestational diabetes, macrosomia, and various delivery complications. View evidence ↗
The question
- The study aimed to assess the dietary intake of pregnant women in their second and third trimesters attending the Layeni Primary Health Care center in Ajegunle Apapa, Lagos. View evidence ↗
What they did
- The researchers used a cross-sectional survey design conducted at the Layeni Primary Health Care center in the Ajeromi Ifelodun Local Government area. View evidence ↗
- Data were collected from 195 pregnant women selected via random sampling using a structured questionnaire. View evidence ↗
- The analysis was performed using SPSS version 20, employing descriptive statistics and Pearson correlation to examine the relationship between nutritional knowledge and dietary intake. View evidence ↗
What they found
- Regarding dietary intake, 10.3% of respondents had low intake, 46.2% had moderate intake, and 43.6% had high intake. View evidence ↗
- A statistically significant positive relationship was found between the nutritional knowledge of the pregnant women and their dietary intake (p=0.001). View evidence ↗
- A majority of the respondents (68.7%) reported practicing food taboos based on their family history. View evidence ↗
- Disease conditions, specifically diarrhea, heartburn, nausea, and vomiting, influenced the dietary intake of 80.5% of the respondents. View evidence ↗
- Common food frequencies included cereals consumed daily by 47.7% of women, and white tubers/roots and legumes/fats/oils consumed thrice weekly by 49.7% and 45.6% respectively. View evidence ↗
What it means
- The authors conclude that there is an urgent need for nutrition counseling in Nigerian antenatal clinics, particularly in the early stages of pregnancy, to improve healthy food choices. View evidence ↗
Visual summary
1 visualsIllustrations explain the paper; charts are replotted from the paper's own table values.
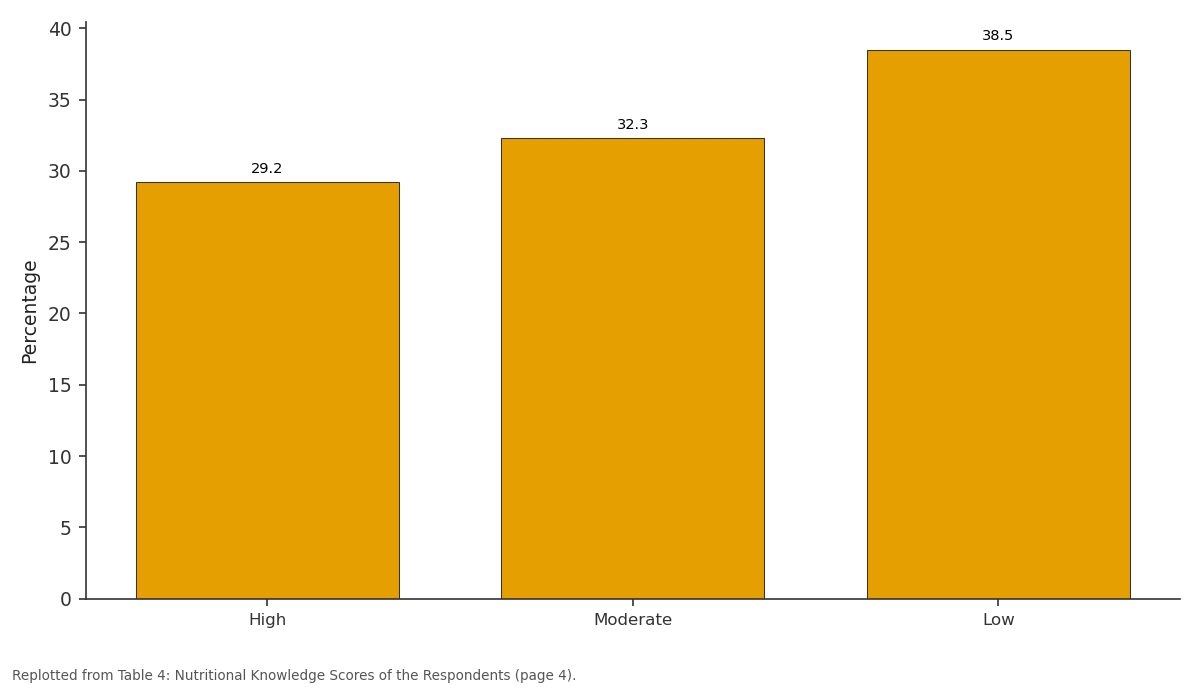
Percentage: High vs Moderate vs Low
Replotted from Table 4 (page 4) of the original paper. Every bar is the paper's own table value.
View source evidence ↗Figures & tables
From the original paper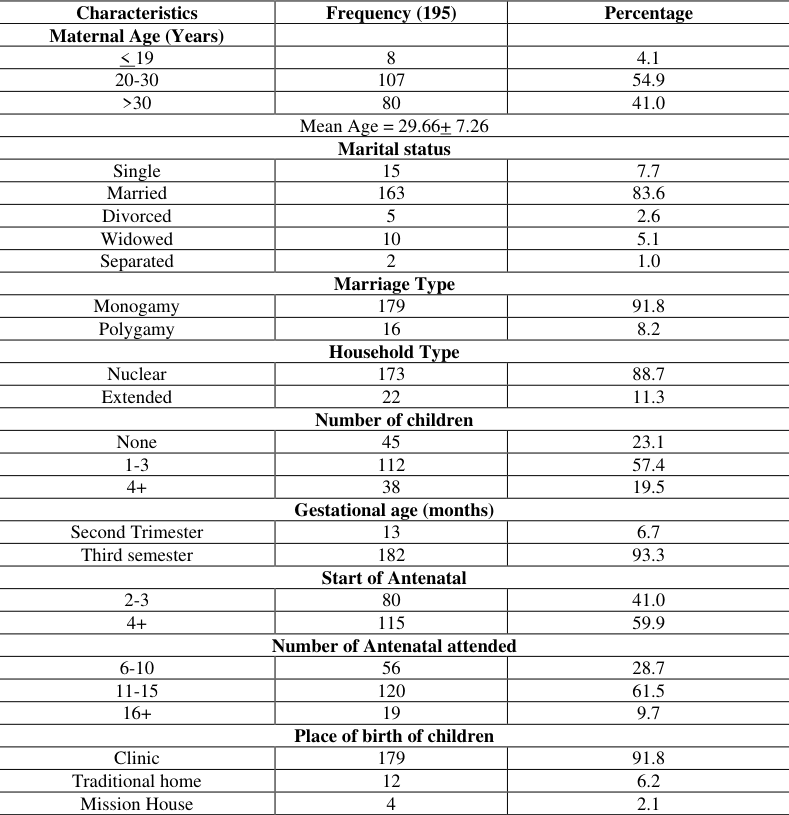 Table 1
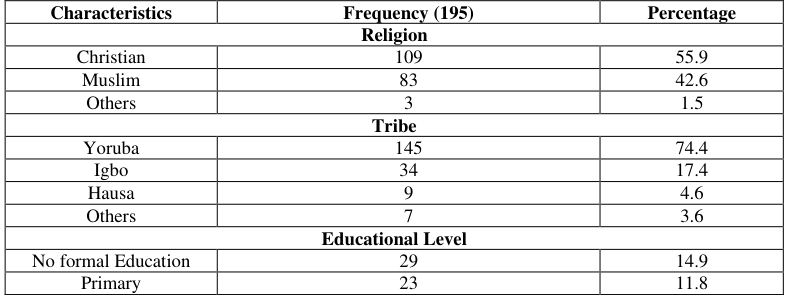 Table 2
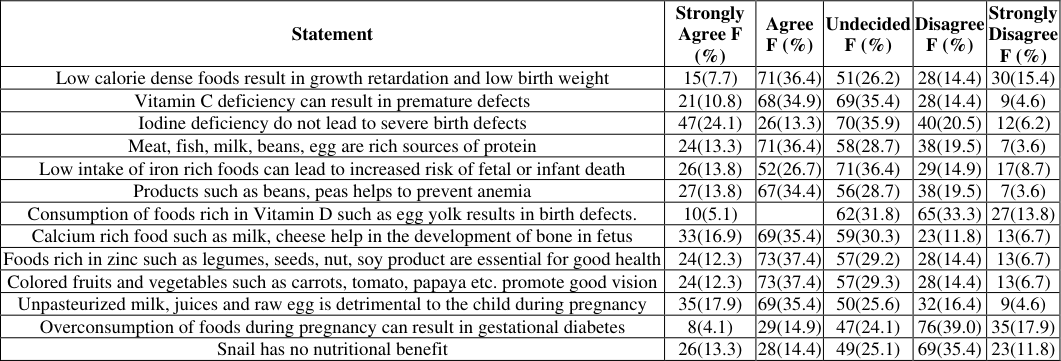 Table 3
 Table 4
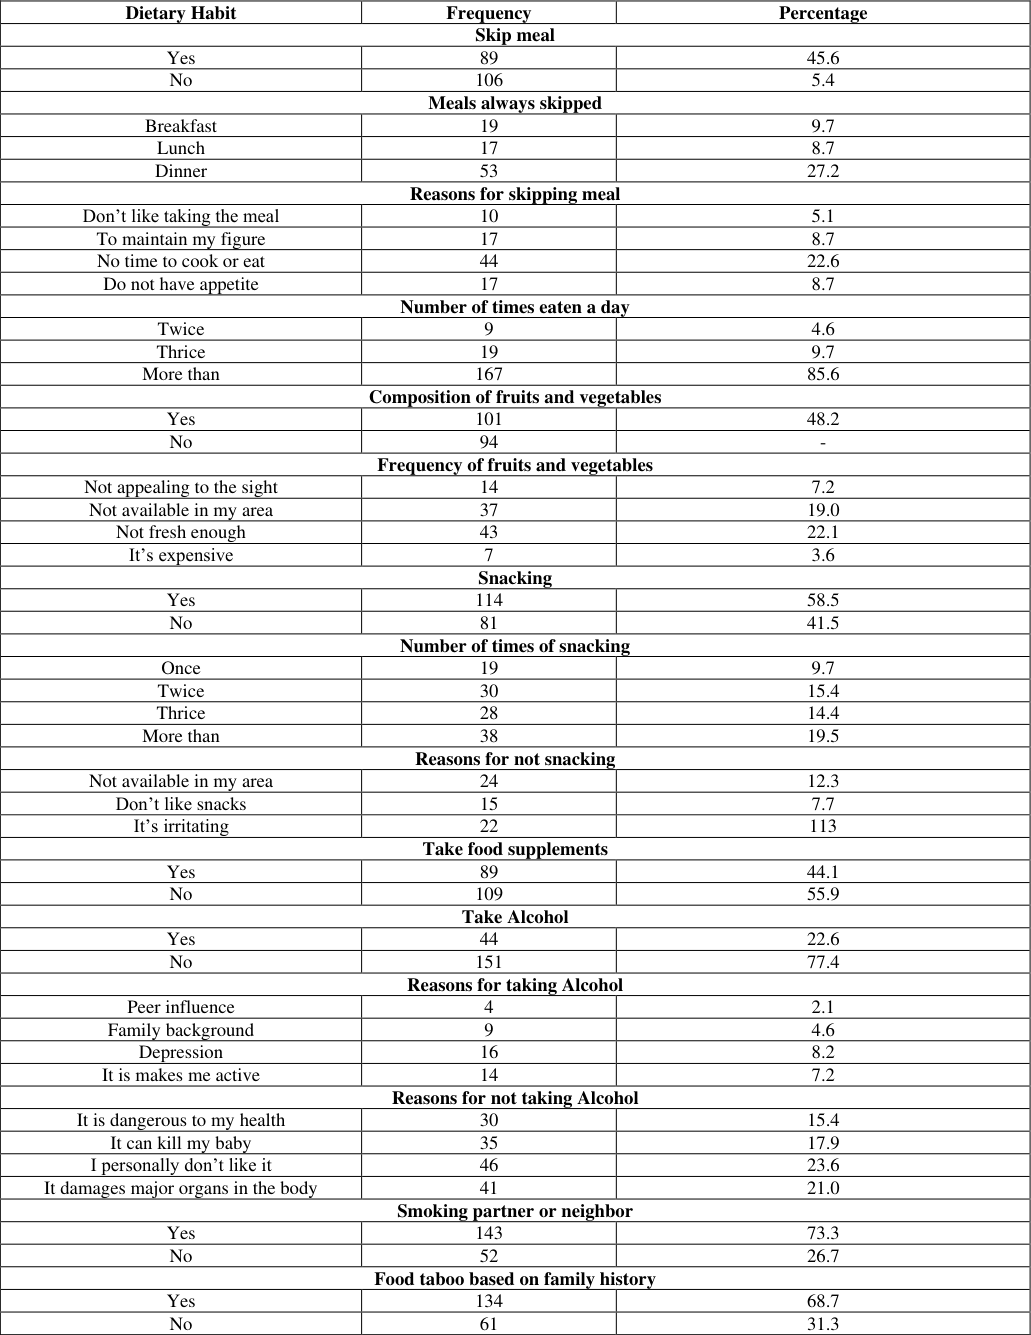 Table 5
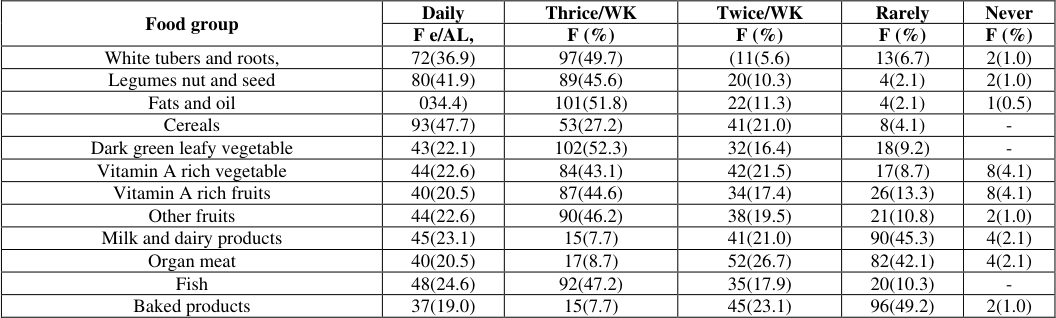 Table 6
 Table 7
 Table 8
Introduction
Pregnancy, also known as gestation, is the time during which one or more offspring develops inside a woman. A multiple pregnancy involves more than one offspring, such as twins. Pregnancy can occur by sexual intercourse or assisted reproductive technology. Childbirth typically occurs around 40wweeks from the last menstrual period (LMP). This is just over nine months, where each mother averages 29 1/2 days when measured from conception it is about 38 weeks (Eunice Kennedy 2015) [4] . More frequently, pregnant women undergoes physiological changes which are entirely normal, including cardiovascular, hematologic, metabolic, renal and respiratory changes that become very important in the event of complications. The body needs to change its physiological and homeostatic mechanics to ensure the development of the fetus. Increase in blood sugar breathing, and cardiac output are all required. Level of progesterone and estrogen rise continually throughout pregnancy, suppressing the hypothalamic axis and subsequently the menstrual cycle. According to United Nations Children Emergency Funds, more than half a million women die all over the world from causes related to pregnancy and childbirth, and forty thousand women die for the same cause in Nigeria yearly (UNICEF 2009) [8] . Sixteen percent of infants worldwide are born with low birth weight, incidence occurs in developing countries in which Nigeria is not left out. Each year there is ill health as a result of pregnancy by more than 20 million women around the world.
Furthermore, the lives of eight million women are threatened and more than 500,000 women are estimated to have died in 1995 and of the 9.2 million women and girls in Nigeria each year one out thirteen face a lifetime risk of maternal death as a result of causes related to pregnancy and childbirth (WHO, 2006) [10] . Hence, pregnant women requires much intake of calorie dense food. Under-nutrition and inadequate weight gain during pregnancy can lead to impaired intrauterine growth and consequent low birth weight of the newborn. In addition to complications at birth, intrauterine growth retardation has been associated with metabolic abnormalities in adult-hood, such as hyperlipidemia, hypertension, cardiovascular disease, glucose intolerance, and type 2 diabetes (Ritchies, Ganapathy, Woodward-Lopez, Gerstein, and Fleming 2003 Carol, Lammi-Keefe, Collins, Couch and Philipson, 2008) [7] . Conversely, Over nutrition and excess weight gain in pregnancy impart risk of gestational diabetes, macrosomia, delivery complications such as shoulder dystocia, cesarean delivery, post-operative problems, difficulty initiating breastfeeding, and risk of subsequent maternal and child obesity (Vause, Martz, Richard and Gramlich, 2016) [9] High consumption of calorie dense food causes obesity, overweight and Thus, this paper focused on assessing the dietary intake of pregnant women attending layeni primary health care Ajegunle Apapa Lagos who are in their second and third trimester.
Materials and Methods
Materials and Methods
Study design
The study was a cross sectional survey designed to assess the dietary intake of pregnant women in their (second and third trimester)
Study area
The research was carried out at layeni primary health care in Ajeromi Ifelodun Local Government which is known to be a notorious slum. The inhabitants were mainly artisans and traders. The local government covers an area of 13.9km square and it is bounded to the north by Surulere local government area, to the east by Apapa local government area. And the third most populated area in Nigeria with a population of 946,500 by 2016 population census. The local government comprises of two primary health care and one general hospital there are ten towns and more than 100 streets making up Ajeromi ifelodun.
Sample Population
The study comprised pregnant women attending Layeni Primary health care Ajegunle Apapa Lagos state.
Sample size
The sample was calculated using the Kish-Leslie formula; n = required sample size z = 1.96 (critical value of the standard normal distribution to error rate α/2 at the level of significance ϭ=0.05(5%) p=0.15 (Madiforo superstition and nutrition among pregnant women in Nwangele local government area of Imo State J. res Nat Dev 2010, 8:16-20) q= (1-p), which represents the estimated proportion of the population with adequate dietary intake. d= maximum acceptable from true proportion, usually set at 0.05.
= 195 respondents
= 195 respondents
Sampling and sample technique
There are two primary health care and one general hospital in Ajeromi Ifelodun Random sampling technique was used to select 195 pregnant women from layeni primary health care on their antenatal clinic days.
Data collection
Pretested, validated questionnaires were administered to consenting pregnant women by trained interviewers during antenatal clinic sessions at layeni primary health care and are translated in Yoruba language for pregnant women who do not understand English. The questionnaire contained questions on socio-demographic and socio-economic characteristics of the pregnant women, nutritional knowledge and dietary habit/dietary intake of pregnant women towards food. Factors that affect their dietary intake were included for the purpose of the research.
Data and statistical analysis
Data collected was analyzed using SPSS version 20. Results were presented as frequencies and percentages using descriptive statistics. The nutritional knowledge was categorized into low, moderate and high by determining the mean and standard deviation of the nutritional knowledge score and a formula mean +SD was used. Where mean +SD is categorized as high knowledge, mean -SD a low knowledge and the scores between high and low was categorized as moderate knowledge. Pearson correlation analysis was used to determine the relationship between the nutritional knowledge of the pregnant women and their dietary intake. Table 1 shows the socio-demographic characteristics of pregnant women. Few (4.1%) of the women were 19 years old, 54.9% were between 20-30 years while 41.0% were 30 years old and above. About 7.7% of the respondents were single. 83.6% were married, 2.6% were divorced, and 5.1% were widowed, while 1.0% were separated. Most of the women (88.7%) practice monogamous marriage while few (8.2%) practice polygamous marriage. A larger percentage of 88.7% were of the nuclear household type and 11.3% were of extended household type. 23.1% of the women do not have a child, while 57.4% had child between the ages of 1-3 years old and 19.5% had child age 4 and above. Majority of the women (93.3%) were in their third trimester while 6.7% were in their second trimester. Furthermore, 41% of the women started their antenatal clinics 4 month ago and above. The data also reveal that 28.7% of the women attended antenatal clinic between 6-10 times, 61.5% attended 11-15 times and 9.7% attended antenatal clinics 16 times and above. The result also showed that most (91.8%) gave birth to their children in clinic, 6.2% gave birth in traditional homes, while 2.1% of the respondents gave birth to their children in mission house. Table 7 shows a larger percentage of the respondents of (80.5) agreed that diseases condition such as Diarrhea, heartburn, nausea and vomiting influenced their dietary intake. The result also showed that 51.3% of the respondents agreed that diabetes or hypertension influenced their dietary intake and 60.5% of the respondent admitted that they are allergic to certain food which influenced their dietary intake.
| Factors | Yes (F %) | N0 F (%) |
|---|---|---|
| Diarrhea, heartburn, nausea and vomiting | 157(80.5) | 38(19.5) |
| Diabetes and hypertension | 100(51.3) | 95(48.7) |
| Allergy | 118(60.5) | 77(39.5) |
| Others | 105(53.8) | 90(46.4) |
Table text extracted from the original PDF; superscript letters are shown inline. The original table image is below.
View original table image
| Characteristics | Frequency (195) | Percentage |
|---|---|---|
| Maternal Age (Years) | ||
| < 19 | 8 | 4.1 |
| 20-30 | 107 | 54.9 |
| >30 | 80 | 41.0 |
| Mean Age = 29.66+ 7.26 | ||
| Marital status | ||
| Single | 15 | 7.7 |
| Married | 163 | 83.6 |
| Divorced | 5 | 2.6 |
| Widowed | 10 | 5.1 |
| Separated | 2 | 1.0 |
| Marriage Type | ||
| Monogamy | 179 | 91.8 |
| Polygamy | 16 | 8.2 |
| Household Type | ||
| Nuclear | 173 | 88.7 |
| Extended | 22 | 11.3 |
| Number of children | ||
| None | 45 | 23.1 |
| 1-3 | 112 | 57.4 |
| 4+ | 38 | 19.5 |
| Gestational age (months) | ||
| Second Trimester | 13 | 6.7 |
| Third semester | 182 | 93.3 |
| Start of Antenatal | ||
| 2-3 | 80 | 41.0 |
| 4+ | 115 | 59.9 |
| Number of Antenatal attended | ||
| 6-10 | 56 | 28.7 |
| 11-15 | 120 | 61.5 |
| 16+ | 19 | 9.7 |
| Place of birth of children | ||
| Clinic | 179 | 91.8 |
| Traditional home | 12 | 6.2 |
| Mission House | 4 | 2.1 |
Table text extracted from the original PDF; superscript letters are shown inline. The original table image is below.
View original table image
Results
Results
Hypothesis Testing
Hypothesis 1 Table 8 above shows the result of the relationship using chisquare df=4, p=0.001, which shows that there is a positive significant relationship between the nutritional knowledge of the respondents and their dietary intake. Hence, the null hypothesis is rejected which states that there is no significant relationship between the two variable
| Frequency of Food Intake Score | — | — | — | — | — | — | p-value DF |
|---|---|---|---|---|---|---|---|
| Low Intake | Moderate Intake | High Intake | 0.001*4 | ||||
| Nutritional Knowledge score | Freq. | (%) | Freq. | (%) | Freq. | (%) | |
| Low | 16 | 21.3 | 35 | 46.7 | 24 | 32.0 | |
| Moderate | 3 | 4.8 | 31 | 49.2 | 29 | 46.0 | |
| High | 1 | 1.8 | 24 | 46.2 | 32 | 56. |
Table text extracted from the original PDF; superscript letters are shown inline. The original table image is below.
View original table image
Discussion
The research revealed that majority of the respondents (93.3%) were in their third trimester, Most of the pregnant women were 20years and above. It could be that the study area was made up of mature adults, and this is in line with a study by Mohidul et al. (2013) [11] where majority of women were aged 20-30. It further indicates height of fertility and the age at which women marry. Majority (57.4%) had children between age 1-3 years. A larger percentage of (991.8%) gave birth to their children at the clinic and only 9.7% attended antenatal clinic sixteen (16) times and above. The Yoruba's constituted the main population of 74.4% which was similar to another study done in Ogun state in which 72% were Yoruba (Ademuyiwa and Sanni 2013) [1] . Results also indicated that 36.9% were artisans, 17.9% were traders were housewife, and. 39% had secondary school education, showing that majority of the respondents had secondary education as their highest education. This shows that most of the respondents had some level of formal education Majority of the respondents earned less than 30,000 per month. This study is in line with the findings Aloysius N. Maduforo (2010) [2] . Most of the pregnant women eat moderately about 49.2% while 38.5% of women had low nutritional knowledge score. This result did not support the 75% reported by Mathew, Akintayo and Ogunwale (2016) [5] in Ile-Ife Osun State. Low nutritional knowledge is considered one of the main causes of inadequate dietary behavior. Studies have reported that most pregnant women have misconceptions about nutrition and are poorly informed about dietary guidelines, which may negatively influence their food choices. About 68.7% of the pregnant women practiced food taboo. This result is in contrast with Ugwa Ea 2016 [11] on nutritional practices and taboos among pregnant women attending antenatal care at General hospital in Kano, northwest Nigeria which showed that all the pregnant women do not practice food taboo. Taboos relating to foods prevents pregnant women from accessing a well-balanced diet, resulting in high prevalence of low birth weight and harm to mother and baby. 80% of the pregnant women experienced diseases condition such as Diarrhea, heartburn, nausea and vomiting. This study concurred with 50-90% of pregnant women affected by these diseases during first semester and sometimes extending into later months of pregnancy reported by Clark et al. (2012) [3] constipation reduces consumption of food by suppressing the appetite and food intake which ultimately have effect on the nutritional status of women. Adequate nutrition during pregnancy is essential to ensure the growth, health, and development of fetus. Therefore, the result of Pearson chi-square correlation analysis showed that there was a significant relationship between the nutritional knowledge of the respondents and their dietary intake.
Conclusion
The increased in Low Nutritional knowledge of foods in this study intensify great need for nutrition counselling in antenatal clinics in urban and rural places in Nigeria to help teach pregnant women on the significance of healthy food choice throughout pregnancy which is key to healthy pregnancy and growth of the child. The assessment of the dietary habit showed that many pregnant women eat to fill their stomach with low nutritional knowledge of what they consume this may be as a result of restriction of some healthy food during pregnancy such as food taboo and diseases condition experienced by pregnant women which influence their dietary intake. There is need for nutrition counselling focused in the early stage of pregnancy on the importance of nutritional knowledge of dietary, followed by adequate consumption of nutritious food.
Figures and tables from the paper
| Characteristics | Frequency (195) | Percentage |
|---|---|---|
| Religion | ||
| Christian | 109 | 55.9 |
| Muslim | 83 | 42.6 |
| Others | 3 | 1.5 |
| Tribe | ||
| Yoruba | 145 | 74.4 |
| Igbo | 34 | 17.4 |
| Hausa | 9 | 4.6 |
| Others | 7 | 3.6 |
| Educational Level | ||
| No formal Education | 29 | 14.9 |
| Primary | 23 | 11.8 |
Table text extracted from the original PDF; superscript letters are shown inline. The original table image is below.
View original table image
| Statement | Strongly Agree F (%) | Agree F (%) | Undecided F (%) | Disagree F (%) | Strongly Disagree F (%) |
|---|---|---|---|---|---|
| Low calorie dense foods result in growth retardation and low birth weight | 15(7.7) | 71(36.4) | 51(26.2) | 28(14.4) | 30(15.4) |
| Vitamin C deficiency can result in premature defects | 21(10.8) | 68(34.9) | 69(35.4) | 28(14.4) | 9(4.6) |
| Iodine deficiency do not lead to severe birth defects | 47(24.1) | 26(13.3) | 70(35.9) | 40(20.5) | 12(6.2) |
| Meat, fish, milk, beans, egg are rich sources of protein | 24(13.3) | 71(36.4) | 58(28.7) | 38(19.5) | 7(3.6) |
| Low intake of iron rich foods can lead to increased risk of fetal or infant death | 26(13.8) | 52(26.7) | 71(36.4) | 29(14.9) | 17(8.7) |
| Products such as beans, peas helps to prevent anemia | 27(13.8) | 67(34.4) | 56(28.7) | 38(19.5) | 7(3.6) |
| Consumption of foods rich in Vitamin D such as egg yolk results in birth defects. | 10(5.1) | 62(31.8) | 65(33.3) | 27(13.8) | |
| Calcium rich food such as milk, cheese help in the development of bone in fetus | 33(16.9) | 69(35.4) | 59(30.3) | 23(11.8) | 13(6.7) |
| Foods rich in zinc such as legumes, seeds, nut, soy product are essential for good health | 24(12.3) | 73(37.4) | 57(29.2) | 28(14.4) | 13(6.7) |
| Colored fruits and vegetables such as carrots, tomato, papaya etc. promote good vision | 24(12.3) | 73(37.4) | 57(29.3) | 28(14.4) | 13(6.7) |
| Unpasteurized milk, juices and raw egg is detrimental to the child during pregnancy | 35(17.9) | 69(35.4) | 50(25.6) | 32(16.4) | 9(4.6) |
| Overconsumption of foods during pregnancy can result in gestational diabetes | 8(4.1) | 29(14.9) | 47(24.1) | 76(39.0) | 35(17.9) |
| Snail has no nutritional benefit | 26(13.3) | 28(14.4) | 49(25.1) | 69(35.4) | 23(11.8) |
Table text extracted from the original PDF; superscript letters are shown inline. The original table image is below.
View original table image
| Level of Knowledge | — | Frequency | Percentage |
|---|---|---|---|
| High | (49-62) | 57 | 29.2 |
| Moderate | (35-48) | 63 | 32.3 |
| Low | (21-34) | 75 | 38.5 |
Table text extracted from the original PDF; superscript letters are shown inline. The original table image is below.
View original table image
| Dietary Habit | Frequency | Percentage |
|---|---|---|
| Skip meal | ||
| Yes | 89 | 45.6 |
| No | 106 | 5.4 |
| Meals always skipped | ||
| Breakfast | 19 | 9.7 |
| Lunch | 17 | 8.7 |
| Dinner | 53 | 27.2 |
| Reasons for skipping meal | ||
| Don’t like taking the meal | 10 | 5.1 |
| To maintain my figure | 17 | 8.7 |
| No time to cook or eat | 44 | 22.6 |
| Do not have appetite | 17 | 8.7 |
| Number of times eaten a day | ||
| Twice | 9 | 4.6 |
| Thrice | 19 | 9.7 |
| More than | 167 | 85.6 |
| Composition of fruits and vegetables | ||
| Yes | 101 | 48.2 |
| No | 94 | - |
| Frequency of fruits and vegetables | ||
| Not appealing to the sight | 14 | 7.2 |
| Not available in my area | 37 | 19.0 |
| Not fresh enough | 43 | 22.1 |
| It’s expensive | 7 | 3.6 |
| Snacking | ||
| Yes | 114 | 58.5 |
| No | 81 | 41.5 |
| Number of times of snacking | ||
| Once | 19 | 9.7 |
| Twice | 30 | 15.4 |
| Thrice | 28 | 14.4 |
| More than | 38 | 19.5 |
| Reasons for not snacking | ||
| Not available in my area | 24 | 12.3 |
| Don’t like snacks | 15 | 7.7 |
| It’s irritating | 22 | 113 |
| Take food supplements | ||
| Yes | 89 | 44.1 |
| No | 109 | 55.9 |
| Take Alcohol | ||
| Yes | 44 | 22.6 |
| No | 151 | 77.4 |
| Reasons for taking Alcohol | ||
| Peer influence | 4 | 2.1 |
| Family background | 9 | 4.6 |
| Depression | 16 | 8.2 |
| It is makes me active | 14 | 7.2 |
| Reasons for not taking Alcohol | ||
| It is dangerous to my health | 30 | 15.4 |
| It can kill my baby | 35 | 17.9 |
| I personally don’t like it | 46 | 23.6 |
| It damages major organs in the body | 41 | 21.0 |
| Smoking partner or neighbor | ||
| Yes | 143 | 73.3 |
| No | 52 | 26.7 |
| Food taboo based on family history | ||
| Yes | 134 | 68.7 |
| No | 61 | 31.3 |
Table text extracted from the original PDF; superscript letters are shown inline. The original table image is below.
View original table image
| Food group | Daily | Thrice/WK | Twice/WK | Rarely | Never |
|---|---|---|---|---|---|
| F e/AL, | F (%) | F (%) | F (%) | F (%) | |
| White tubers and roots, | 72(36.9) | 97(49.7) | (11(5.6) | 13(6.7) | 2(1.0) |
| Legumes nut and seed | 80(41.9) | 89(45.6) | 20(10.3) | 4(2.1) | 2(1.0) |
| Fats and oil | 034.4) | 101(51.8) | 22(11.3) | 4(2.1) | 1(0.5) |
| Cereals | 93(47.7) | 53(27.2) | 41(21.0) | 8(4.1) | - |
| Dark green leafy vegetable | 43(22.1) | 102(52.3) | 32(16.4) | 18(9.2) | - |
| Vitamin A rich vegetable | 44(22.6) | 84(43.1) | 42(21.5) | 17(8.7) | 8(4.1) |
| Vitamin A rich fruits | 40(20.5) | 87(44.6) | 34(17.4) | 26(13.3) | 8(4.1) |
| Other fruits | 44(22.6) | 90(46.2) | 38(19.5) | 21(10.8) | 2(1.0) |
| Milk and dairy products | 45(23.1) | 15(7.7) | 41(21.0) | 90(45.3) | 4(2.1) |
| Organ meat | 40(20.5) | 17(8.7) | 52(26.7) | 82(42.1) | 4(2.1) |
| Fish | 48(24.6) | 92(47.2) | 35(17.9) | 20(10.3) | - |
| Baked products | 37(19.0) | 15(7.7) | 45(23.1) | 96(49.2) | 2(1.0) |
Table text extracted from the original PDF; superscript letters are shown inline. The original table image is below.
View original table image
References
11 in the original paper- Ademuyiwa MO, Sanni SA. Consumption Pattern and Dietary Practices of Pregnant Women in Odedele Local Government Area of Ogun State International Journal of Biological, Agricultural, Food and Biotechnological Engineering. 2013;7:11.
- Aloysius NM. Superstition and Nutrition Among Pregnant Women in Nwangele Local Government Area of Imo State. J Res Natl. Dev. 2010;8:16-20.
- Clark SM, Constantine MH, Hankins GD. Review of NVP and HG and early pharmotherapeutic intervention Obstet Gynecol. Int, 2012, 252676.
- Eunice KS. National Institute of Child Health and Human Development Women's Health 2016. Gov Pregnancy you are pregnant/29-11-2016/14:15
- Mathew O, Akintayo O, Oyedunni SA, Ademola LA. Dietary Intake Knowledge and Reasons For Food Restriction During Pregnancy Among Pregnant Women Attending Primary Health Care Centers in ile-ife, Nigeria. Vol. 2:40,2016
- Saravanabavan V, Aneesh P, Babu HM, Harieswari M, Balaji D, Vinothini C. Patient's perception and level of primary health care utilization in east block of Madurai North taluk: A geo-health study. Int. J Geogr. Geol. Environ. 2021;3(1):34-41.
- Ritchie LD, Ganapathy S, Woodward-Lopez G, Gerstein DE, Fleming SE. Prevention of Type Diabetes in Youth: Etiology, Promising Interventions and Recommendations. Pediatr Diabetes. 2003;4:174-209.
- UNICEF. The State of the World′s children, United Nations Publication 2006. www.unicef2006/org/sow.
- Vause TM, Richard F, Gramlich L, Nutrition for Healthy Pregnancy Outcomes Applphysicol Nutr Metab. 2006;31:12-2024
- WHO. World Health Organization releases New Child Growth Standard 2006. www.whoint/nutrition/topic/childgrowth.
- Mohidul I, Shahinur R, Kamruzzaman Mominul I, Abdus S. Effect of maternal status and breastfeeding practices on infant nutritional status -a cross sectional study in the south-west region of Bangladesh; The Pan African Medical Journal. 2013;16:139.