
Research article · 2022 · Full text
International Journal of Agriculture Extension and Social DevelopmentDeterminant of household biomass energy preference in Oyo state, Nigeria
Volume 5(2) · Pages 49–54 · DOI: 10.33545/26180723.2022.v5.i2a.155 ↗
Research areasEnergy and Environment Impacts
Abstract
Author-writtenThe global energy supply has been increasing over the years, in an effort to meet the global demand many of the world’s poor population are being left behind. It has been estimated that approximately 1.4 billion people (20%) of the global population lack access to electricity and 2.7 billion (40%) of the global population, rely on the traditional use of biomass for cooking. This study reveals that firewood is the main type of cooking energy used or demanded for by the respondents. Among the various reasons accounted for such preferences of firewood to charcoal and kerosene are availability, ability of firewood to burn well and fast, perception on efficiency. Energy price (a significant variable in QUAIDS) indicated negative impact on demand for biomass fuel as well educational level of head of household while age, size of the households positively determines demand for biomass fuel.
Summary
Source-checkedPlain-language reading of the full paper, prepared with AI and checked against the text. Each point links to the authors' own words.
Why it matters
- A significant portion of the global population lacks electricity and relies on traditional biomass for cooking, with estimates at 20% and 40% respectively. View evidence ↗
- In Nigeria, over 68% of the population, particularly in rural areas, depends on fuelwood for domestic needs. View evidence ↗
- The use of fuelwood as a cooking energy source is associated with environmental concerns, including inefficiency and indoor air pollution. View evidence ↗
The question
- The study aims to identify the types of cooking energy and appliances used by households, the reasons for their preferences, and the factors influencing these choices. View evidence ↗
What they did
- Primary data was collected using questionnaires distributed in the Oluyole and Ibadan South West Local Government Areas (LGAs). View evidence ↗
- The study sample consisted of 304 respondents from whom completed questionnaires were retrieved. View evidence ↗
- A Logit model based on the Quadratic Almost Ideal Demand System (QUAIDS) framework was used to analyze factors influencing energy choice. View evidence ↗
What they found
- Firewood is the dominant cooking energy source, used by 81.9% (249) of households, followed by charcoal (11.2%) and kerosene stoves (5.3%). View evidence ↗
- The preference for firewood is primarily driven by its availability, perceived efficiency, ability to burn well and fast, and traditional usage. View evidence ↗
- Gender is a significant factor; a 1% increase in the perception of gender difference is associated with a 3.61% reduction in demand for firewood. View evidence ↗
- Age positively influences preference, where a 1% increase in household age leads to a 2.3% increase in firewood demand. View evidence ↗
- Household size positively determines demand, with a 1% increase in the number of people leading to a 1.9% increase in biomass fuel demand. View evidence ↗
- The education level of the household head is a negative determinant; a 1% increase in educational status leads to approximately a 2% decrease in biomass fuel demand. View evidence ↗
- Energy price has an inverse relationship with demand, where a 1% increase in price results in a 2.1% decrease in biomass cooking fuel demand. View evidence ↗
What it means
- The authors conclude that rural households in Oyo state prefer firewood, kerosene, and charcoal primarily because they are affordable and accessible. View evidence ↗
- The authors recommend that government or private agencies sensitize the public regarding the health implications of preferring biomass energy. View evidence ↗
Visual summary
2 visualsIllustrations explain the paper; charts are replotted from the paper's own table values.
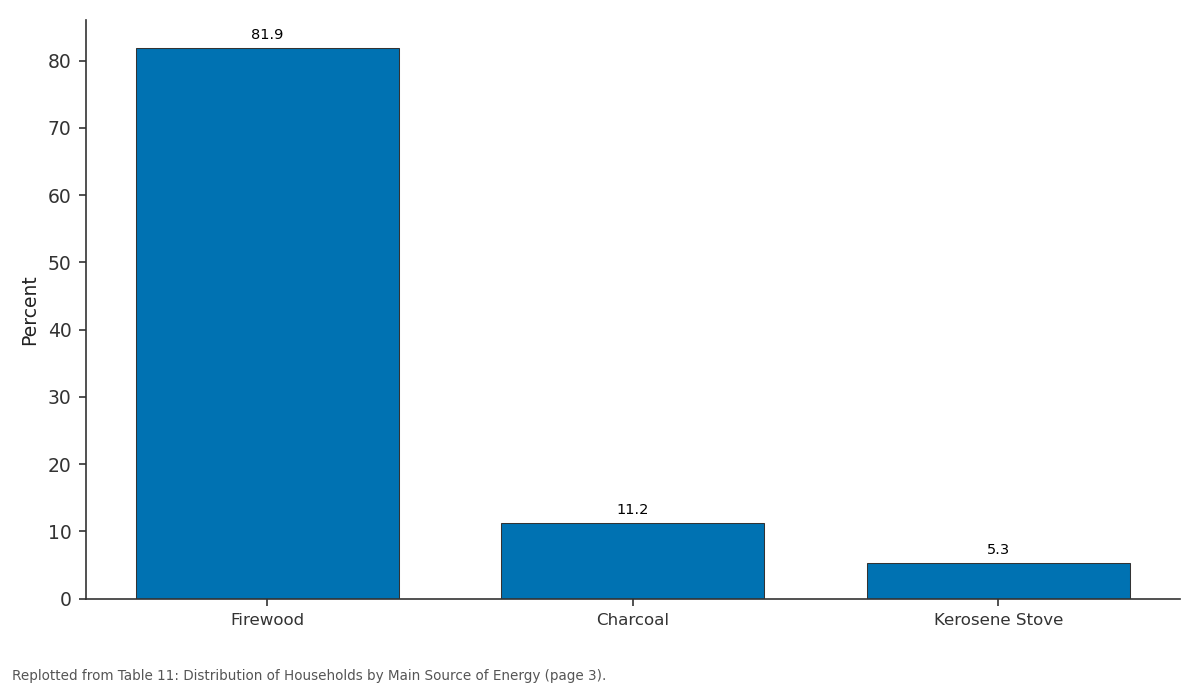
Percent: Firewood vs Charcoal vs Kerosene Stove
Replotted from Table 11 (page 3) of the original paper. Every bar is the paper's own table value.
View source evidence ↗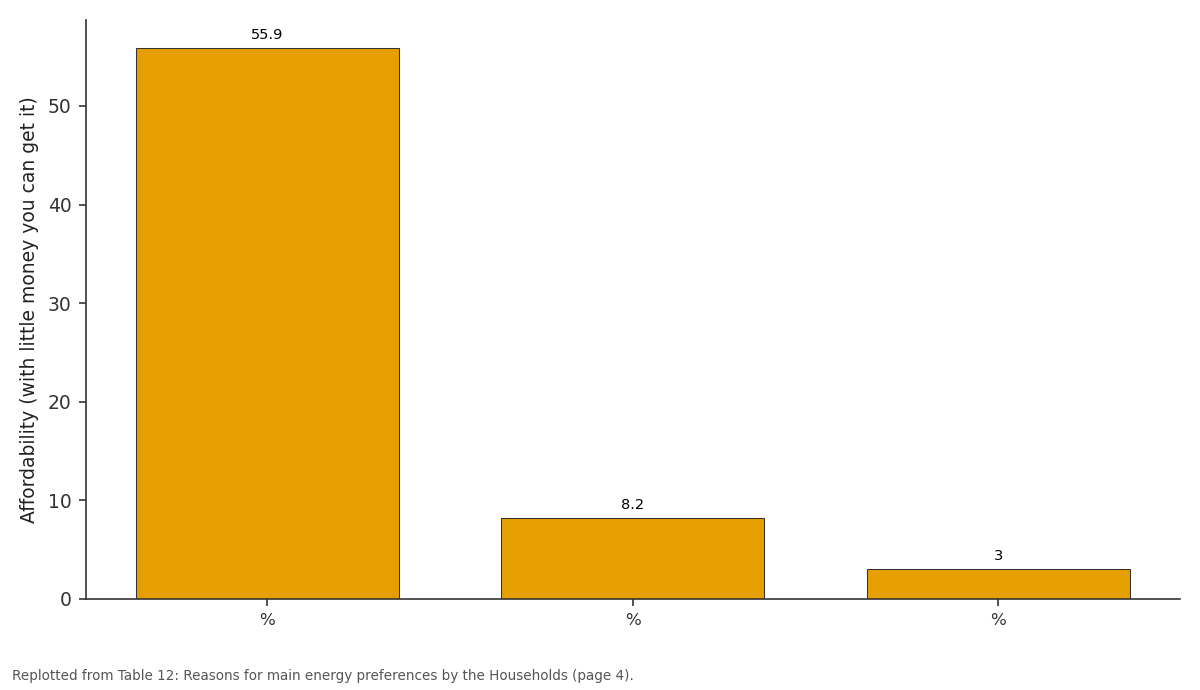
Affordability (with little money you can get...: % vs % vs %
Replotted from Table 12 (page 4) of the original paper. Every bar is the paper's own table value.
View source evidence ↗Figures & tables
From the original paper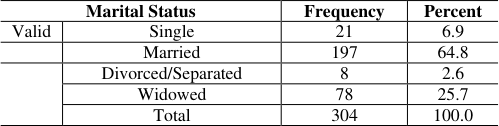 Table 3
 Table 1
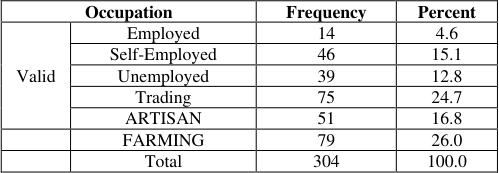 Table 4
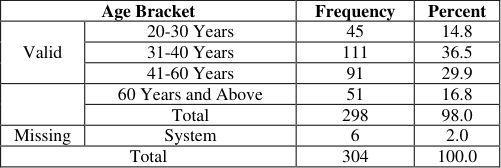 Table 2
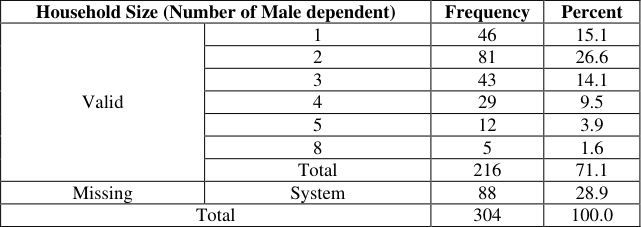 Table 5
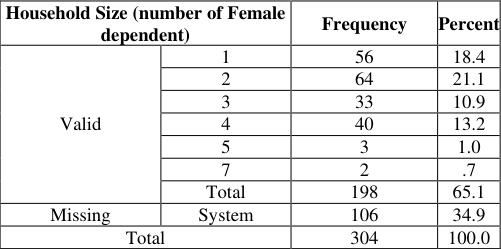 Table 6
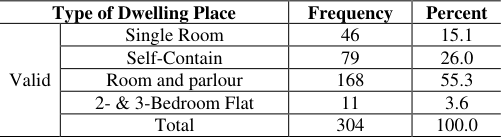 Table 9
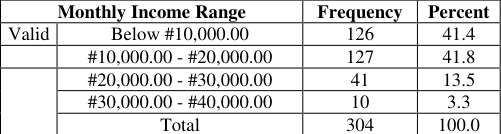 Table 10
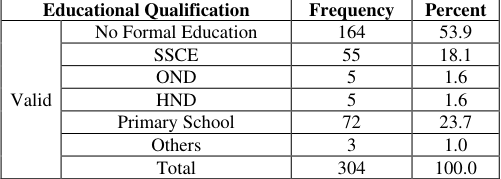 Table 7
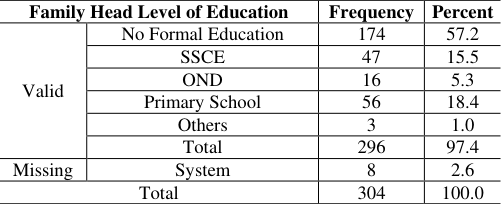 Table 8
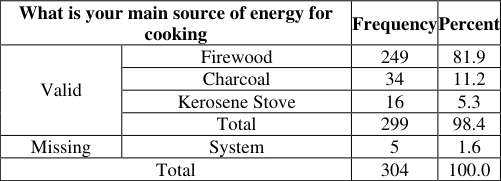 Table 11
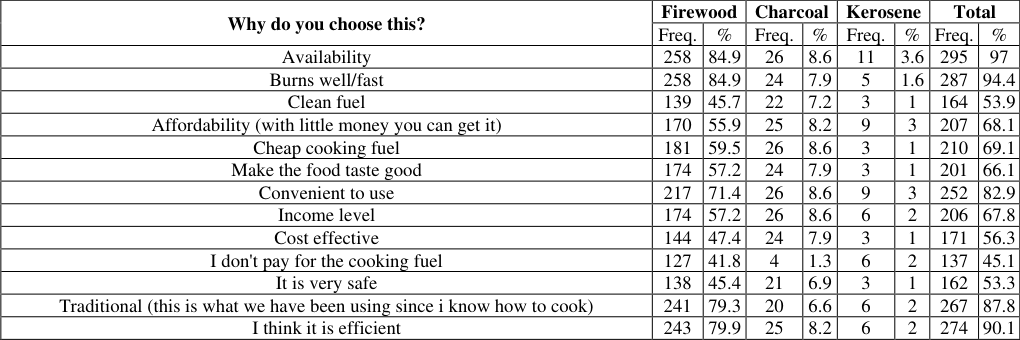 Table 12
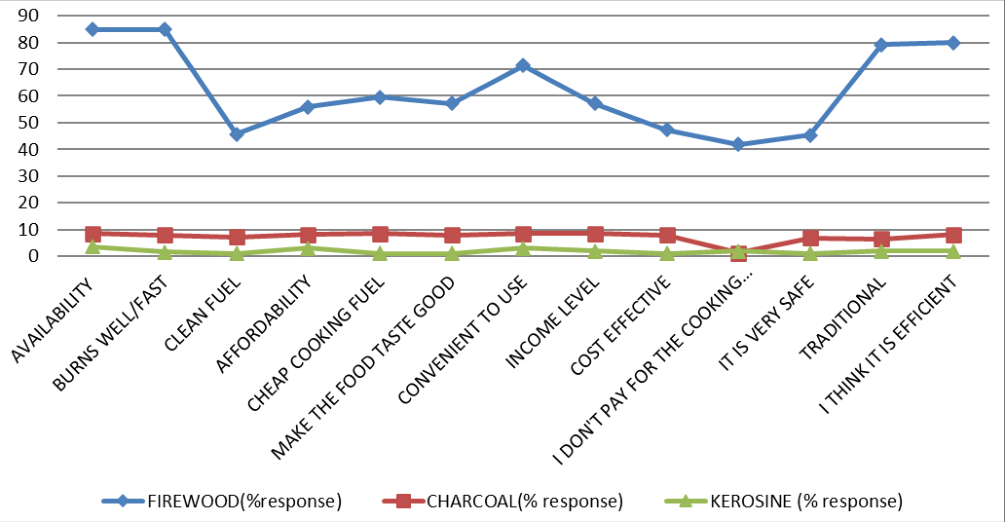 Figure 1
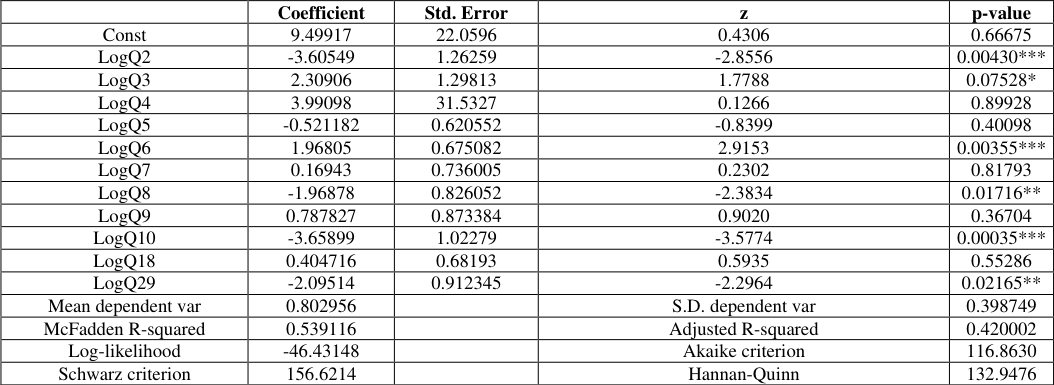 Table 13
Introduction
Biomass energy refers to the energy of biological system such as wood and waste. The biomass resources of Nigeria can be identified as wood, forage grass and shrubs, residues and waste (forestry, agricultural and industrial) as well as aquatic biomass (Akpan et al., 2007) [1] . Biomass fuels play a key role in household cooking fuels. According to World Bank (2003) [8] , many rural households use biomass fuels for cooking in Nigeria. Biomass fuel is largely free and relatively available to most communities. The pattern of energy consumption in Nigeria can be divided into industrial, transport commercial, agricultural, and household sectors. The major energy consuming activities in Nigeria's households are cooking, lighting, and use of electrical appliances with cooking accounting for 70% of household energy consumption, lighting uses up to 3%, hot water boiling takes about 25% and the remaining 2% can be attributed to the use of basic electrical appliances such as television and pressing iron (ECN, 2012) In Nigeria, the rural and urban populace depends on traditional and modern fuel for household needs which includes cooking such as wood, animal, charcoal, kerosene, cooking gas, electricity etc. Over 68% of her population depends on fuel wood for cooking and other domestic uses especially in the rural areas. Nigeria consumes over 50million metric tons of fuel wood for domestic and commercial uses is a major cause of desertification in the arid-zone states and erosion in the southern part of the country (Sambo, 2009) [6] . Energy is one of the essential inputs for improved wellbeing of individuals and socioeconomic development of nations. In spite of the importance of energy, most households in Oyo State are still faced with the overconsumption of low grade traditional energy sources (National Bureau of Statistics, 2009) [3] . Large amounts of human energy are spent gathering fuel wood in many parts of the state, and the burden tends to fall more heavily on women and children. In many communities today, it is not uncommon to see women and children trek several kilometres in search of fuel wood in rural areas of Oyo State. Cooking energy represents the bulk of energy demand in Nigeria, which is dominated by different sources of cooking although there is the use of unclean energy sources in form of fuel wood which raises several environmental concerns because of its inefficiency and contributions to indoor air pollution. Hence the importance of this study identify types of energy used by the households for cooking, energy appliances used by the households, reasons for main energy preferences by the Households and examine the factors influencing the preferences of the households' Energy Preference.
Materials and Methods
The study employed a primary data collection method whereby a questionnaire was designed and distribution in Oluyole and Ibadan South West LGAs. The major predominant activity (occupation of the respondents), random sampling technique was employed to select the study participants. The collected primary data for this study were gathered through the three hundred and four (304) respondents from whom the administered questions were retrieved. Various analytical approaches were used including descriptive method for profiling demographic and socio-economic characteristics of the respondents in this study. Logit model based on QUAIDS framework was used to determine the factors that influence the choice of a given energy for cooking by households.
Results and Discussion
The demographic and socio-economic characteristics of the surveyed households for this study are presented in this section these are location, gender, age range, marital status, occupation, household size, educational status, and their monthly income ranges among others. The survey result in table 3 shows the numbers of married households are more than respondents from other categories. 64.8% of the respondents are married, the widows are (25.7%), single respondents amounted to 21 (6.9%), while 2.6% are either divorced or separated from their husband. Source: Author's computation from field survey, 2017
| Marital Status | — | Frequency | Percent |
|---|---|---|---|
| Valid | Single | 21 | 6.9 |
| Married | 197 | 64.8 | |
| Divorced/Separated | 8 | 2.6 | |
| Widowed | 78 | 25.7 | |
| Total | 304 | 100.0 |
Table text extracted from the original PDF; superscript letters are shown inline. The original table image is below.
View original table image
Table 4 shows the distribution of the households based on occupation, it revealed that 26% of the respondents which represents 79 households were farmers. 75 respondents (24.7%) were into trading. (16.8%) of the respondents were artisans, while the unemployed respondents totaled 39 (12.8%). It is glaring from this distribution that employed respondents among these rural households are few, they amounted to 14 (4.6%) and so occupational distribution of the households in the selected study areas is biased or skewed toward self-directed businesses and all forms of activities that could aid survival in the rural areas. This occupational profile of the selected households would likely contribute to the choice of the type of energy used. It is a reality that dependency ratio is a demographic factor that can determine the level of household welfare. The table 5 reveals the number of male dependents in each of the surveyed households. From the table, 81 households (26.6%) had 2 male dependents in their families. Also, 46 households (15.1%) had 1 male dependent in their families, while the least were 5 families (1.6%) with 8 male dependents in their families. Households with large number of dependents would likely have a reduced household welfare, especially where income is low. www.extensionjournal.com Table 6 shows the dependency ratio of female in the selected households is however lower than that of the male. The table shows the number of female dependents in each of the surveyed households. From the table, 64 households (21.1%) had 2 female dependents in their families. Also, 56 households (18.4%) had 1 female dependent in their families, while the least were 2 families (0.7%) with 7 female dependents in their families. As explained above, large number of dependents would likely have a reduced household welfare, especially where income is low. It can be seen from the table 7 that 164 households (53.9%) has no formal educational qualification. Also, 72 respondents (23.7%) expressed that they has primary school certificate examination. Those with senior school certificate among the surveyed rural households were 55 (18.1%), while the least are those that has other types of educational qualification like vocational education or community-based adult education. It is therefore glaring that majority of the surveyed households were illiterate and this can determine the level of the stream of income flows to them and the choice of energy use. The indication from the table 9 is that majority of the selected households live in a Room and Parlour apartment. This accounted for 168 households (55.3%). Those that live in self-contain apartments were 79 (26%), 15.1% represents 46 households who were living in single rooms as at the time of the survey, while only 11 households (3.6%) were dwelling in 2 or 3 bedroom flats (usually a whole buildings). The table 10 above shows that 127 households (41.8%) and 126 households (41.4%) are earning between 10-20 thousand naira and below 10 thousand naira monthly respectively from their different lines of occupations. It is only 10 respondents (3.2%) that earn between 30 and 40 thousand. Income range of these households is generally low and this affects their demand for biomass.
| Educational Qualification | — | Frequency | Percent |
|---|---|---|---|
| Valid | No Formal Education | 164 | 53.9 |
| SSCE | 55 | 18.1 | |
| OND | 5 | 1.6 | |
| HND | 5 | 1.6 | |
| Primary School | 72 | 23.7 | |
| Others | 3 | 1.0 | |
| Total | 304 | 100.0 |
Table text extracted from the original PDF; superscript letters are shown inline. The original table image is below.
View original table image
| Monthly Income Range | — | Frequency | Percent |
|---|---|---|---|
| Valid | Below #10,000.00 | 126 | 41.4 |
| #10,000.00 - #20,000.00 | 127 | 41.8 | |
| #20,000.00 - #30,000.00 | 41 | 13.5 | |
| #30,000.00 - #40,000.00 | 10 | 3.3 | |
| Total | 304 | 100.0 |
Table text extracted from the original PDF; superscript letters are shown inline. The original table image is below.
View original table image
| Type of Dwelling Place | — | Frequency | Percent |
|---|---|---|---|
| Valid | Single Room | 46 | 15.1 |
| Self-Contain | 79 | 26.0 | |
| Room and parlour | 168 | 55.3 | |
| 2- & 3-Bedroom Flat | 11 | 3.6 | |
| Total | 304 | 100.0 |
Table text extracted from the original PDF; superscript letters are shown inline. The original table image is below.
View original table image
| Household Size (number of Female dependent) | — | Frequency | Percent |
|---|---|---|---|
| Valid | 1 | 56 | 18.4 |
| 2 | 64 | 21.1 | |
| 3 | 33 | 10.9 | |
| 4 | 40 | 13.2 | |
| 5 | 3 | 1.0 | |
| 7 | 2 | .7 | |
| Total | 198 | 65.1 | |
| Missing | System | 106 | 34.9 |
| Total | 304 | 100.0 |
Table text extracted from the original PDF; superscript letters are shown inline. The original table image is below.
View original table image
| Household Size (Number of Male dependent) | — | Frequency | Percent |
|---|---|---|---|
| Valid | 1 | 46 | 15.1 |
| 2 | 81 | 26.6 | |
| 3 | 43 | 14.1 | |
| 4 | 29 | 9.5 | |
| 5 | 12 | 3.9 | |
| 8 | 5 | 1.6 | |
| Total | 216 | 71.1 | |
| Missing | System | 88 | 28.9 |
| Total | 304 | 100.0 |
Table text extracted from the original PDF; superscript letters are shown inline. The original table image is below.
View original table image
| Occupation | — | Frequency | Percent |
|---|---|---|---|
| Valid | Employed | 14 | 4.6 |
| Self-Employed | 46 | 15.1 | |
| Unemployed | 39 | 12.8 | |
| Trading | 75 | 24.7 | |
| ARTISAN | 51 | 16.8 | |
| FARMING | 79 | 26.0 | |
| Total | 304 | 100.0 |
Table text extracted from the original PDF; superscript letters are shown inline. The original table image is below.
View original table image
Types of energy used by the Households and the determinants of their preference
This section identifies the types of energy commonly used by the surveyed households via frequency distribution tables. Secondly, it empirically determined the factors that influence household preference for their main energy sources via a multinomial logistic regression. The distribution above (table 11) is in order of magnitude. Here, firewood is the dominant energy source used by the rural households for cooking. Approximately 82% of the www.extensionjournal.com respondents, which represents 249 households, used firewood mainly for their household energy need (mostly cooking and heating). This was followed by 34 households (11.2%) who usually use charcoal, while 16 of the surveyed households (5.3%) used kerosene. Thus, Firewood and Charcoal are examples of biomass, and evidence from the responses showed that the firewood is the predominant energy source used. Thus, further analysis is done to show determinants of household preference for their energy choice. Various reasons have been adduced by the respondents as the precursor for their choice of these dominants energy types for domestic use. A tabular and graphical projection of the various reasons for the chosen energy types by the respondents are shown in Table 12. It can be revealed from the table and the line graph, that the demand for biomass (firewood and charcoal) outpaced kerosene. For firewood, availability, ability to burn well and fast, traditional inclination and efficiency perception of the households overwhelmingly account for its preference to others. On the part of charcoal, the perception that it is available, cheap, convenient to use, and the income level were the leading factors that informed it preference to others. on the part of kerosene however, availability, affordability, convenience, and income appear to be the major reasons. It can however be seen that charcoal is the alternative energy source to firewood as kerosene is the alternative to charcoal. In fact, responses on the various reasons for choosing charcoals and kerosene were less than 10% from all the respondents. Therefore, firewood is the most prevalent fuelwood demanded for by the selected respondents (households), thus, the specified model for energy demand is only estimated for firewood in this study as the main biomass (energy) used for cooking and other domestic use.
| Why do you choose this? | Firewood | — | Charcoal | — | Kerosene | — | Total | — |
|---|---|---|---|---|---|---|---|---|
| Freq. | % | Freq. | % | Freq. | % | Freq. | % | |
| Availability | 258 | 84.9 | 26 | 8.6 | 11 | 3.6 | 295 | 97 |
| Burns well/fast | 258 | 84.9 | 24 | 7.9 | 5 | 1.6 | 287 | 94.4 |
| Clean fuel | 139 | 45.7 | 22 | 7.2 | 3 | 1 | 164 | 53.9 |
| Affordability (with little money you can get it) | 170 | 55.9 | 25 | 8.2 | 9 | 3 | 207 | 68.1 |
| Cheap cooking fuel | 181 | 59.5 | 26 | 8.6 | 3 | 1 | 210 | 69.1 |
| Make the food taste good | 174 | 57.2 | 24 | 7.9 | 3 | 1 | 201 | 66.1 |
| Convenient to use | 217 | 71.4 | 26 | 8.6 | 9 | 3 | 252 | 82.9 |
| Income level | 174 | 57.2 | 26 | 8.6 | 6 | 2 | 206 | 67.8 |
| Cost effective | 144 | 47.4 | 24 | 7.9 | 3 | 1 | 171 | 56.3 |
| I don't pay for the cooking fuel | 127 | 41.8 | 4 | 1.3 | 6 | 2 | 137 | 45.1 |
| It is very safe | 138 | 45.4 | 21 | 6.9 | 3 | 1 | 162 | 53.3 |
| Traditional (this is what we have been using since i know how to cook) | 241 | 79.3 | 20 | 6.6 | 6 | 2 | 267 | 87.8 |
| I think it is efficient | 243 | 79.9 | 25 | 8.2 | 6 | 2 | 274 | 90.1 |
Table text extracted from the original PDF; superscript letters are shown inline. The original table image is below.
View original table image
| What is your main source of energy for cooking | — | Frequency | Percent |
|---|---|---|---|
| Valid | Firewood | 249 | 81.9 |
| Charcoal | 34 | 11.2 | |
| Kerosene Stove | 16 | 5.3 | |
| Total | 299 | 98.4 | |
| Missing | System | 5 | 1.6 |
| Total | 304 | 100.0 |
Table text extracted from the original PDF; superscript letters are shown inline. The original table image is below.
View original table image
Empirical Determinants of Households' Energy Preference
It can be understood from this descriptive analysis that www.extensionjournal.com firewood is the major biomass demanded or chosen by the households for their cooking. Therefore, the main factors that drive or determined the preferences of firewood by the surveyed rural households are empirically estimated in this section. The results were obtained from a binary logistic model under the quadratic almost ideal demand system (QUAIDS) framework. Since the main energy use for cooking are categorized as (firewood, charcoal, and kerosene), and having discovered that firewood is the dominant type, the variables were re-coded using binary value of 1 for firewood and 0 if otherwise. Thus, the estimation is done for firewood. f(beta'x) at mean of independent vars = 0.399 Likelihood ratio test: Chi-square (11) = 108.626 [0.0000]* Note: *, ** and *** denote that the variables are respectively significant at 1%, 5% and 10% level of statistical significance. The logarithmic values of the independent variables are:Q2(sex), Q3(age), Q4(marital status), Q5(occupation), Q6(household size), Q7(educational qualification of households), Q8(level of education of family head), Q9(types of dwelling place), Q10(monthly income), Q18(years of experience in using energy appliances), and Q29(energy price).
The results from the table above indicate that the model has a very high goodness of fit based on the maximum likelihood ratio test of chi-square distribution value of 108.626 with a probability value that is significant at 1% level of significance. Similarly, the McFadden R-squared, which is the coefficient of the determination of the model and its corresponding, adjusted R-squared accounted for 53.9% and 42% variation in the demand for the main cooking energy. This variation implies that aside the included explanatory variables in the models, other random factors can still account or determine the the main cooking energy preference by the rural households. With respect to each of the explanatory variables however, the results above show that at 10% level of significance, the gender or sex of the households is statistically significant as a factor that determine household energy preference. The coefficient signed negatively, which potentially implied that a 1% increase in the perception of gender difference among the rural households will likely lead to 3.61% reduction in subsequent demand for this biomass (firewood). This seem to be related to societal gender roles in which females are more likely to do domestic chores including cooking and sourcing for available firewood to cook. Thus, at 1% level of statistical significance, the result also shows that age of the respondents is a significant factor influencing energy preference among the surveyed rural households. In this case, a 1% increase in household age would lead to 2.3% increase in demand for firewood among rural households in Ibadan. This corresponds with the findings of Shittu et al. (2004) [7] who found that age of household heads in Ogun State of Nigeria is an important factor that determine energy preference for biomass fuel. It is also found from the table above that the size of the households positively determines energy preference. Here, at 10% level of statistical significance, a 1% increase in the number of people in a given household would lead to 1.9% increase in demand for biomass fuel among the selected households. Similarly, at 5% level of statistical significance, the level of education of household heads proved to be a negative determinant for biomass fuel. The implication is that a 1% increase in educational advancement or status of head of households would approximately lead to 2% decrease in demand for biomass fuel. This verifies the fact that more educated household head would likely go for modern or clean energy rather than the biomass fuel. Lastly, energy price showed negative impact on demand for biomass fuel. The result showed that at 5% level of significance, an increase in the price of energy of about 1% would cause demand for biomass cooking fuel to decrease by 2.1%. The implication is that there is inverse relationship between demand for biomass and energy price.
Conclusion
The study has shown that firewood, kerosene and charcoal are majorly the biomass energy preference of rural households in Oyo state due to their affordability and accessibility. The study revealed that marital status, occupation of households, educational qualification of households, types of dwelling place, and years of experience in using the main energy appliances for the preferred cooking energy were not statistically significant as determinants or factors that influence household preference for main energy sources this study recommends that sensitization of the public by government agencies or private agencies on the health implications of their prefence for biomass energy is important
Figures and tables from the paper
| SEX | — | Frequency | Percent |
|---|---|---|---|
| Valid | Male | 72 | 23.7 |
| Female | 232 | 76.3 | |
| Total | 304 | 100.0 |
Table text extracted from the original PDF; superscript letters are shown inline. The original table image is below.
View original table image
| Age Bracket | — | Frequency | Percent |
|---|---|---|---|
| Valid | 20-30 Years | 45 | 14.8 |
| 31-40 Years | 111 | 36.5 | |
| 41-60 Years | 91 | 29.9 | |
| 60 Years and Above | 51 | 16.8 | |
| Total | 298 | 98.0 | |
| Missing | System | 6 | 2.0 |
| Total | 304 | 100.0 |
Table text extracted from the original PDF; superscript letters are shown inline. The original table image is below.
View original table image
| Family Head Level of Education | — | Frequency | Percent |
|---|---|---|---|
| Valid | No Formal Education | 174 | 57.2 |
| SSCE | 47 | 15.5 | |
| OND | 16 | 5.3 | |
| Primary School | 56 | 18.4 | |
| Others | 3 | 1.0 | |
| Total | 296 | 97.4 | |
| Missing | System | 8 | 2.6 |
| Total | 304 | 100.0 |
Table text extracted from the original PDF; superscript letters are shown inline. The original table image is below.
View original table image
| — | Coefficient | Std. Error | z | p-value |
|---|---|---|---|---|
| Const | 9.49917 | 22.0596 | 0.4306 | 0.66675 |
| LogQ2 | -3.60549 | 1.26259 | -2.8556 | 0.00430*** |
| LogQ3 | 2.30906 | 1.29813 | 1.7788 | 0.07528* |
| LogQ4 | 3.99098 | 31.5327 | 0.1266 | 0.89928 |
| LogQ5 | -0.521182 | 0.620552 | -0.8399 | 0.40098 |
| LogQ6 | 1.96805 | 0.675082 | 2.9153 | 0.00355*** |
| LogQ7 | 0.16943 | 0.736005 | 0.2302 | 0.81793 |
| LogQ8 | -1.96878 | 0.826052 | -2.3834 | 0.01716** |
| LogQ9 | 0.787827 | 0.873384 | 0.9020 | 0.36704 |
| LogQ10 | -3.65899 | 1.02279 | -3.5774 | 0.00035*** |
| LogQ18 | 0.404716 | 0.68193 | 0.5935 | 0.55286 |
| LogQ29 | -2.09514 | 0.912345 | -2.2964 | 0.02165** |
| Mean dependent var | 0.802956 | S.D. dependent var | 0.398749 | |
| McFadden R-squared | 0.539116 | Adjusted R-squared | 0.420002 | |
| Log-likelihood | -46.43148 | Akaike criterion | 116.8630 | |
| Schwarz criterion | 156.6214 | Hannan-Quinn | 132.9476 |
Table text extracted from the original PDF; superscript letters are shown inline. The original table image is below.
View original table image
References
7 in the original paper- Akpan M, Wakili A, Akosim C. Fuel Wood Consumption Pattern in Bauchi State: A Guide for Energy Planners in Nigeria. An International Journal of Agricultural Science, Environment and Technology. 2007;7(1);126-150. Retrieved from ASSET On 20 th July 2012.
- Energy Commission of Nigeria. Assessment of Energy options and Strategies for Nigeria: Energy Demand, Supply and Environmental Analysis for Sustainable Energy Development (2000-2030); c2008.
- National Bureau of Statistics. Nigeria Abstract of Statistics 2009. Federal Republic of Nigeria; c2009.
- International Energy Agency (IEA)). Energy poverty - how to make modern energy access universal' World Energy Outlook, 2010. Paris, France; c2010.
- Onyekuru N, Eboh E. Determinants of Cooking Energy Demand in the Rural Households of Enugu State, Nigeria: An Application of the Bivariate Probit Model. ASIAN journal exp. biological science. 2011;2(2):332.
- Sambo AS. Matching Electricity Supply with Demand in Nigeria. International Association for Energy Economics. Retrieved from Sheilah M & Alison B (2002), Significance of energy for poor urban livelihoods: Its contribution to poverty reduction. DPU news; c2009. p. 44.
- Shittu A, Idowu A, Otunaiya A, Ismail A. The demand for energy among households in Ijebu division, Ogun state, Nigeria. Journal of the Agricultural Science. Agrekon. 2004;43(1):38-51.